


Hello traders. We have remained long the S&P 500 since SPX reached our Blue Box buying zone in March, when the setup was first presented to members. Since then, the index has advanced approximately 20%. In this technical article, we revisit the Elliott Wave setup that identified the buying opportunity and examine the price structure behind the ongoing SPX rally.
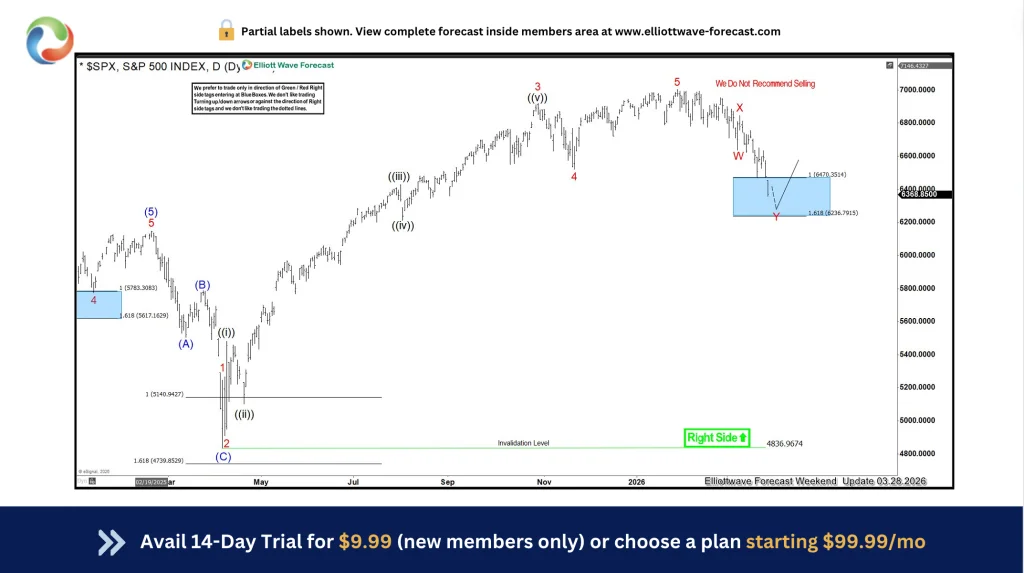
SPX Elliott Wave Daily Chart 03.28.2026
The chart below shows the SPX trading setup presented to our members. At the time, the index was developing a three-wave pullback in the form of an Elliott Wave Double Three pattern.
The decline from the main peak reached the 6,470.35–6,236.79 extreme area. We identified this region as our Blue Box buying zone and looked to enter long positions there.
The strategy was straightforward: enter within the equal-legs area, with the 1.618 Fibonacci extension at 6,236.79 serving as the invalidation level. Once SPX recovered 50% of the decline from the red X peak, we would move the stop to breakeven, making the position risk-free.
Official trading strategy on How to trade 3, 7, or 11 swing and equal leg is explained in details in Educational Video, available for members viewing inside the membership area.
Quick reminder on how to trade our charts :
Red bearish stamp+ blue box = Selling Setup
Green bullish stamp+ blue box = Buying Setup
Charts with Black stamps are not tradable.
[Image download failed: original image removed]
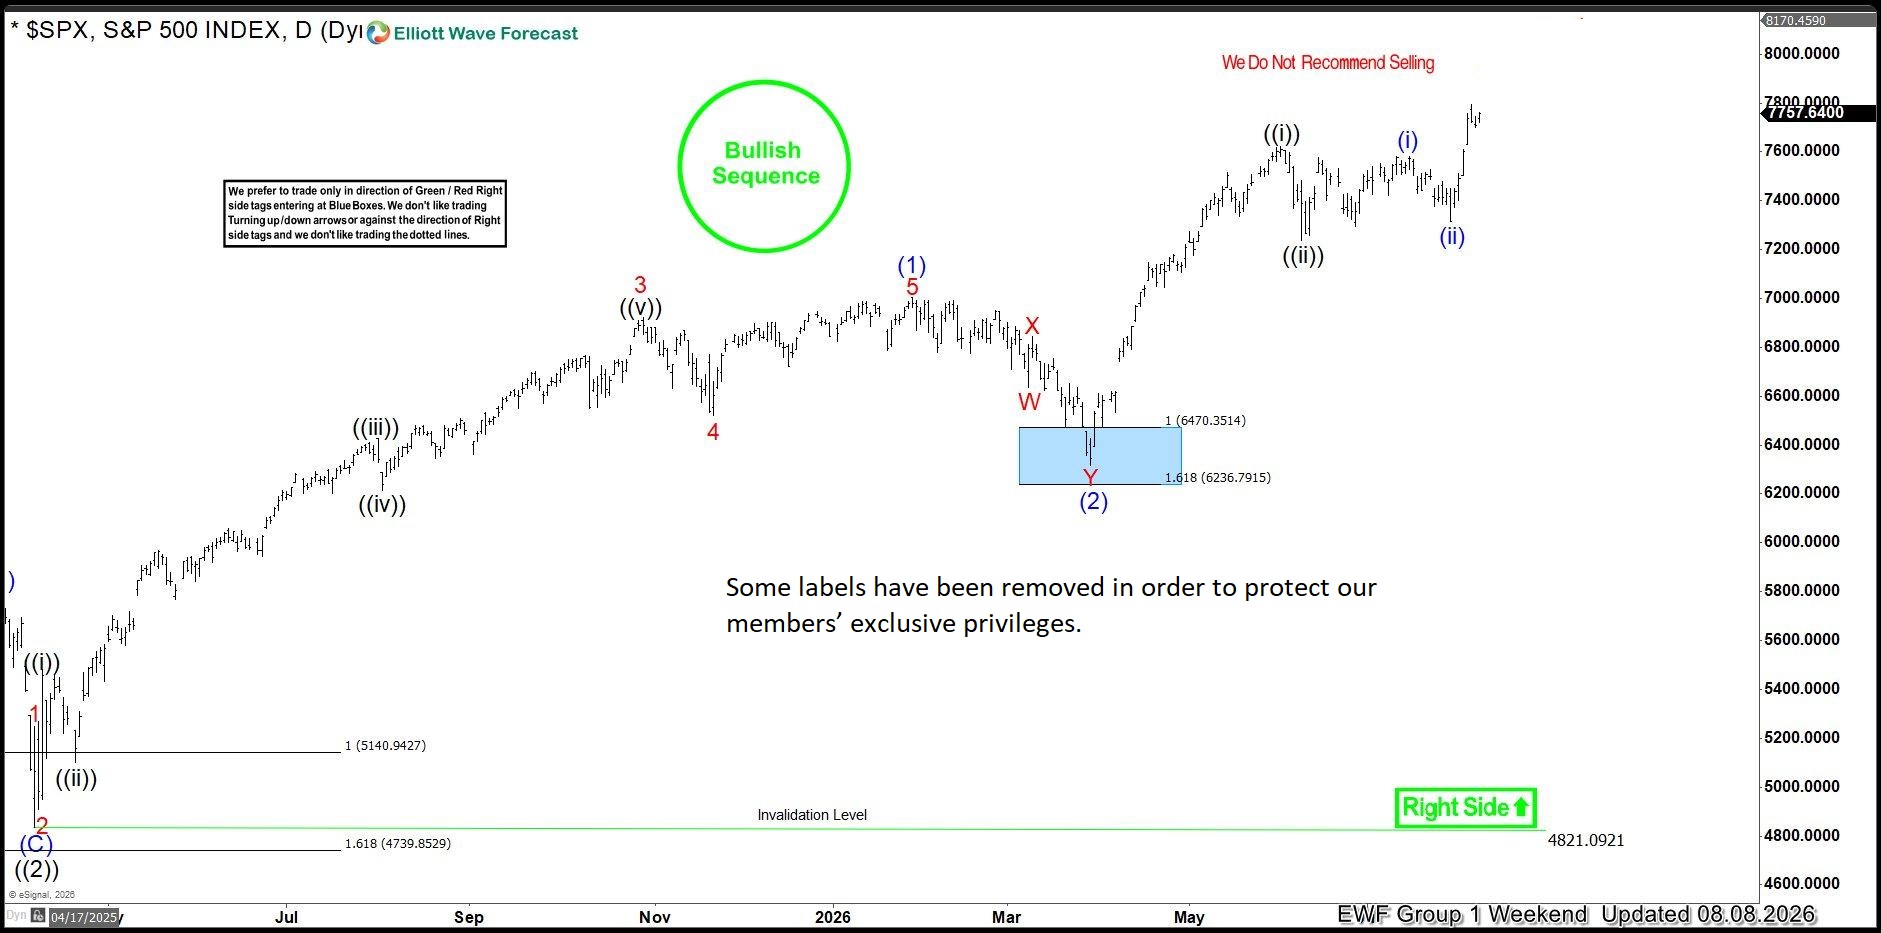
SPX Elliott Wave Daily Chart 08.09.2026
SPX completed the expected decline into our Blue Box buying zone, where buyers entered the market as anticipated. From our entry at 6,470, the index rallied strongly to new all-time highs. The move delivered a gain of approximately 20% in less than six months.
Note: Certain labels have been removed from the chart. Our members receive the complete version with all labels and additional details.
Our member chat rooms are open 24/7 and provide ongoing expert guidance on market trends and Elliott Wave analysis. Members are encouraged to ask questions about market structure and technical setups at any time.
The Next Opportunity Is Already Forming.
Every trading session creates new opportunities. Some traders recognize them early. Others only see them after the move has already happened.
The difference isn’t luck. It’s preparation.
At Elliott Wave Forecast, our analysts monitor 78 global markets every day, identifying potential Elliott Wave setups and helping traders develop a more structured approach to the markets.
As a member, you’ll get more than daily analysis. You’ll gain a process designed to help you analyze opportunities, manage risk, and make decisions with greater confidence.





