Hello, fellow traders. In this technical blog, we’ll take a quick look at the Elliott Wave charts for the FTSE Index, published in the members’ area of the website. Recently, FTSE formed an Elliott Wave Zig Zag correction within the cycle from the 10989.94 peak. In the analysis below, we’ll examine the current structure and identify the potential path for the index.
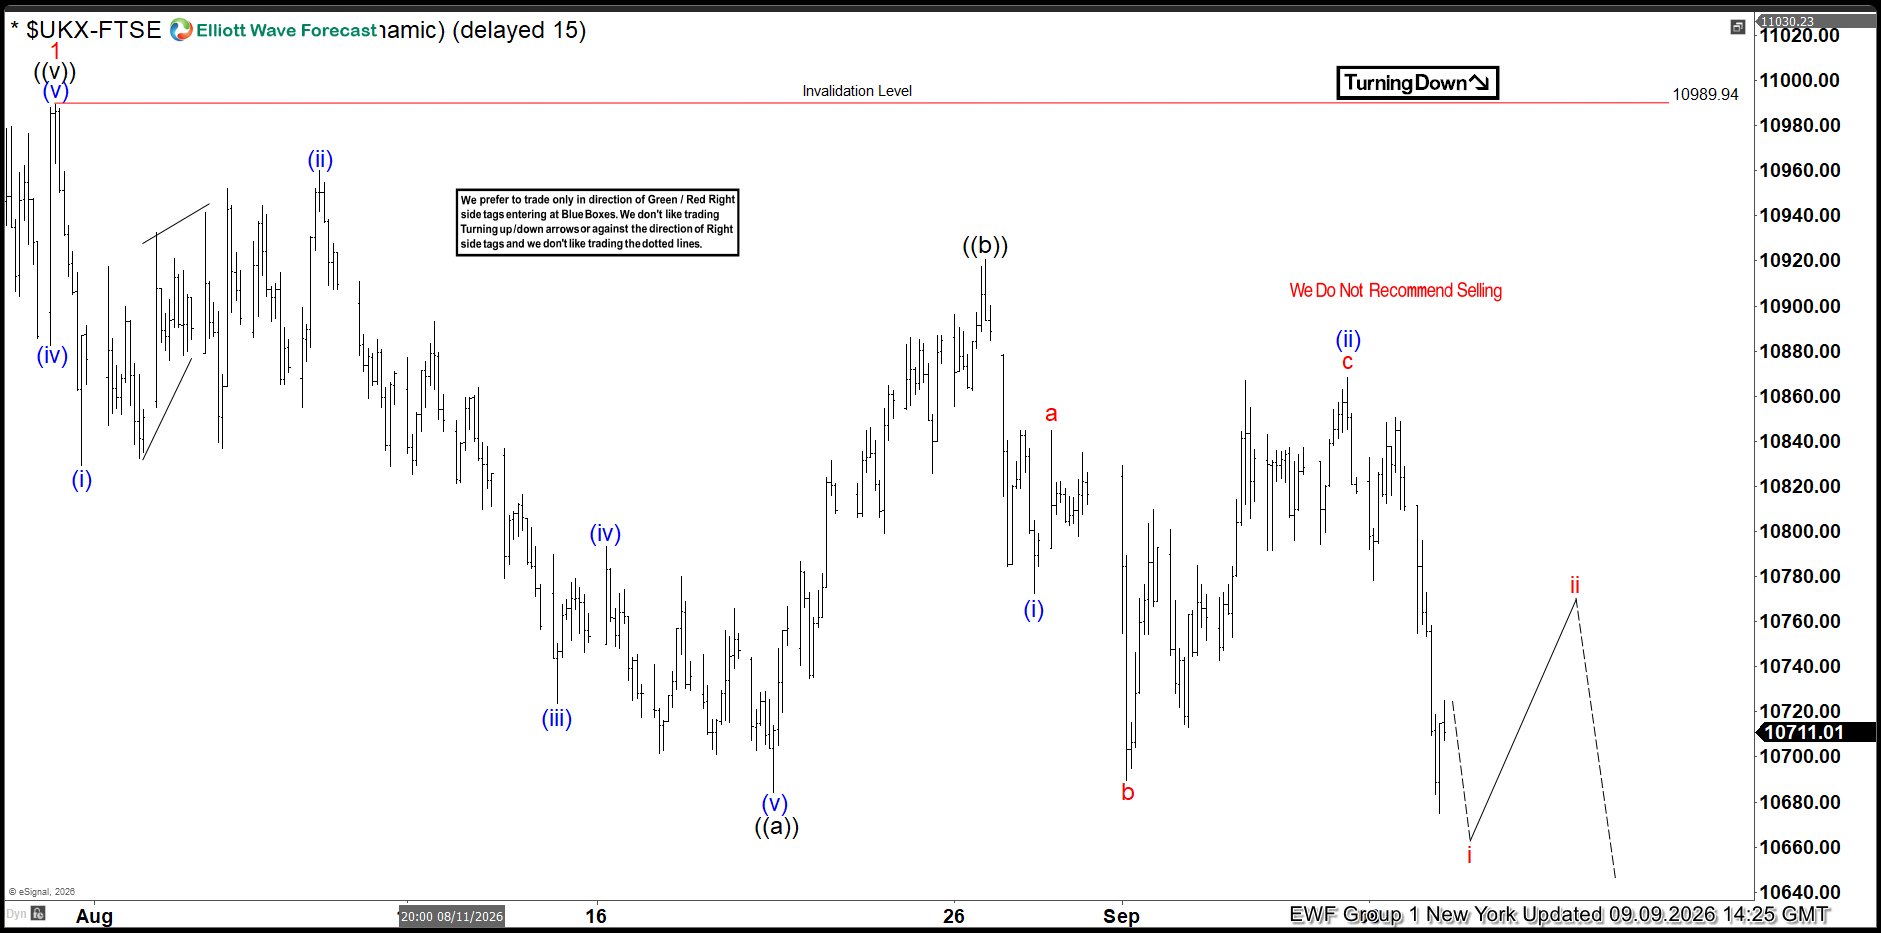
FTSE Elliott Wave 1-Hour Chart – 09.09.2026
FTSE remains within the cycle from the 10989.94 peak. Recently, the index made a new short-term low, indicating that the corrective structure is still incomplete. As our members know, incomplete swing structures can provide valuable clues when assessing the market’s next potential move.
The current Elliott Wave view suggests that FTSE may see further short-term weakness before the next rally develops. The expected target is measured using the Fibonacci Extension tool.
The pullback is taking the form of an Elliott Wave Zig Zag pattern. Based on this structure, we identify a potential reversal and buying area by measuring the ((a))-((b)) Equal Legs zone with the Fibonacci Extension tool.
In this case, the Equal Legs area comes at 10615.92–10543.60. If the index reaches this zone, we expect buyers to step in and regain control. From there, FTSE could start a three-wave bounce, at least in the short term.
You can learn more about Elliott Wave Patterns at our Free Elliott Wave Educational Web Page
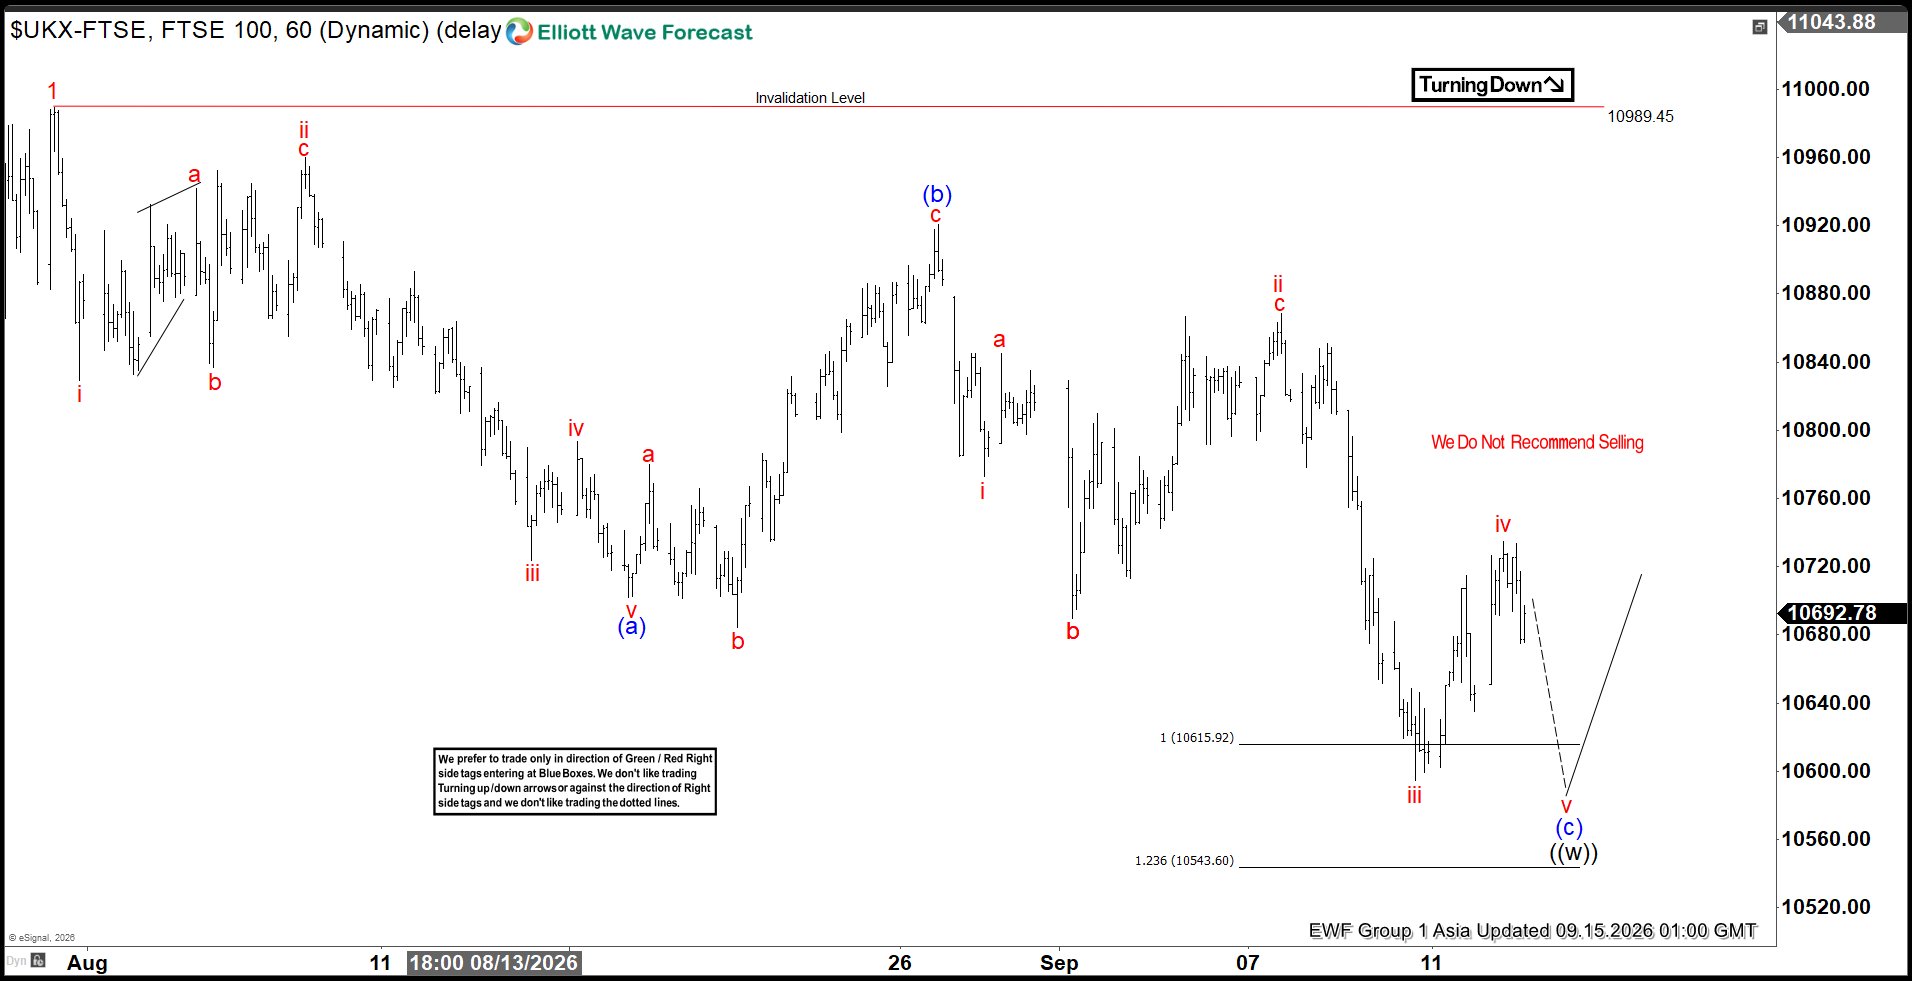
FTSE Elliott Wave 1-Hour Chart – 09.15.2026
FTSE made the expected decline and reached the extreme zone. As Elliott Wave practitioners know, a Zig Zag is a 5-3-5 structure. Since we already have five waves within the first leg, (a), we should ideally see a five-wave structure within the (c) leg as well.So far, we can count three waves within wave (c), which suggests that one more wave is still missing to complete the structure.
The current view suggests that FTSE may make one more marginal push lower within the marked area before the next rally takes place.
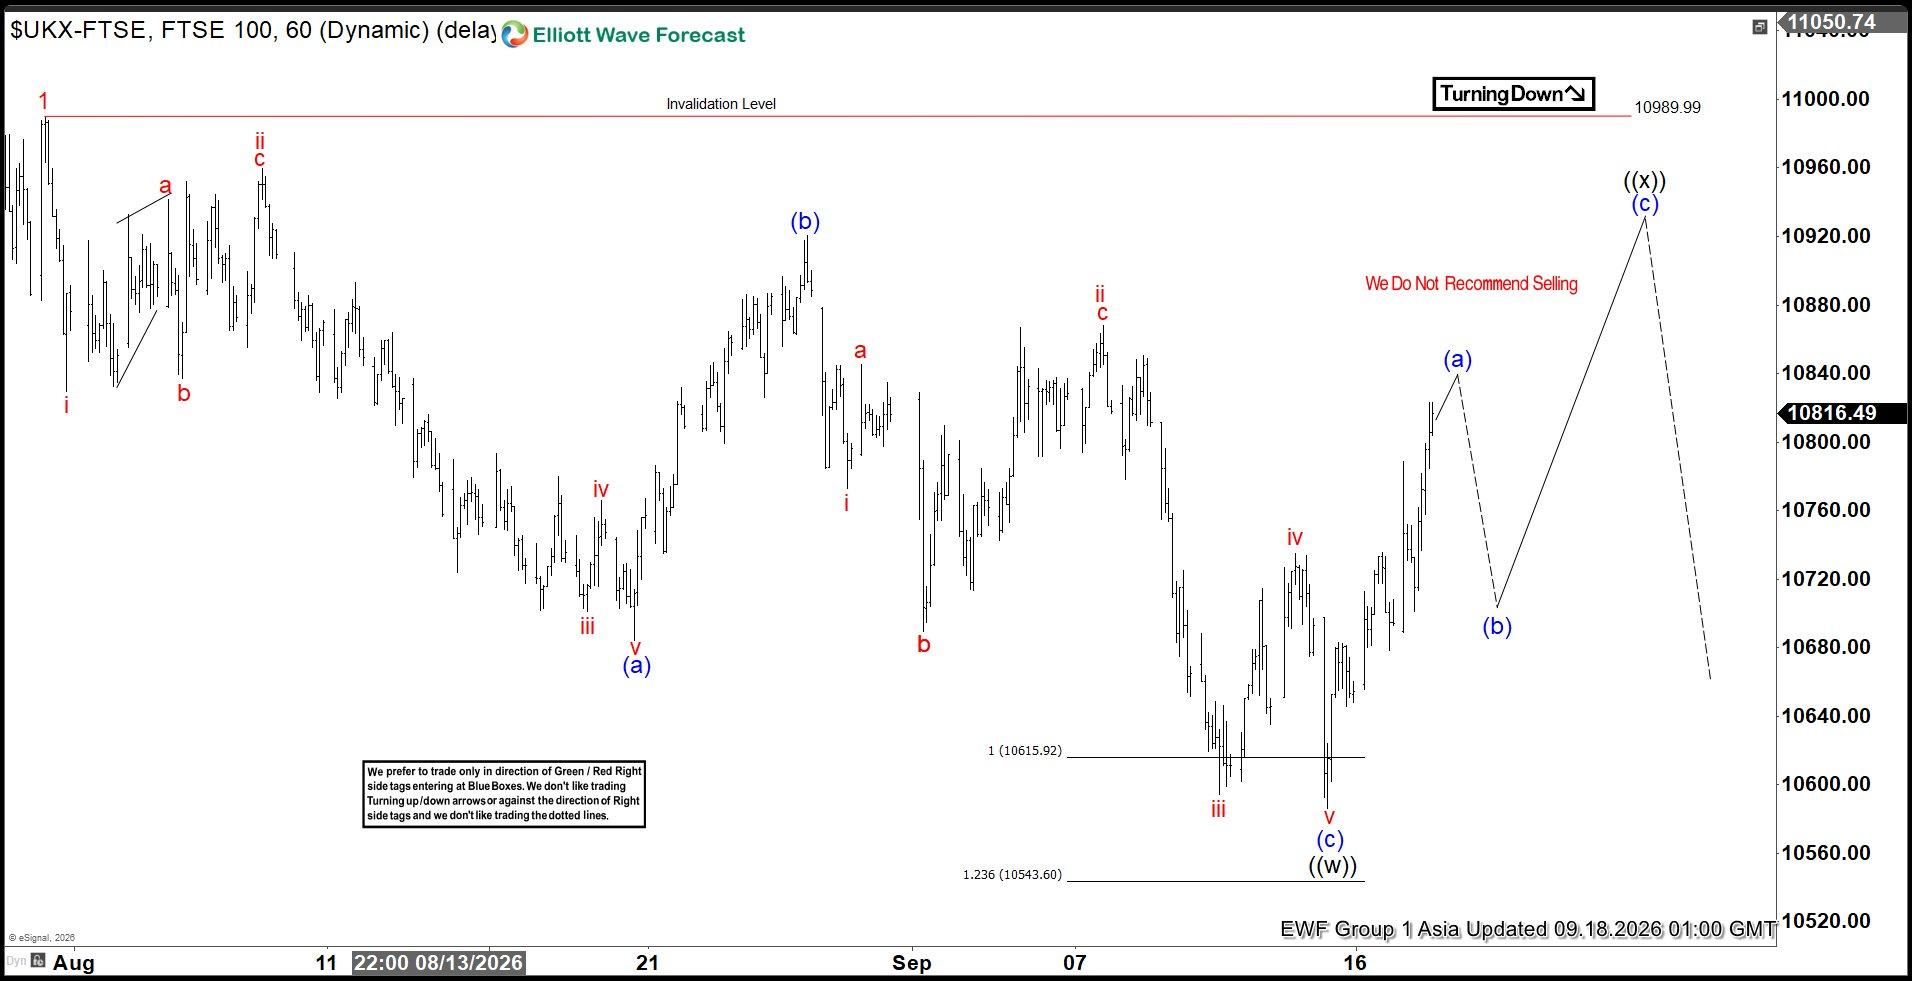
FTSE Elliott Wave 1-Hour Chart – 09.18.2026
FTSE made proposed wave down and gave us 5 waves within (c) leg. Buuers appeared at the buying zone :10615.92–10543.60 as expected and we got decent rally from there.
Keep in mind that the market is dynamic, and the outlook may have changed in the meantime. Our member Chat Rooms are open 24 hours a day, Monday through Friday, on trading days, providing ongoing expert guidance on market trends and Elliott Wave analysis. Members can ask questions about market structure and technical setups at any time during trading days.