Key takeaways
- Trump–Xi may extend the trade truce, but firm tariff cuts and timelines are needed to prevent a sell-the-fact reversal.
- Rare-earth licences and AI-chip rules are the key swing factors for USD/CNH, Hong Kong 33 and the Nasdaq 100.
- AUD/USD is the cleaner China-growth trade, while the Singapore 30 provides lower-beta regional exposure. Look for yuan confirmation.
President Trump will host President Xi in Washington on 24 September 2026. Markets are already leaning towards a constructive outcome, with US semiconductor stocks, Asian technology stocks, the yuan, and Hong Kong equities strengthening ahead of the meeting.
The catalysts for the current bullish tone have been “smoothing rhetoric” from US and Chinese officials ahead of the Trump-Xi summit meet-up.
Last weekend’s “warm-up meeting” between the US Treasury Secretary Scott Bessent and China’s top trade negotiator, Li Chenggang, was peppered with encouraging signs of engagement on Artificial Intelligence (AI), a key sensitive technological issue where both sides are now vying for a supremacy position in that will likely allow the leading country to reign over geopolitics, international finance and military affairs.
Bessent said both sides have agreed to create a “US-China AI dialogue” that is intended to develop a common understanding of the cutting-edge technology’s benefits and threats.
In addition, US Trade Representative Jamieson Greer told media outlets that while the US remains divided on the terms of a US-China trade truce extension, with the current deadline set on 10 November 2026, but expressed optimism that Washington could support a further extension of three to six months.
This raises the hurdle for further gains: an extension of the existing truce may be treated as a “sell-the-fact” outcome unless it includes measurable commitments.
Five key highlights
Duration and scope of the trade truce
The current truce expires on 10 November. The immediate question is whether it is extended for six months, one year or longer, and whether the extension prevents new tariffs and export controls.
Watch for progress on the proposed Board of Trade and reciprocal tariff reductions covering roughly US$30 billion of goods.
Rare-earth exports and critical-mineral licences
Washington wants more reliable flows of Chinese rare-earth magnets and critical minerals. China controls around 70% of global mining and more than 85% of refining and production, giving Beijing significant negotiating leverage.
A concrete licensing mechanism would be more market-positive than another general promise to maintain supplies.
AI chips and technology restrictions
The critical issue is whether the AI dialogue remains focused on safety or expands into semiconductor export licensing.
Any easing of access to advanced US chips would support semiconductor sentiment, while tighter controls or accusations of model theft would weigh on the Nasdaq 100 and chipmakers.
Soybeans, Boeing and measurable Chinese purchases
Markets will look for specific purchase volumes and implementation dates. Earlier commitments included additional US agricultural purchases and more than 200 Boeing aircraft, but several elements remain incomplete.
A headline without tonnage, dollar value or delivery schedules is unlikely to sustain a rally.
Taiwan and Iran are the geopolitical tail risks
Taiwan remains the most dangerous issue because a shift in US language or new arms-sale threats could overwhelm progress on trade.
China’s economic relationship with Iran is another potential source of friction. These issues matter because they could turn a commercially constructive summit into a broader strategic confrontation.
Top five tradeable assets
| Asset | Constructive summit | Disappointing summit | Positioning ahead |
|---|---|---|---|
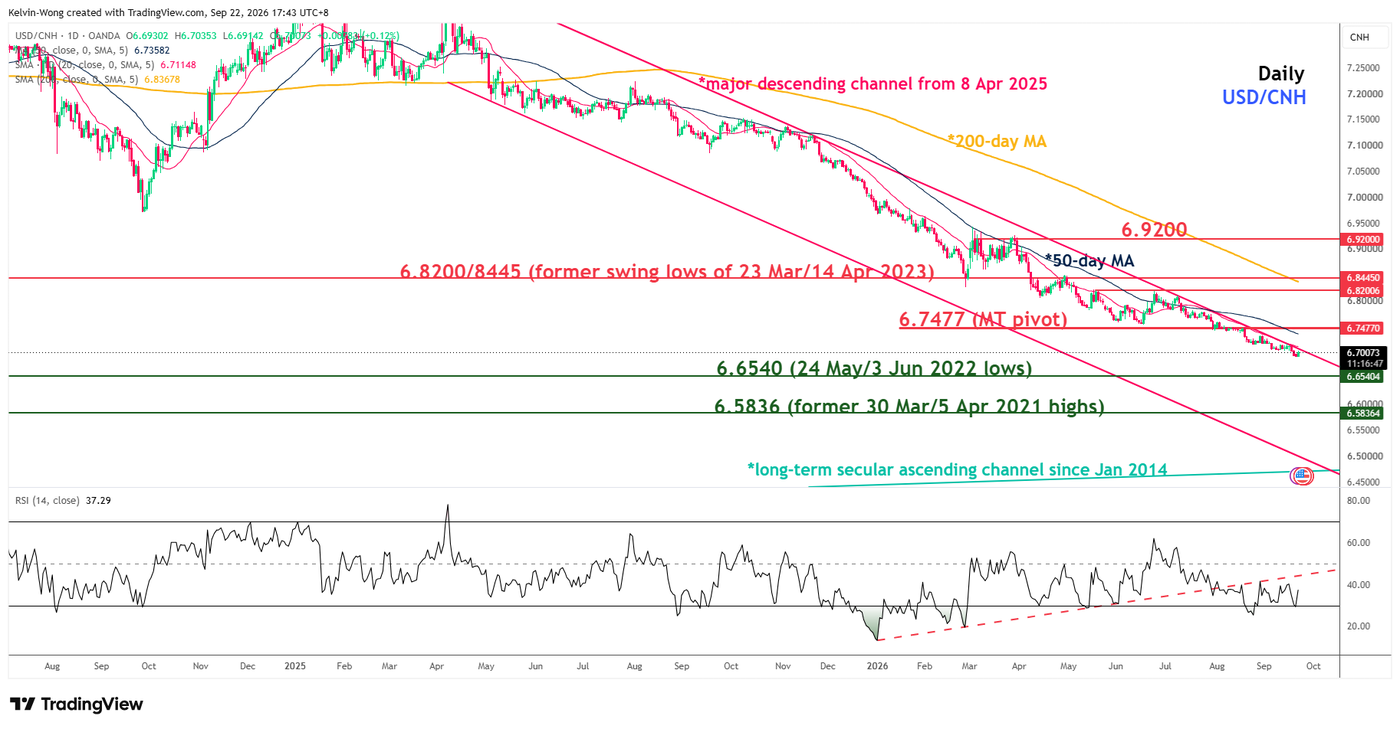
| USD/CNH | Falls as the yuan strengthens. | USD rises on renewed tariff risk. | The cleanest summit trade. The USD/CNH has been trading in a major downtrend since the 8 April 2025 high of 7.4294.Bearish momentum accelerated via the breakdown below the 8 February 2023 low of 6.7740. Now, it is trading near a 52-week low of 6.7000. If |
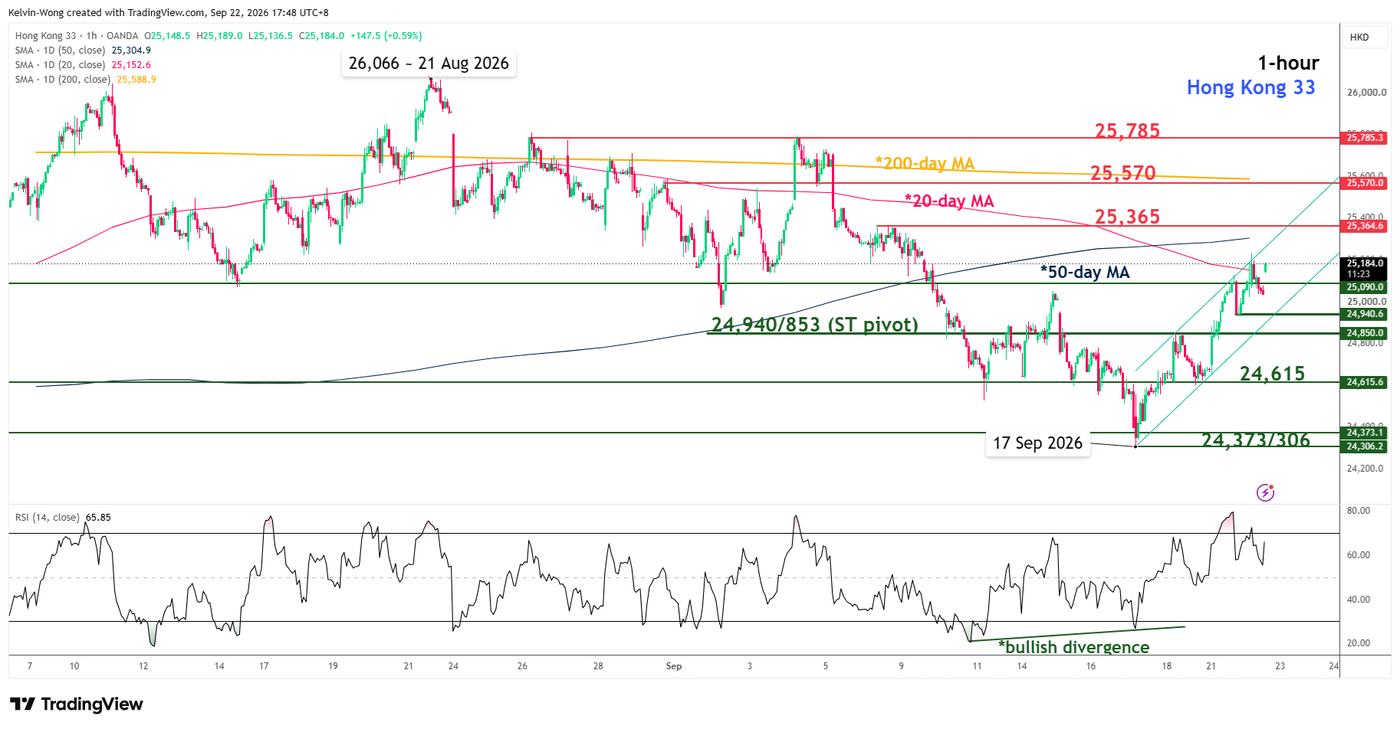
| Hong Kong 33 | Gains on tariff relief and lower China risk premium. | Vulnerable to profit-taking. | The Hong Kong 33 has staged three consecutive sessions of rallies (+2.85%), with summit optimism already partly priced in.Watch for any potential minor pullbacks to establish better reward/risk set-ups at or near the intermediate pivotal support zone of 24,940/850, with next intermediate resistances at 25,365 and 25,570 (also the 200-day MA) (see Fig. 2). |
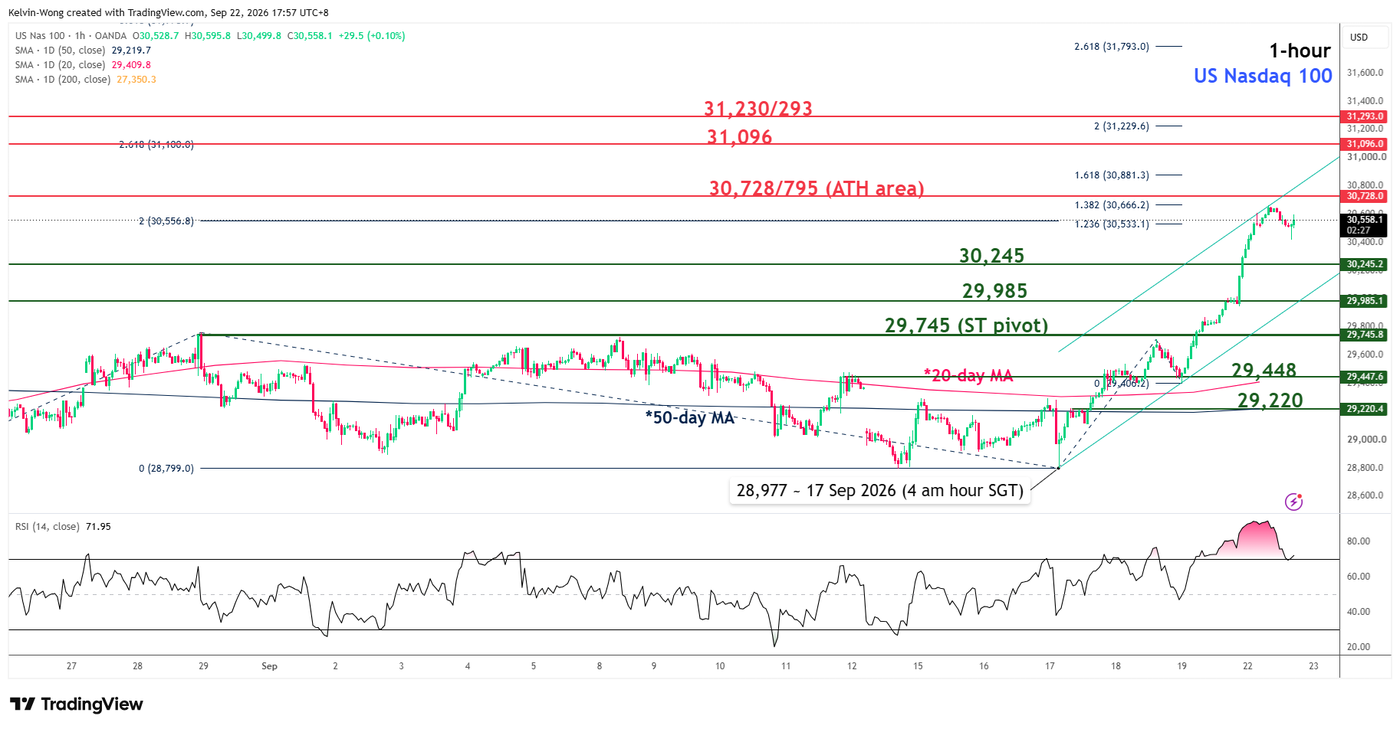
| Nasdaq 100 | Benefits if AI-chip restrictions ease. | Falls if controls tighten. | Keep pre-event exposure modest as the US Nasdaq 100 CFD has rallied steeply by 2.8% on Monday, 21 September 2026.Watch for any potential minor pullbacks to establish better reward/risk set-ups at or near the intermediate support zone of 30,245/29,985. In conjunction, the catalyst for the next bullish |
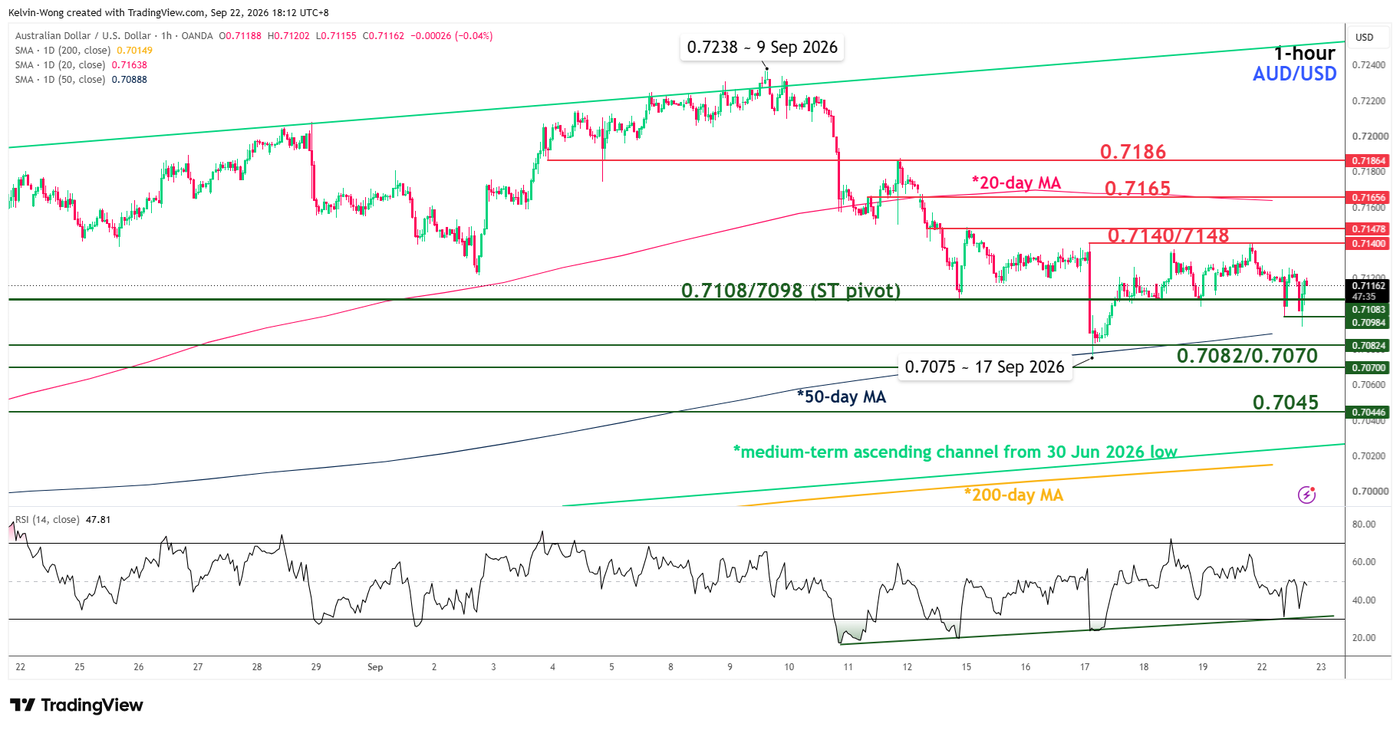
| AUD/USD | Rises as improved China sentiment supports the Australian dollar’s commodity and growth sensitivity. | Falls as risk aversion strengthens the USD. | AUD/USD has traded in a range between 0.7148 and 0.7080 after a minor bullish reversal at the retest of its 50-day MA (0.7077) ex-post the FOMC.Bulls need to break above the 0.7148 (range resistance & pre-summit high) to gain a potential foothold towards the intermediate resistances of 0.7165 and 0.7186 (see Fig. 4). Hawkish Fed repricing remains a potential upside constraint. |
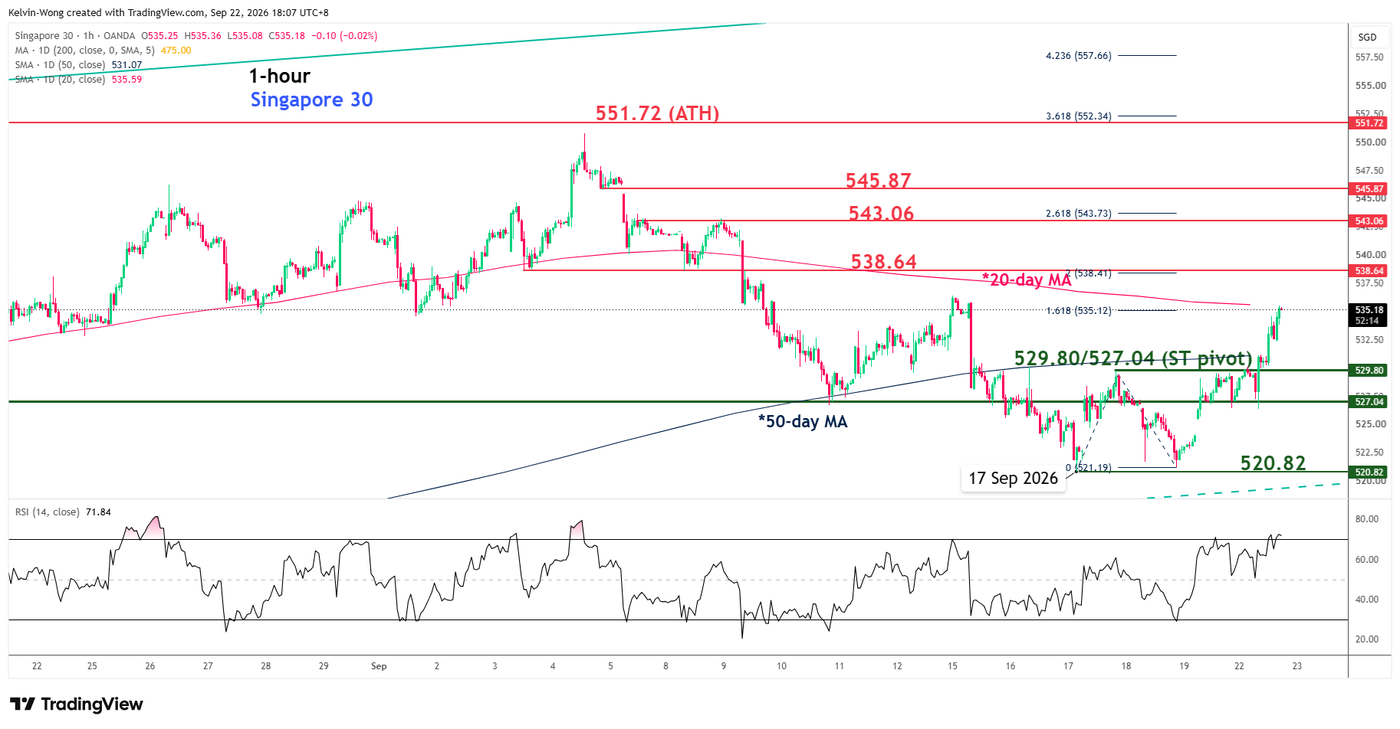
| Singapore STI / Singapore 30 | Rises as improved China sentiment supports the Australian dollar’s commodity and growth sensitivity. | Likely underperforms Hong Kong on the downside but still faces regional risk-off pressure. |
A small bullish position may provide lower-beta exposure to Asia, given Singapore equities’ defensive nature.The Singapore 30 CFD has managed to re-integrate above its 50-day MA after briefly trading below it from 15 to 21 September 2026. Watch the 529.80/527.04 key intermediate pivotal In conjunction, watch for the ex-post summit movement |
The critical price actions confirmation would be simultaneous strength in AUD/USD and Hong Kong equities alongside a decline in USD/CNH. If that cross-asset confirmation is absent, any initial risk-on reaction may be vulnerable to reversal.
USD/CNH – Still oscillating within a major downtrend phase
Fig. 1: USD/CNH medium-term trend as of 22 Sep 2026 (Source: TradingView). The information presented is historical information, and past performance is not indicative of future performance
Hong Kong 33 – Transforming into a minor uptrend phase since 17 September
Fig. 2: Hong Kong 33 minor trend as of 22 Sep 2026 (Source: TradingView). The information presented is historical information, and past performance is not indicative of future performance
US Nasdaq 100 – Minor pullback towards 30,245/29,985 before new bullish leg
Fig. 3: US Nasdaq 100 CFD minor trend as of 22 Sep 2026 (Source: TradingView). The information presented is historical information, and past performance is not indicative of future performance
AUD/USD – Watch the 0.7148 range resistance for a bullish breakout
Fig. 4: AUD/USD minor trend as of 22 Sep 2026 (Source: TradingView). The information presented is historical information, and past performance is not indicative of future performance
Singapore 30 – Recovered above 50-day MA
Fig. 5: Singapore 30 CFD minor trend as of 22 Sep 2026 (Source: TradingView). The information presented is historical information, and past performance is not indicative of future performance