


US consumer spending accelerated sharply in August even as income growth weakened. Personal spending rose from a revised 0.1% to 0.9% m/m, beating expectations of 0.8%, while personal income slowed from a revised 0.3% to 0.2%, missing the 0.5% consensus. The strength was not simply a price effect: real PCE increased 0.6% m/m, while real disposable personal income was unchanged. That left households spending considerably faster than incomes were growing, with the personal saving rate at 4.1%.
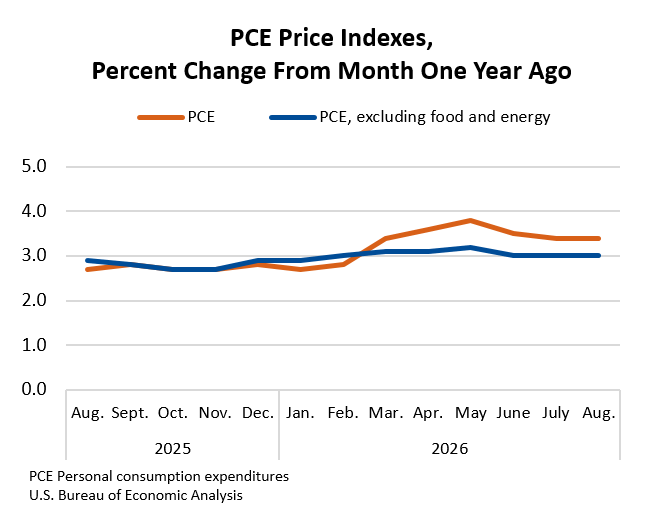
Inflation, however, came in softer than expected. The PCE Price Index rose from a revised 0.1% to 0.3% m/m, below the 0.4% forecast, while core PCE increased from 0.1% to 0.2% m/m, undershooting expectations of 0.3%. On an annual basis, headline PCE inflation was 3.4% y/y versus 3.7% expected, while core inflation was 3.0% y/y against a 3.4% consensus. The large annual misses were influenced by revisions associated with the BEA’s annual update, making the monthly readings the cleaner indication that August inflation itself came in softer than markets had anticipated.
The report therefore sends a stronger-demand, softer-inflation signal. Consumers maintained considerable spending momentum despite weak income growth, but the expected reacceleration in underlying inflation failed to materialize. That makes the release less hawkish than the pre-release consensus suggested on prices, while the 0.6% increase in real consumption argues against interpreting it as evidence of a rapidly weakening economy. The tension now lies between resilient consumer demand and surprisingly contained monthly inflation pressure.
Income and Spending — Data Summary
| Indicator | Previous | Current | Expected |
|---|---|---|---|
| Personal Income, m/m | +0.3% | +0.2% | +0.5% |
| Personal Spending, m/m | +0.1% | +0.9% | +0.8% |
| Disposable Personal Income, m/m | +0.4% | +0.3% | — |
| Real Disposable Personal Income, m/m | +0.3% | 0.0% | — |
| Real PCE, m/m | +0.1% | +0.6% | — |
Consumer spending accelerated much more sharply than income, while real consumption rose 0.6% m/m even as real disposable income was flat. The personal saving rate stood at 4.1%.
PCE Inflation — Data Summary
| Indicator | Previous | Current | Expected |
|---|---|---|---|
| PCE Price Index, m/m | +0.1% | +0.3% | +0.4% |
| PCE Price Index, y/y | +3.4% | +3.4% | +3.7% |
| Core PCE Price Index, m/m | +0.1% | +0.2% | +0.3% |
| Core PCE Price Index, y/y | +3.0% | +3.0% | +3.4% |
The annual comparison incorporates revisions from the BEA’s annual update, so the monthly misses provide the cleaner measure of the August surprise: headline PCE rose 0.3% m/m versus 0.4% expected, while core PCE rose 0.2% m/m versus 0.3% expected.
Key Takeaways
- Consumer spending jumped 0.9% m/m, beating the 0.8% forecast and accelerating sharply from 0.1%.
- The strength persisted after adjusting for inflation, with real PCE rising 0.6% m/m.
- Personal income disappointed, slowing from 0.3% to 0.2% m/m against expectations of 0.5%.
- Real disposable income was flat m/m, highlighting a widening gap between household spending and income growth.
- The expected inflation reacceleration failed to materialize. Headline PCE rose 0.3% m/m versus 0.4% expected, while core PCE rose 0.2% m/m versus 0.3% expected.
- Annual headline PCE held at 3.4% y/y, while core PCE remained at 3.0% y/y. Both were below pre-release forecasts, although revisions contributed to the size of the annual misses.
- Overall, the report delivers a stronger-demand, softer-inflation combination: consumption remains resilient, but August did not confirm the inflation acceleration markets had expected.





