Hello fellow traders,
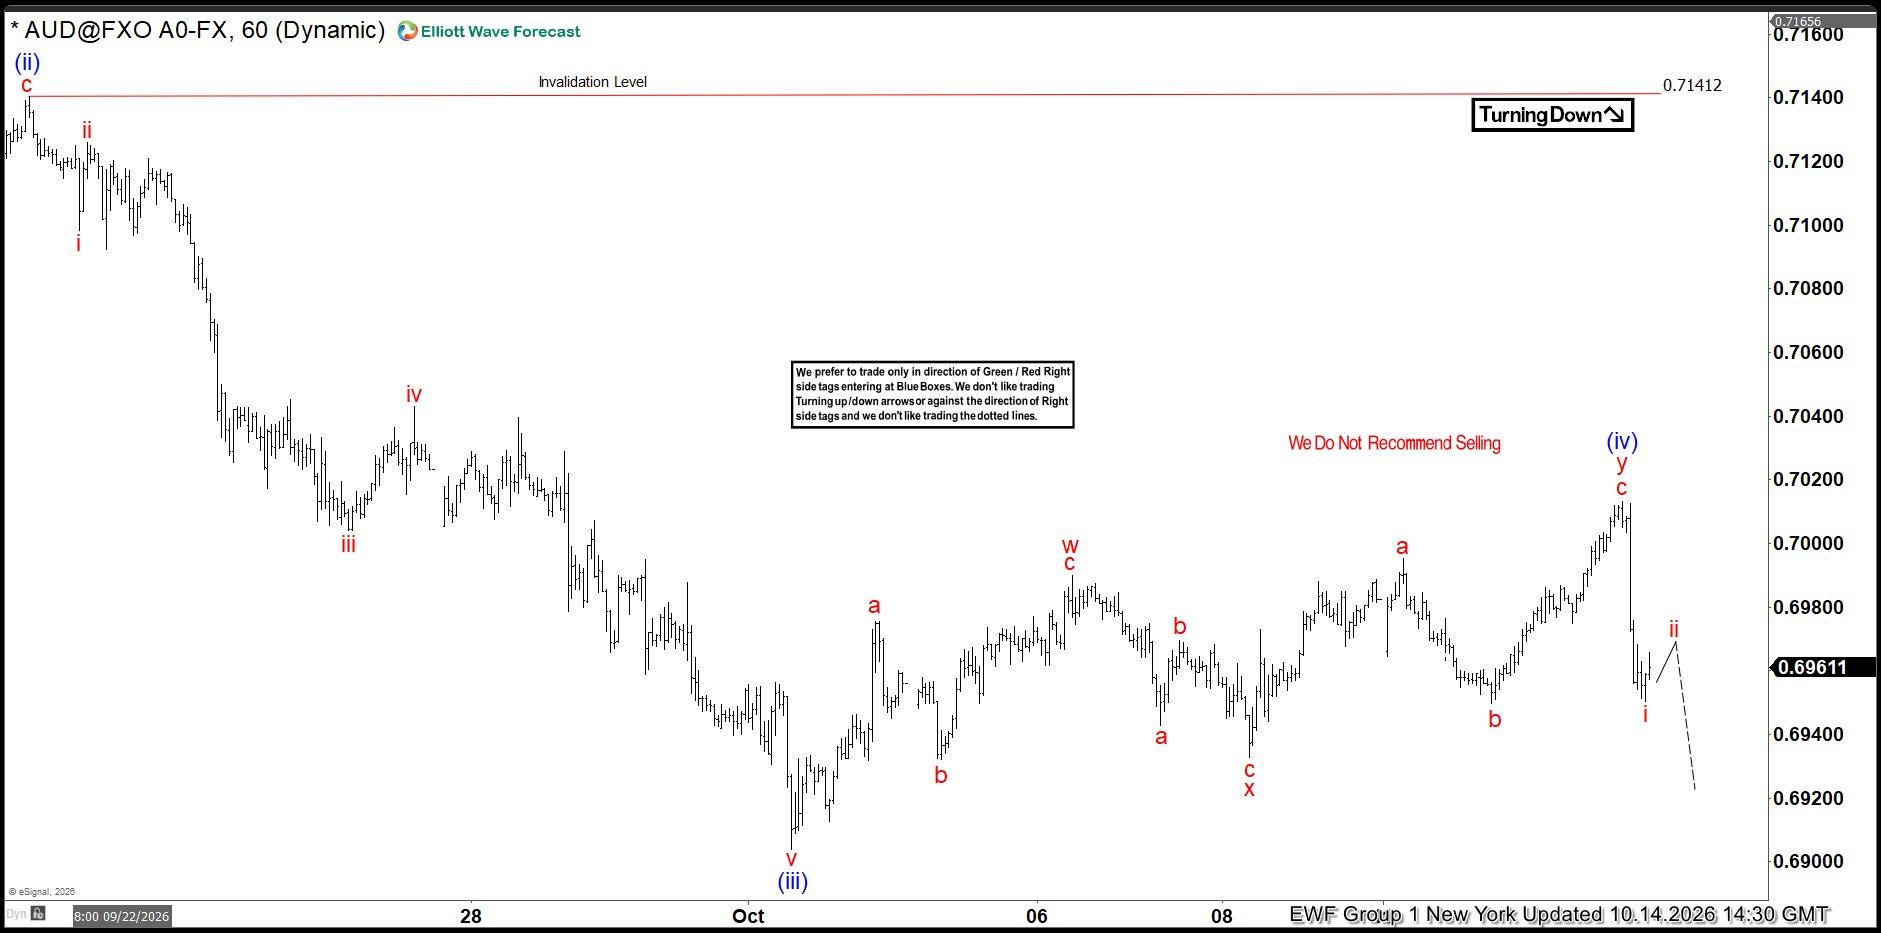
In this technical article, we’ll take a look at the AUDUSD Elliott Wave charts published in our members’ area. As our members know, AUDUSD has been trading within a cycle that started at the 0.7236 peak. Recently, the pair completed a clear three-wave recovery, forming an Elliott Wave Double Three pattern. As expected, sellers stepped in, pushing the price lower.
In this update, we’ll break down the Elliott Wave structure and examine the near-term outlook for AUDUSD. Before looking at the real market example, let’s first explain the Double Three pattern and how it works within the Elliott Wave framework.
Elliott Wave Double Three Pattern
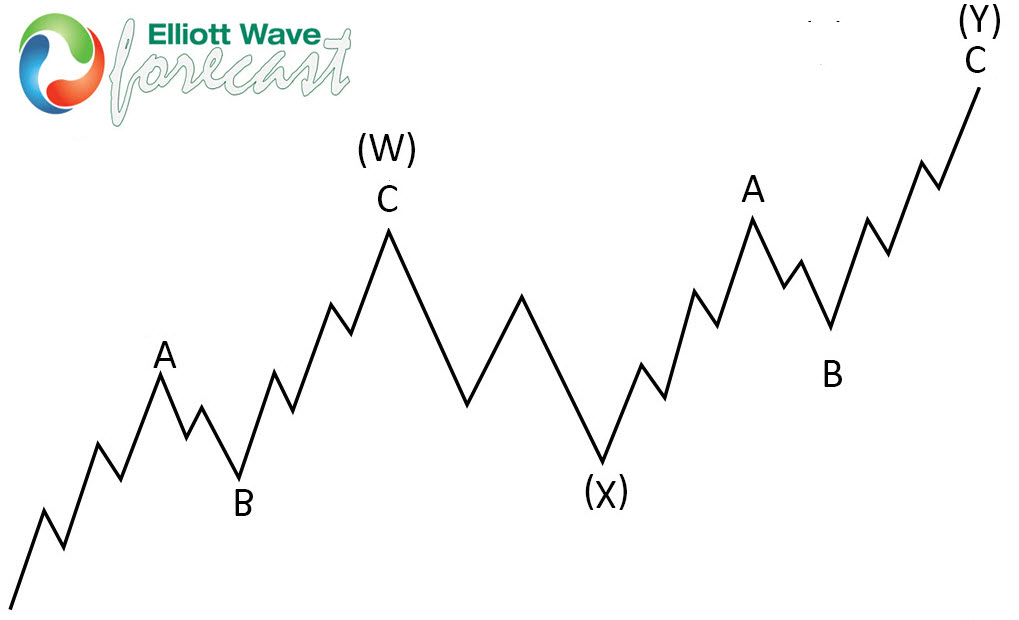
Double three is the common pattern in the market , also known as 7 swing structure. It’s a reliable pattern which is giving us good trading entries with clearly defined invalidation levels.
The picture below presents what Elliott Wave Double Three pattern looks like. It has (W),(X),(Y) labeling and 3,3,3 inner structure, which means all of these 3 legs are corrective sequences. Each (W) and (Y) are made of 3 swings , they’re having A,B,C structure in lower degree, or alternatively they can have W,X,Y labeling.
AUDUSD Elliott Wave 1 Hour Chart 10.12.2026
AUDUSD is correcting the cycle from the 0.7142 peak, with wave (iv) still in progress. The current structure suggests an Elliott Wave Double Three pattern, with one more leg higher needed to complete the seven swings. At Elliott Wave Forecast, we use the Equal Legs technique to identify high-probability trading zones. By projecting the 1.0–1.236 Fibonacci extension of wave w from the end of wave x, we identified a potential sellers’ zone around 0.7018 area.
Official trading strategy on How to trade 3, 7, or 11 swing and equal leg is explained in details in Educational Video, available for members viewing inside the membership area.
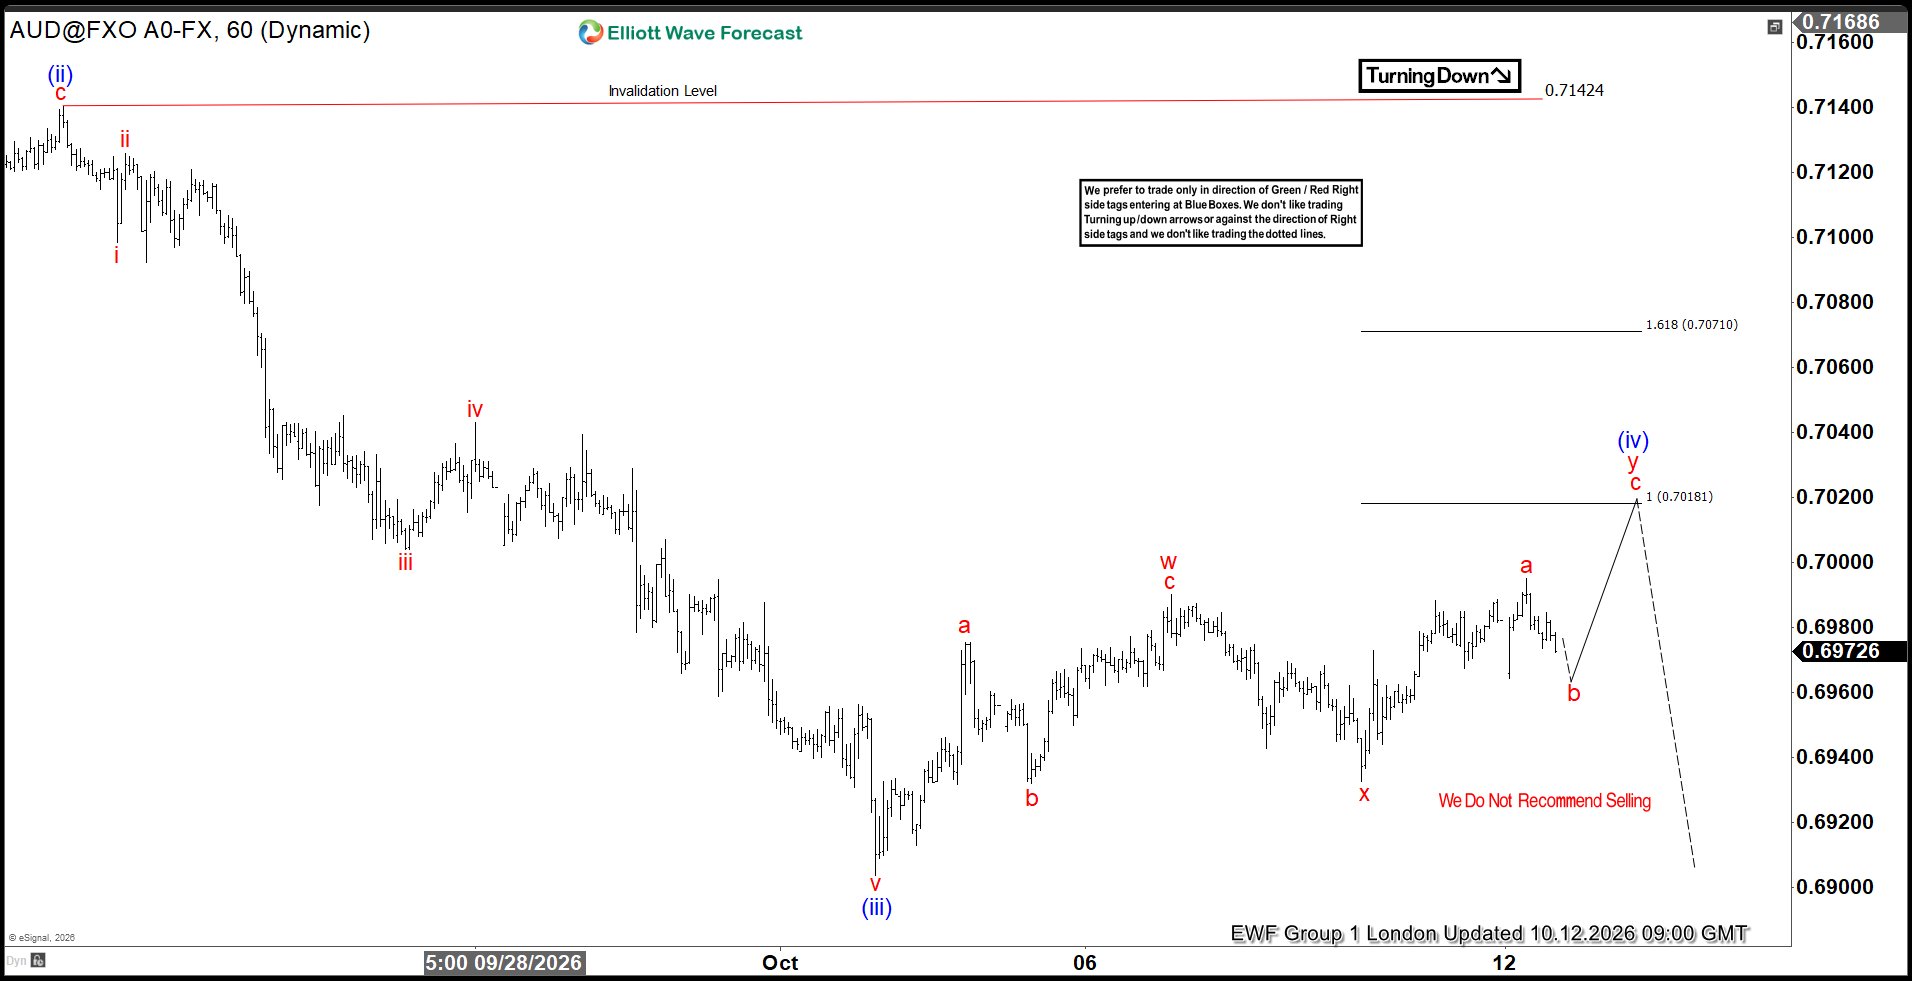
AUDUSD Elliott Wave 1 Hour Chart 10.12.2026
AUDUSD came within just a few points of the 0.7018 Equal Legs zone before reversing lower, completing the Double Three pattern early. Sellers stepped in aggressively, and we now expect a retest of the previous low. A break below that level would confirm the bearish outlook, opening the way toward the next downside target at 0.6878–0.6836.
Keep in mind that market is dynamic and presented view could have changed in the mean time. You can check most recent charts with target levels in the membership area of the site. Best instruments to trade are those having incomplete bullish or bearish swings sequences. We put them in Sequence Report and best among them are shown in the Live Trading Room