


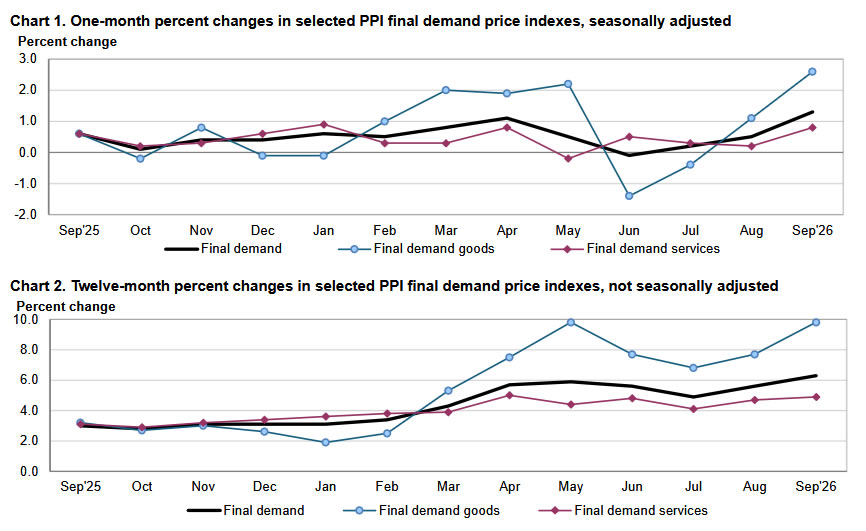
US producer inflation accelerated sharply in September, with headline PPI jumping from 0.5% to 1.3% mom, far exceeding expectations of 0.5%. According to the Bureau of Labor Statistics, the increase was the largest since March 2022. Annual producer inflation climbed from a revised 5.6% to 6.3% yoy, above forecasts of 5.3% and the highest since December 2022. More importantly, core PPI excluding food and energy accelerated from 0.2% to 0.7% mom, more than double the expected 0.3% increase. Annual core inflation also strengthened from 4.8% to 5.0%, exceeding forecasts of 4.4%. Meanwhile, the narrower measure excluding food, energy and trade services rose from 0.3% to 0.5% mom. The simultaneous upside surprises in headline and core inflation indicate that producer price pressures strengthened beyond the direct impact of higher energy prices.
Energy remained the dominant driver of the headline surge, pushing final demand goods inflation from 1.1% to 2.6% mom, the largest increase since the series began in December 2009. Energy prices accelerated from 4.5% to 10.8%, accounting for more than 80% of the rise in goods prices. Gasoline prices alone jumped 20.3%, contributing approximately half of the increase, while diesel, jet fuel and crude petroleum also recorded gains. Food prices rebounded from a 0.3% decline to a 1.2% increase. However, goods prices excluding food and energy actually slowed from 0.4% to 0.3%, underscoring that the extraordinary acceleration in goods inflation was overwhelmingly concentrated in energy, rather than reflecting uniformly stronger price increases across manufactured products.
Services and intermediate input costs nevertheless revealed additional inflation pressures across production and distribution. Final demand services inflation accelerated from 0.2% to 0.8% mom, with trade margins rising from 0.2% to 1.4% and transportation and warehousing costs strengthening from 2.2% to 3.4%. Nearly half of the services increase reflected higher trade margins, while rising freight and transportation charges added to business cost pressures. Further upstream, processed intermediate goods prices accelerated from 1.8% to 2.5%, while unprocessed goods prices surged from 0.9% to 8.4%, largely driven by energy. The figures reinforce concerns about persistent producer inflation, particularly as higher fuel and distribution costs affect multiple stages of production. However, the extent to which businesses ultimately pass these increases on to consumers remains uncertain, with profit margins and pricing decisions determining the transmission of higher input costs.
Data Summary — US September 2026 PPI
Headline Producer Inflation
| Indicator | August | September | Consensus |
|---|---|---|---|
| Headline PPI m/m | +0.5% | +1.3% | +0.5% |
| Headline PPI y/y | +5.6% | +6.3% | +5.3% |
| Core PPI m/m | +0.2% | +0.7% | +0.3% |
| Core PPI y/y | +4.8% | +5.0% | +4.4% |
Core PPI excludes food and energy. Source: US Bureau of Labor Statistics, September 2026 PPI report, released October 15.
Producer Price Components
| Component | August m/m | September m/m |
|---|---|---|
| Final Demand Goods | +1.1% | +2.6% |
| Final Demand Energy | +4.5% | +10.8% |
| Gasoline | +4.4% | +20.3% |
| Final Demand Foods | -0.3% | +1.2% |
| Goods Excluding Food and Energy | +0.4% | +0.3% |
| Final Demand Services | +0.2% | +0.8% |
| Trade Services | +0.2% | +1.4% |
| Transportation and Warehousing | +2.2% | +3.4% |
| Other Services | 0.0% | +0.3% |
| PPI Excluding Food, Energy and Trade Services | +0.3% | +0.5% |
Intermediate Demand Prices
| Component | August m/m | September m/m |
|---|---|---|
| Processed Goods | +1.8% | +2.5% |
| Unprocessed Goods | +0.9% | +8.4% |
| Intermediate Services | +0.7% | +0.9% |
| Processed Energy Goods | +7.3% | +10.2% |
| Unprocessed Energy Materials | +0.2% | +22.2% |
Source: BLS September 2026 PPI report. Figures are seasonally adjusted monthly changes.
Key Takeaways
- US producer inflation delivers a substantial upside surprise: Headline PPI accelerated from 0.5% to 1.3% mom, far exceeding forecasts of 0.5% and recording its largest monthly increase since March 2022. Annual inflation climbed from 5.6% to 6.3%, its highest since December 2022.
- Core inflation also beats forecasts significantly: Core PPI excluding food and energy jumped from 0.2% to 0.7% mom, compared with expectations of 0.3%. Annual core inflation increased from 4.8% to 5.0%, while the narrower measure excluding trade services also strengthened.
- Energy dominates the goods-price surge: Final demand energy prices jumped 10.8% mom, accounting for more than 80% of the increase in goods prices. Gasoline surged 20.3%, contributing approximately half of the goods-price increase. However, goods inflation excluding food and energy moderated slightly.
- Services and transportation costs add to underlying pressure: Final demand services inflation accelerated from 0.2% to 0.8% mom, supported by rising trade margins and transportation costs. Transportation and warehousing prices increased 3.4%, following August’s 2.2% rise.
- Intermediate input prices raise concerns about persistent cost pressures: Unprocessed intermediate goods prices surged 8.4% mom, while processed goods rose 2.5%, both heavily influenced by energy. Higher production and distribution costs could sustain inflation pressures, although the extent of pass-through to consumers remains uncertain.





