


Key Highlights
- WTI Crude Oil started a fresh increase above $96.50 and $100.00.
- A bullish trend line is forming with support at $101.00 on the 4-hour chart of XTI/USD.
- Gold prices tested the $4,000 support and started a consolidation phase.
- EUR/USD could start another decline if it trades below 1.1120.
WTI Crude Oil Price Technical Analysis
WTI Crude Oil prices remained supported above $92.00 against the US Dollar. The price formed a base and started a fresh increase above $98.00.
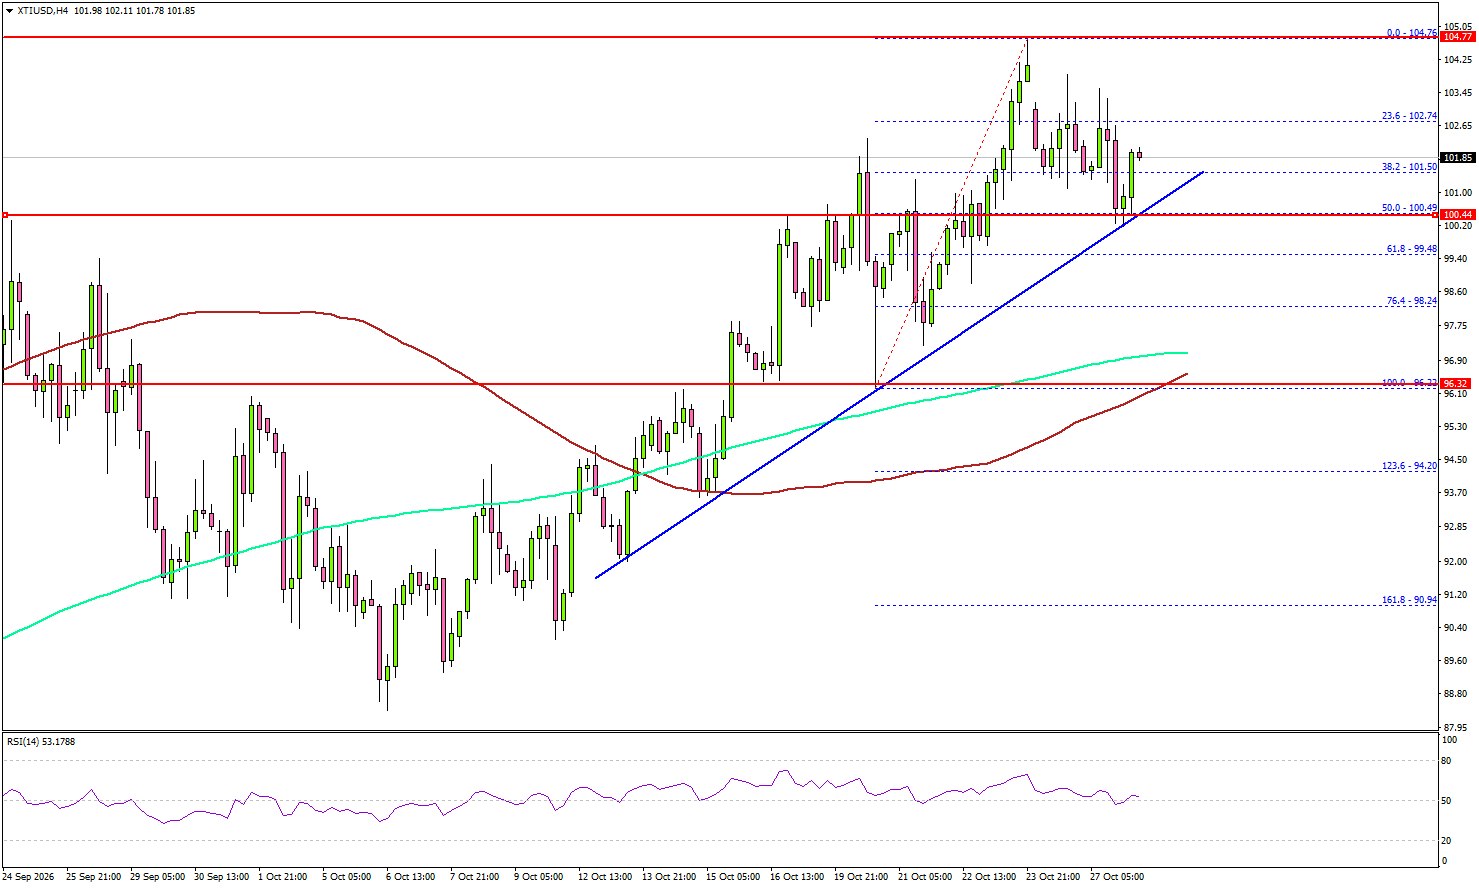
Looking at the 4-hour chart of XTI/USD, the price broke many barriers such as the 100 simple moving average (red, 4-hour), the 200 simple moving average (green, 4-hour), and $100.00. It even traded close to $105.00.
A high was formed at $104.76 before there was a pullback. The price tested the 50% Fib retracement level of the upward move from the $96.33 swing low to the $104.76 high.
If there is a fresh pullback, the price might even test $101.00. There is also a bullish trend line forming with support at $101.00. The next support sits at $99.50. The main support could be near the confluence area of the 100 simple moving average (red, 4-hour) and the 200 simple moving average (green, 4-hour) at $96.50. A close below $96.50 could initiate a move to $92.00 in the coming days.
On the upside, the price could face resistance at $104.50. The first major resistance sits at $105.00. A close above $105.00 could send Oil prices toward $106.40. Any more gains could open the door for a move to $110.00.
Looking at EUR/USD, the bears remained in action, and they could aim for a fresh move below the 1.1120 support.
Economic Releases to Watch Today
- BoC Interest Rate Decision – Forecast 2.5%, versus 2.25% previous.
- Fed Interest Rate Decision – Forecast 4%, versus 4% previous.