


Key Highlights
- EUR/USD extended losses and traded below 1.1050.
- It now faces resistance near 1.1070 and 1.1115 on the 4-hour chart.
- Bitcoin prices nosedived and tested the $62,000 region.
- Gold could extend losses if it dips below $3,850.
EUR/USD Technical Analysis
The Euro failed to remain stable above 1.1110 against the US Dollar. EUR/USD extended losses after it settled below 1.1080.
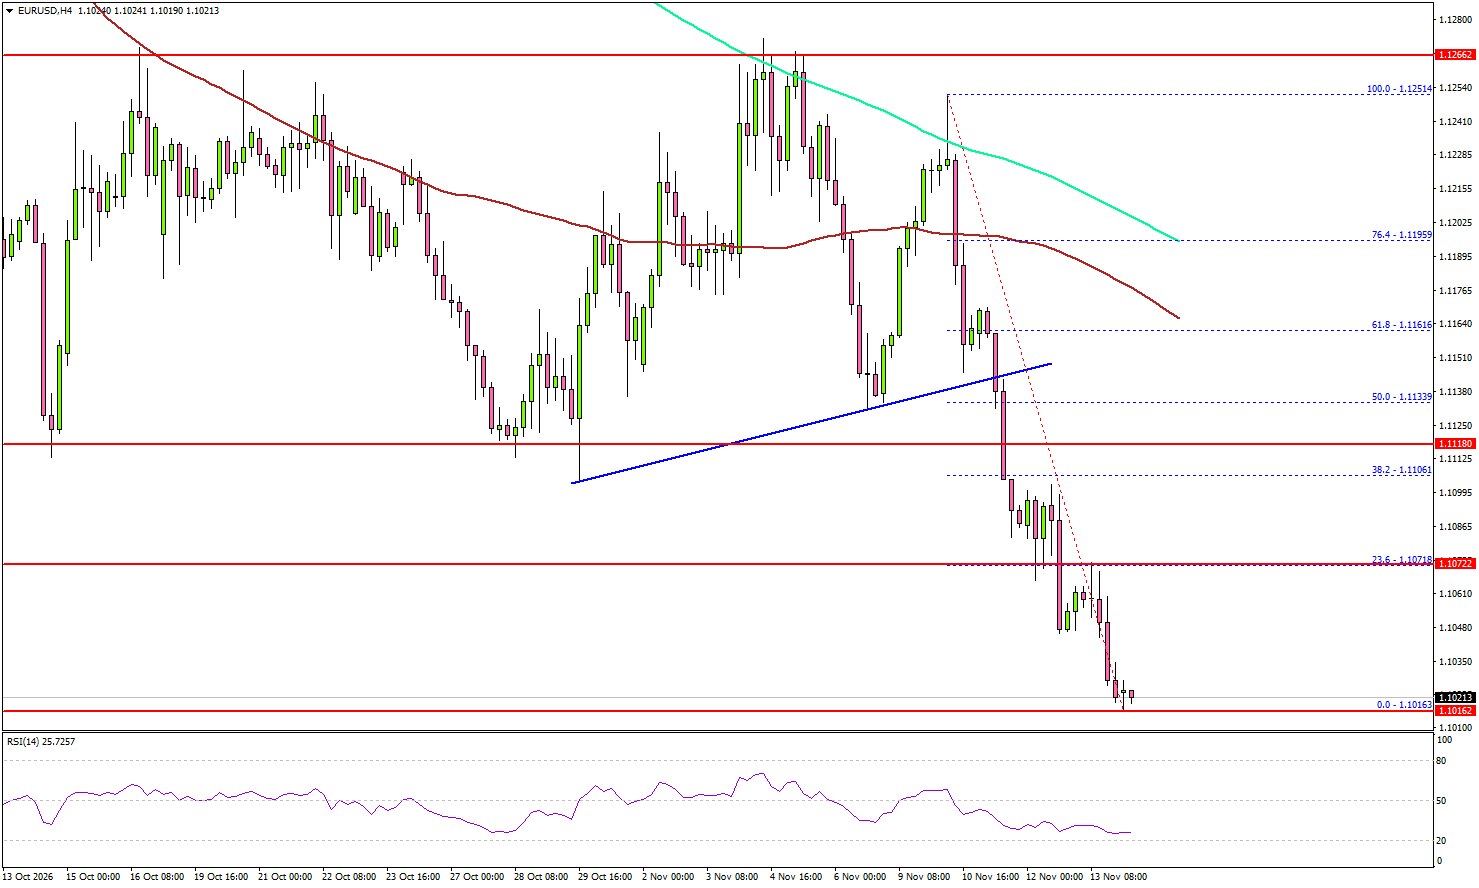
Looking at the 4-hour chart, the pair gained bearish momentum and even tested the 1.1015 level. It traded as low as 1.1016 and is currently well below the 100 simple moving average (red, 4-hour) and the 200 simple moving average (green, 4-hour).
If there is a recovery wave, the pair could face resistance near the 23.6% Fib retracement level of the downward move from the 1.1251 swing high to the 1.1016 low at 1.1070.
The first major resistance might be 1.1115 or the 50% Fib retracement level at 1.1133. The main resistance could be near the 100 simple moving average (red, 4-hour) at 1.1160. A close above 1.1160 could push the pair further higher.
In the stated case, the pair might revisit the 200 simple moving average (green, 4-hour). Any more gains could open the door for a move to 1.1250.
If there is a fresh decline, the pair might find support near 1.1015. The first major support might be 1.1000. A close below 1.1000 might put some pressure on the bulls. In the stated case, the pair might drop to 1.0945
Looking at Gold, the bears seem to be in action, and they could aim for a move below the $3,850 support zone in the coming sessions.
Upcoming Key Economic Events:
- ECB’s Vujčić speech.
- Eurozone Industrial Production for Sep 2026 (MoM) – Forecast +0.6%, versus -0.5% previous.