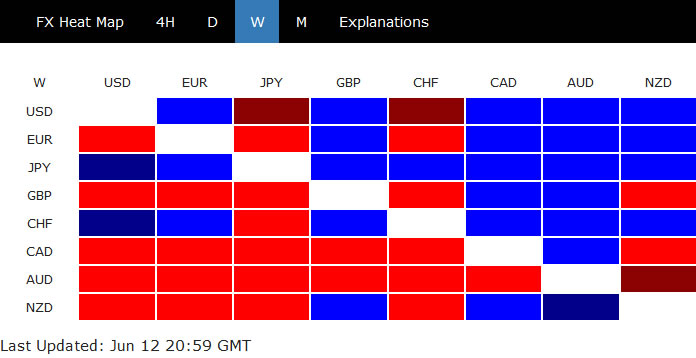
The second wave of coronavirus pandemic had finally become a main theme in the markets last week. Or, investors could have just waited for Fed to confirm its done with more easing for moment, and started profit taking. Either way, massive selloff was seen in the stock markets towards the end of the week. In the currency markets, Yen and Swiss Franc ended as overwhelmingly the strongest, followed by Dollar and Euro. Australian Dollar was the worst performing, and led commodity currencies and Sterling lower.
We’re preferring the case of reversing the unjustifiably strong rebound in stocks since late March. But a near term support zone in DOW needs to be taken out to confirm. AUD/JPY will be watched as confirmation of overall risk sentiments again and a corresponding support zone needs to be broken decisively too. As for Dollar’s come back, the DXY also needs to overcome a near term resistance level. The levels are discussed below.
As for the coronavirus pandemic, as it’s said, the second wave is still “small” and “distant” for some parts of the US. But situations in some countries look out of control. Those countries that worth attention included Mexico, Brazil, India, Pakistan and Saudi Arabia.
DOW might be starting the third leg of medium term consolidation
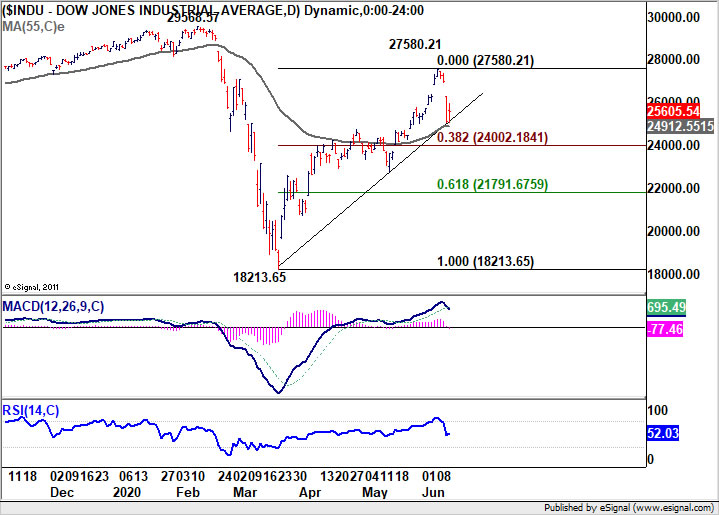
DOW gap down on Thursday and subsequent sharp fall confirmed short term topping at 27588.21, at least. Our preferred view is that whole rise from 18213.65, as the second leg of the consolidation pattern from 29568.57, has completed. That is, the third leg has started. But this is yet to be confirmed.
Focus will now be on support zone between 38.2% retracement of 18213.65 to 27580.21 at 24002.18, and 55 day EMA (now at 25605.54. Decisive break there will confirm our view and bring deeper fall to 61.8% retracement at 21791.67 and below. But strong rebound from the support zone will retain near term bullishness for rally through 27580.21 later. This should be decided within a week or two.
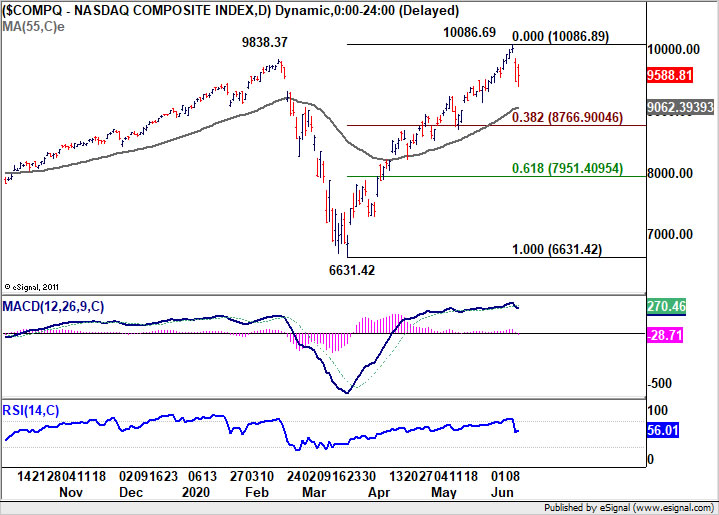
NASDAQ made new record high at 10086.89 last week then followed other indices to pull back sharply. Outlook remains relatively more bullish than DOW, as the depth of the fall is more consistent as a correction rather than reversal at this point. If 55 day EMA (now at 9062.39) would be defended well, followed by another record high. NASDAQ cold help pull other major indices higher and keep risk appetite in place in the markets. Or, tech investors could jump into the bandwagon of profit taking should sentiments worsen elsewhere. We’ll see.
Dollar index eyes 98.27 resistance zone after short term bottoming
Dollar index dropped to 95.71 last week but formed a short term bottom there and rebounded. That came after breaching 100% projection of 102.99 to 98.27 from 100.55 at 95.72. Support was also seen ahead of long term trend line and well above 94.65. Some more recovery could likely be seen for the near term, but main focus will be on 38.2% retracement of 102.99 to 95.71 at 98.49. The level is also close to 98.27 support turned resistance, as well as 55 day EMA (now at 98.66).
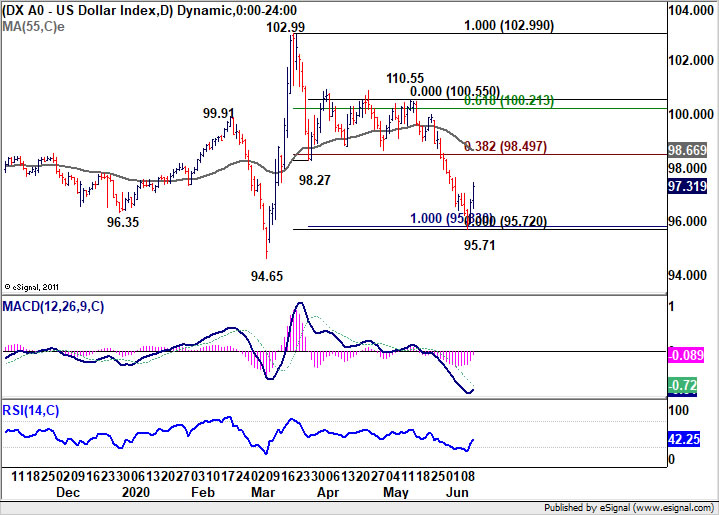
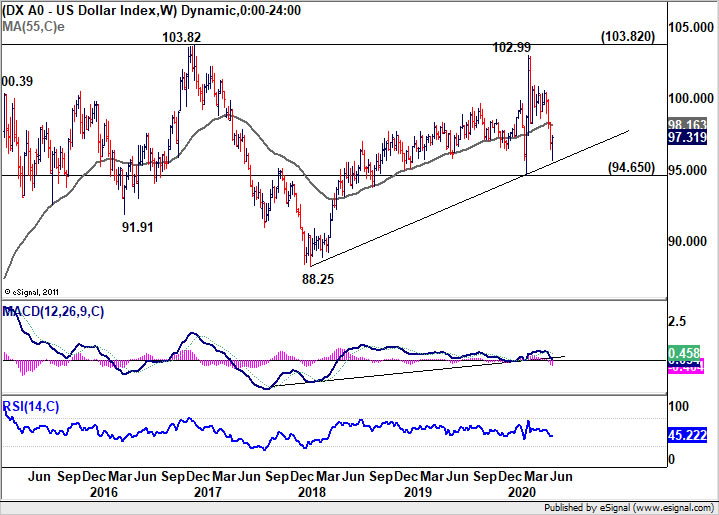
Rejection by this 98.27/66 resistance zone will maintain near term bearishness for another low below 95.71. That would also be in line with the case that fall from 102.99 is reversing the whole up trend from 88.25. However, sustained break of 98.27/66 will argue that fall from 102.99 has completed with three waves down to 95.71. The corrective structure would in turn argue that rise fro m88.25 is not completed. We’d likely find out what way it is within June.
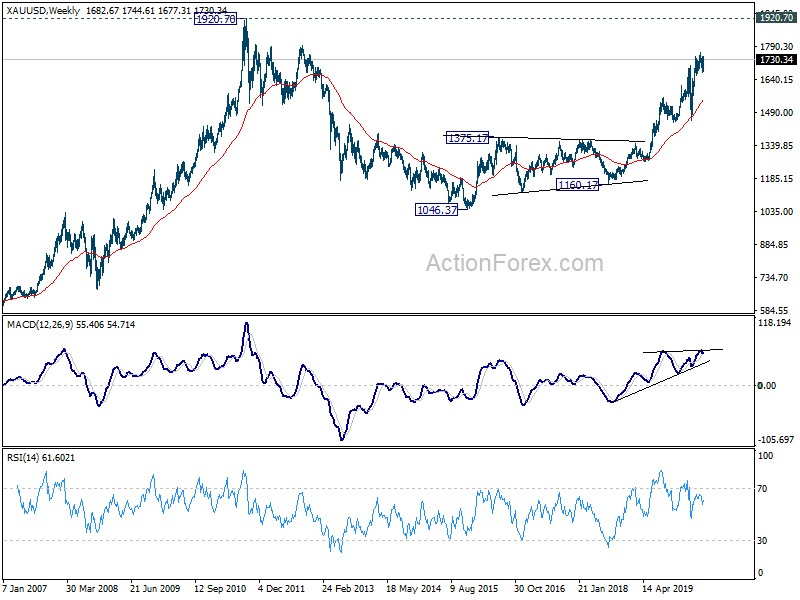
Gold ready to resume up trend as correction finished
Gold’s rebound last week argues that corrective fall from 1765.25 has completed with three waves down to 1670.66, after breaching 55 day EMA. Near term focus will now be on 1765.25 high. Decisive break there will resume medium term up trend for 61.8% projection of 1451.16 to 1765.25 from 1670.66 at 1864.76.
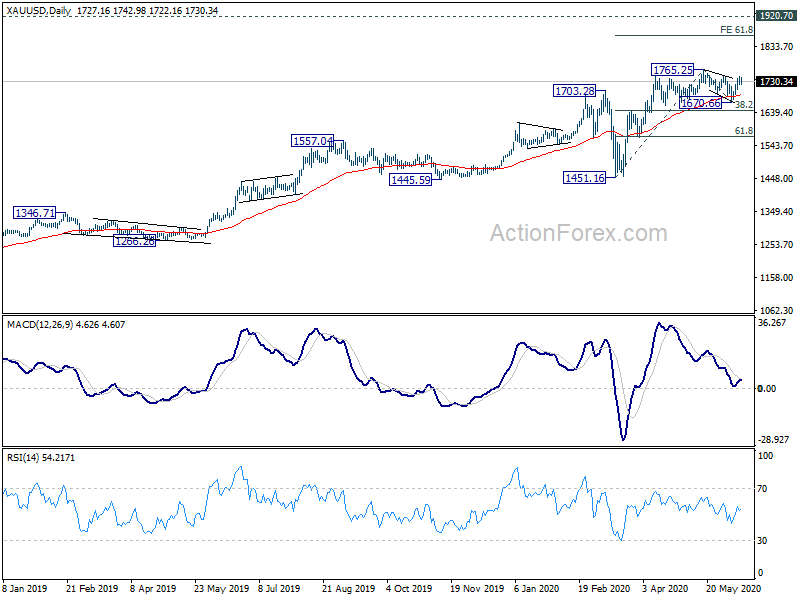
However, medium term momentum as suggested by weekly MACD is not too convincing yet. Hence, even if the up trend does resume, strong resistance would be seen below 1920.70 high to limit upside and bring a major correction. But for the near term, question is whether risk aversion would drive both Dollar and Gold higher. Or Gold’ rally would limit Dollar’s rebound.
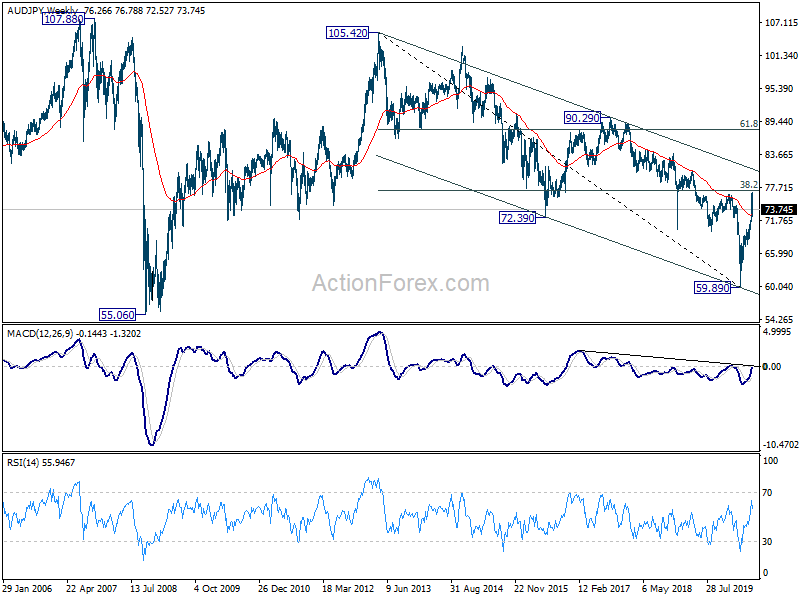
AUD/JPY topped ahead after hitting 76.54/77.28 resistance zone
AUD/JPY was the biggest mover last week, ended down -3.5%. The cross failed to break through 76.54 cluster resistance zone (38.2% retracement of 105.42 to 59.89 at 77.28. Considering that, we believed a short term top was formed and deeper decline would be seen. Support zone between 38.2% retracement of 59.89 to 76.78 at 70.32 and 55 day EMA (now at 71.19) will be critical in deciding the next move.
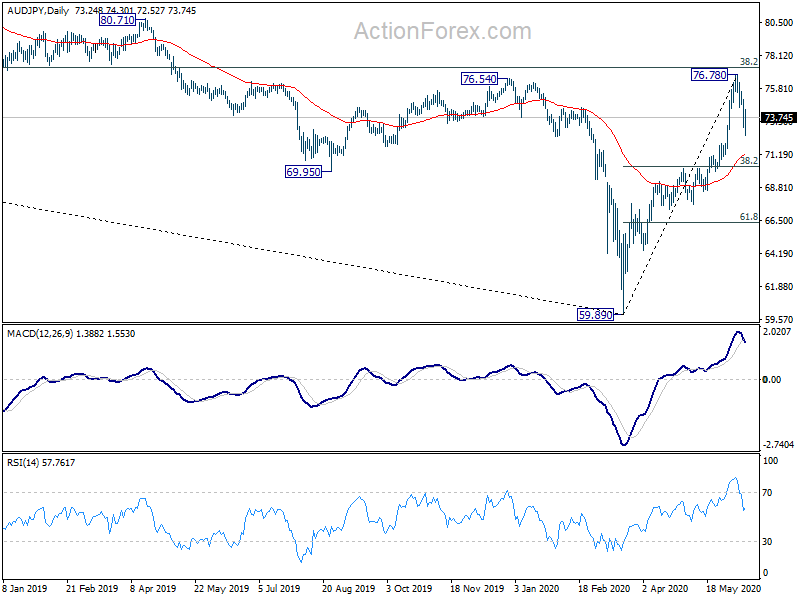
Strong rebound from 70.32/71.19 will retain near term bullishness for another rise through above mentioned 76.54/77.28 resistance zone. However, sustained break of 70.32/71.19 will argue that whole rebound form 59.89 has completed and suggest near term bearish reversal. Meanwhile, break of 75.61 minor resistance will invalidate our view and bring retest of 76.78.
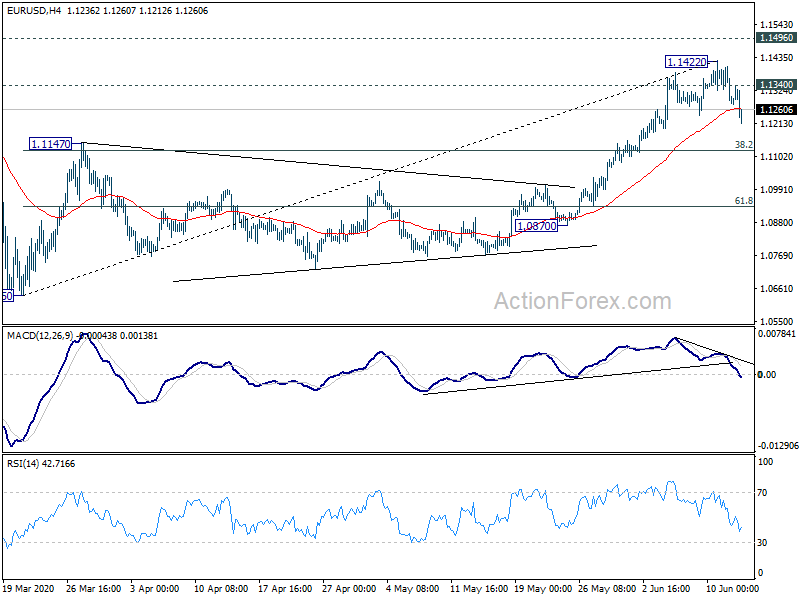
EUR/USD Weekly Outlook
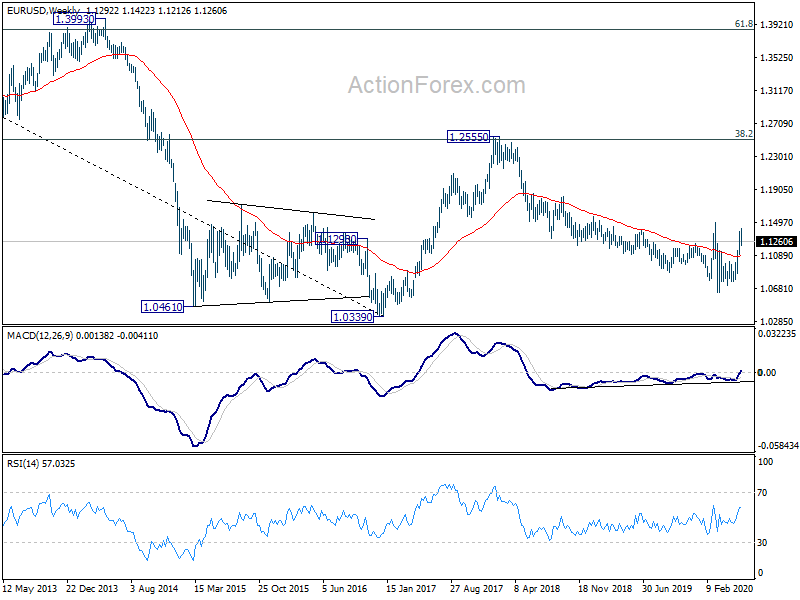
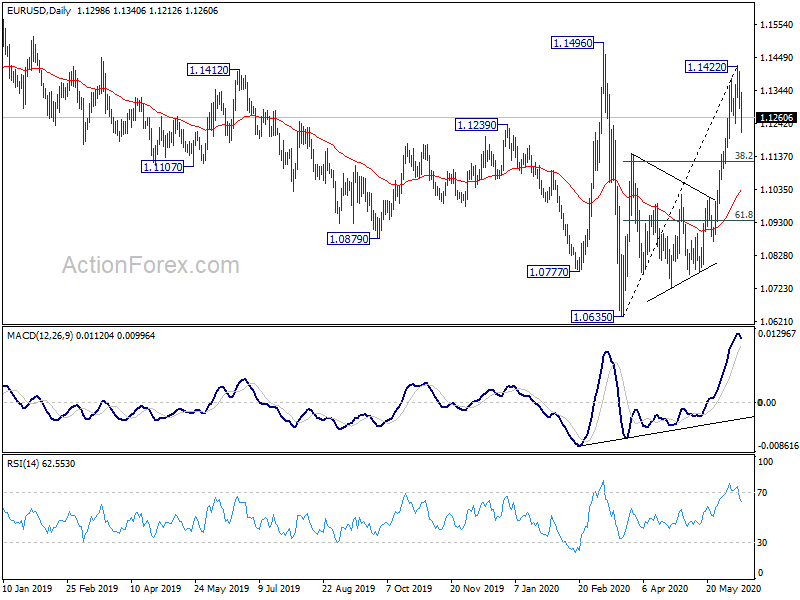
EUR/USD edged higher to 1.1422 last week but reversed from there. A short term top should be formed ahead of 1.1496 key resistance. Initial bias is now on the downside this week for 38.2% retracement of 1.0635 to 1.1422 at 1.1121. Sustained break there will argue that whole rebound from 1.0635 has completed and bring deeper fall to 61.8% retracement at 1.0936. On the upside, though, break of 1.1230 minor resistance will turn bias back to the upside for 1.1422 instead.
In the bigger picture, as long as 1.1496 resistance holds, whole down trend from 1.2555 (2018 high) should still be in progress. Next target is 1.0339 (2017 low). However, sustained break of 1.1496 will argue that such down trend has completed. Rise from 1.0635 could then be seen as the third leg of the pattern from 1.0339. In this case, outlook will be turned bullish for retesting 1.2555.
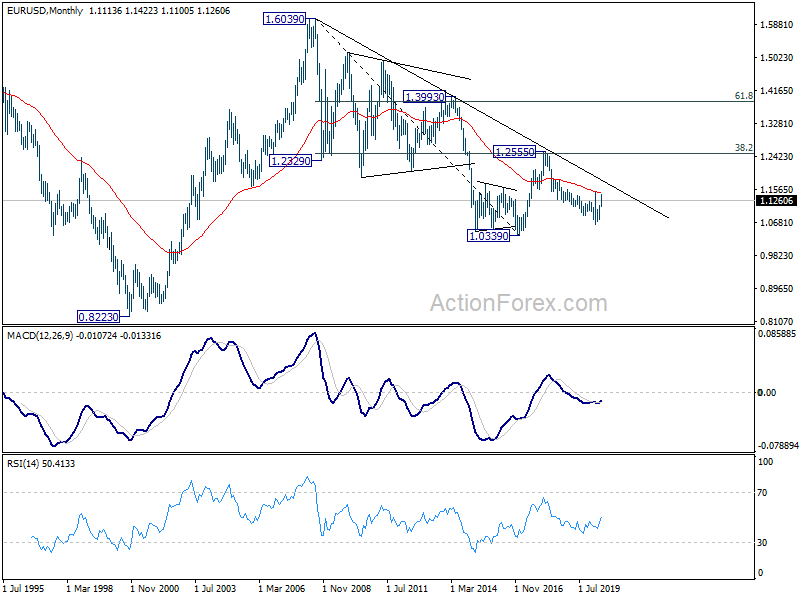
In the long term picture, outlook remains bearish for now as it’s staying below 55 month EMA, as well as decade long falling trend line. Down trend from 1.6039 (2008 high) is still in favor to extend through 1.0339 down the road. However, sustained trading above 55 month EMA will firstly suggest that fall from 1.2555 has completed. It would also be an early indication on long term bullish reversal. Focus would be back on 1.255 cluster resistance (38.2% retracement of 1.6039 to 1.0339 at 1.2516 ).