
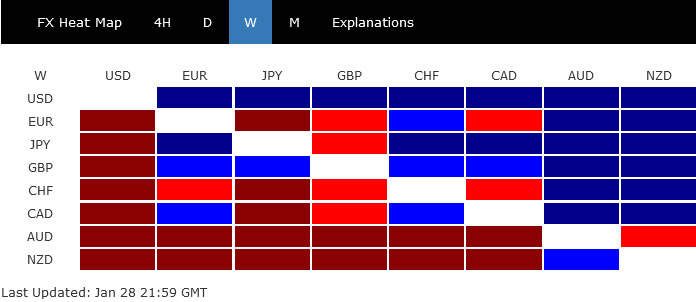
The FOMC meeting turned out to me more hawkish than expected and markets are now pricing in four to five hikes this year, instead of three. Dollar was given a strong boost and surged broadly to end as the strongest one. Nevertheless, reactions in the stock markets, while wild, were not pessimistic. Sterling followed as the second strongest, as inflation outlook is going to push BoE for a hike again this week.
Australian Dollar was the worst performing one as RBA is clearly lagging behind Fed on tightening, followed by New Zealand Dollar. Both were also weighed down by risk aversion in Asia, in particular in China and Hong Kong markets. Euro and Swiss Franc were mixed together with Canadian, but the latter was support by persistent strength in oil price.
Fed to deliver four or five hikes this year, starting March
The FOMC meeting last week came out more hawkish than expected. A March rate hike is pretty much confirmed as Fed said ” it will soon be appropriate to raise the target range for the federal funds rate.” Also, Chair Jerome Powell didn’t rule out 50bps rate hikes, and indicated that every meeting is “live”.
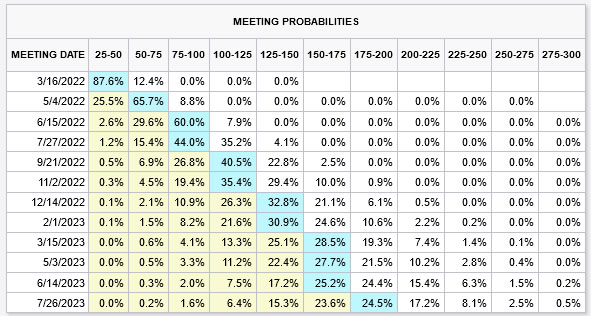
Based on latest fed fund futures pricing, a 25bps hike is fully priced in for March meeting. There is 74% chance of another rate hike in May. The third 25bps hike would come in June or July (more likely). The fourth 25bps hike would come in September or November (more likely). There could be a fifth hike in December or next January (more likely).
The more aggressive scenario could see five rate hikes in March, May, June, September, December. The less aggressive scenario could se four rate hikes in March, May, July, November. But then, every meeting is “live” and depends on preceding developments.
S&P 500 closed the week with gain, but correction not ended yet
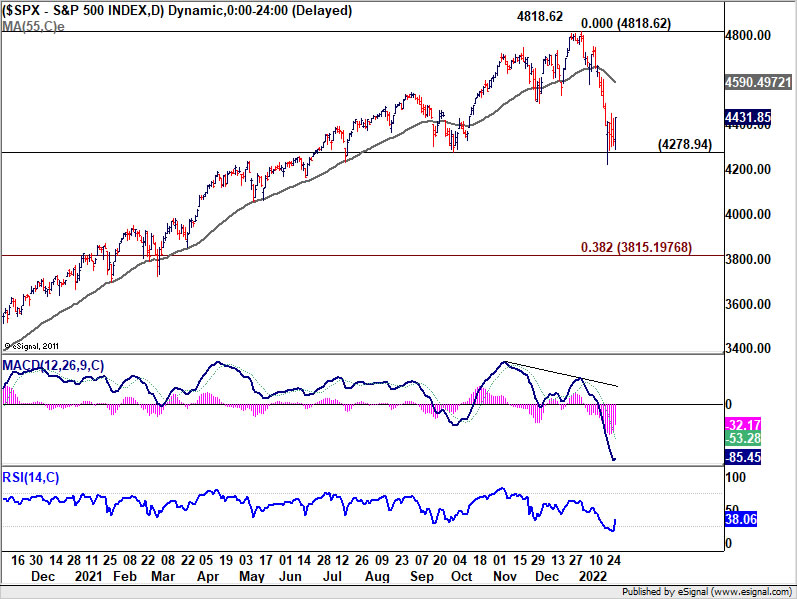
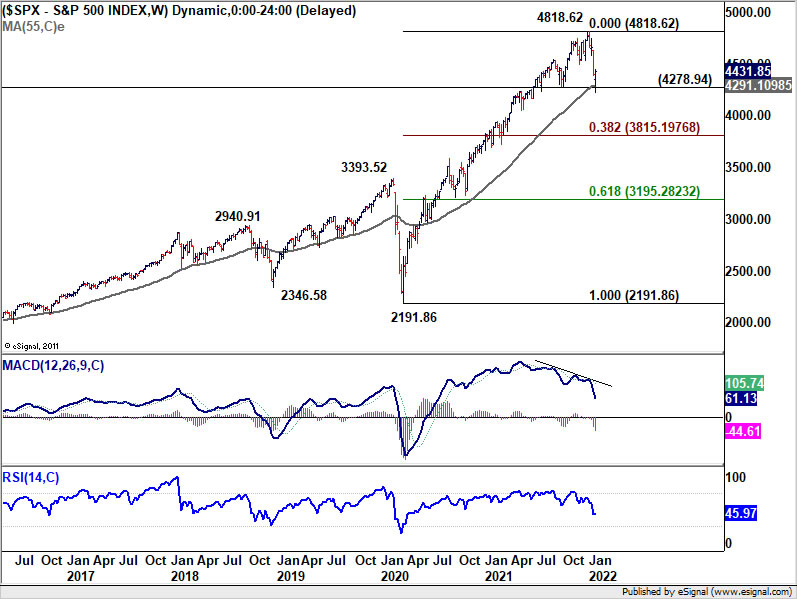
The stock markets were indeed very resilient despite the massive volatility seen. S&P 500 dived to 4222.62 but rebounded to close at 4431.85, up 33.9 pts. Initial support was seen from 4278.94 structural level and 55 week EMA (now at 4291.10). But overall, 4818.62 is seen as a medium term top, on bearish divergence condition in daily and week MACD. Hence, the corrective pattern from there is not expected to end that soon.
Price actions from 4818.62 are seen as correcting the whole up trend from 2191.86 (2020 low). Hence, while more recovery could be seen in the near term, upside should be limited by 55 day EMA (now at 4590.49). There would be another decline through 4222.62 to 38.2% retracement of 2191.86 to 4818.62 at 3815.19 before the correction completes. Nevertheless, sustained break of 55 EMA will argue that it’s unfolding as as sideway consolidation pattern, rather than a deep correction.
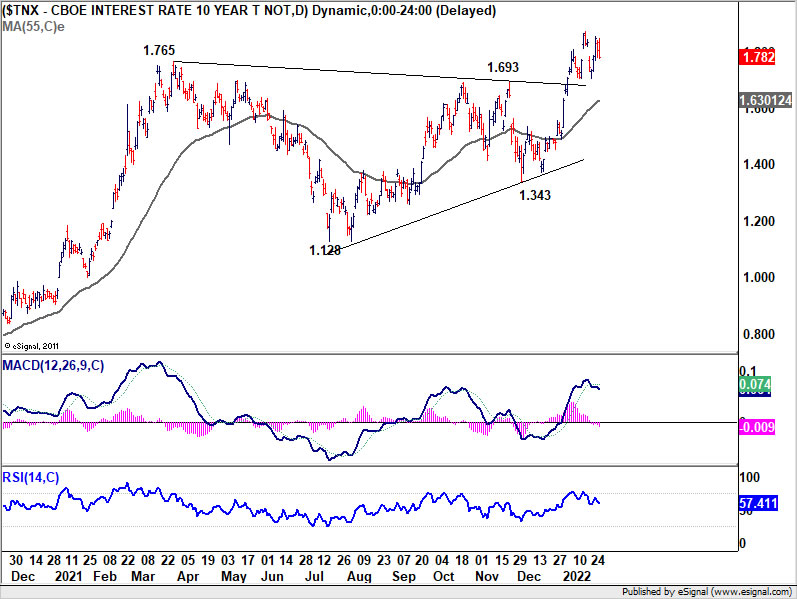
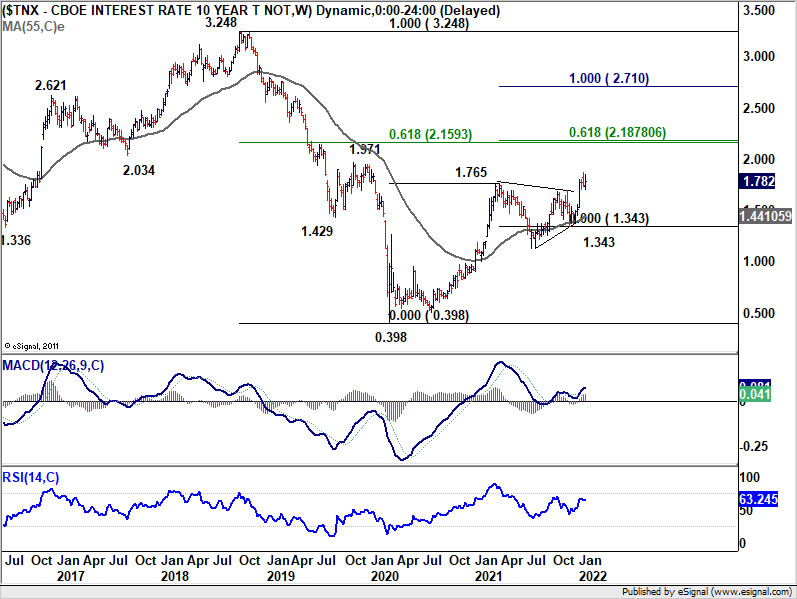
10-year yield failing to extend up trend, consolidation continues
10-year yield failed to break through prior week’s high at 1.874 and extended near term sideway consolidations. Any pull back should be contained by 55 day EMA (now at 1.630). Current up trend should extend to 2.159/87 cluster level. This represents 61.8% retracement of 3.248 to 0.398 at 2.159, and 61.8% projection of 0.398 to 1.765 from 1.343 at 2.187. This is where the real test lies, and no break is expected until some dramatic underlying developments.
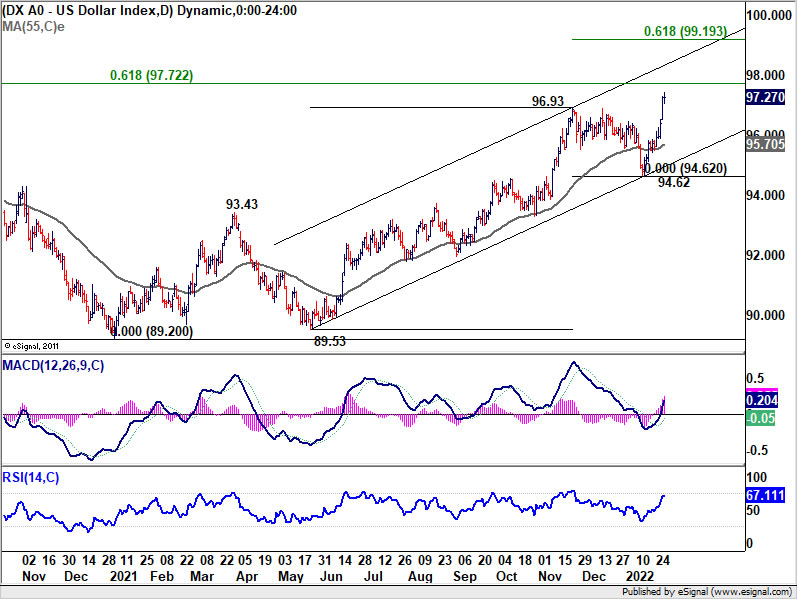
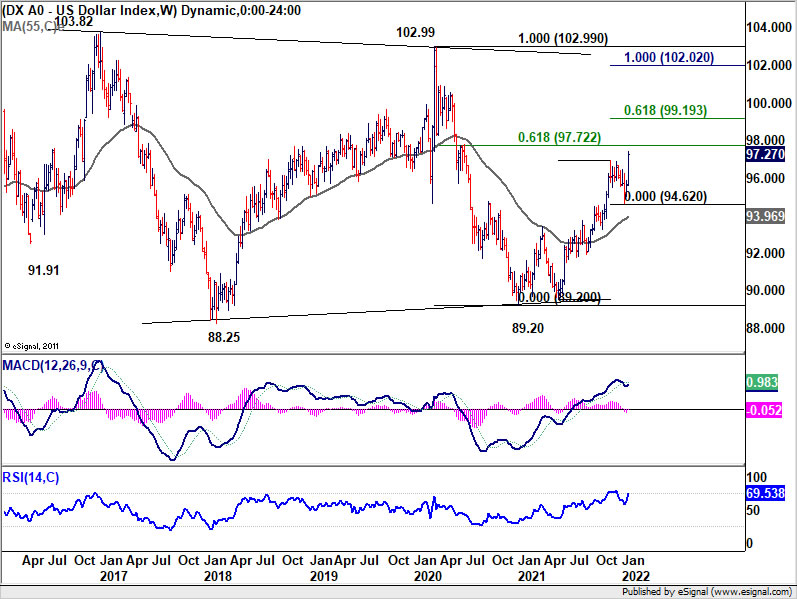
Dollar index extending up trend, 99/100 as next target
Dollar index resumed near term up trend by powering through 96.93 resistance and hit as high as 97.44. Based on current development the long term fibonacci level of 61.8% of 102.99 to 89.20 at 97.22 should be taken out with relative ease. The bigger test lies in 61.8% projection of 89.53 to 96.93 from 94.62 at 99.19, which is close to 100 psychological level. Sustained break there would open up the case for further rise back to 102.99/103.82 range top. In any case, outlook will stay bullish as long as 94.62 support holds, even in case of deep pull back.
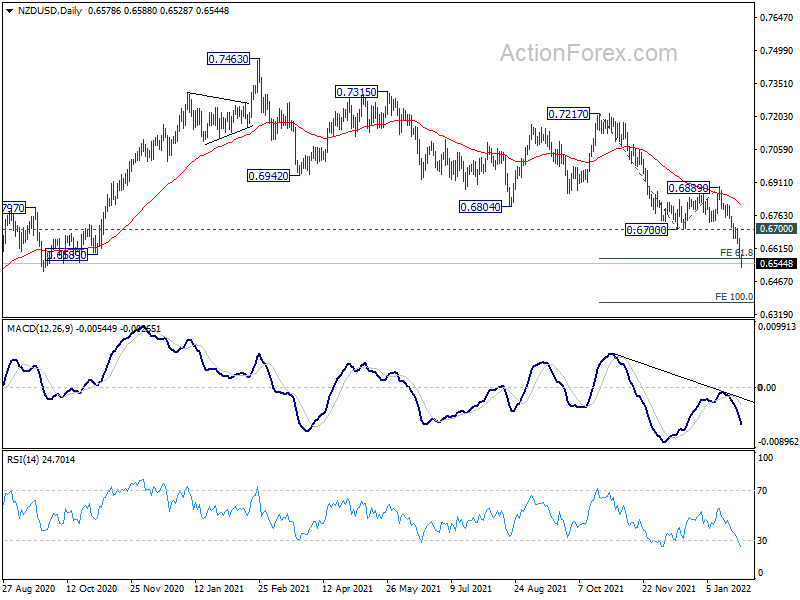
NZD/USD resumed down trend to target 0.6372 projection level next
NZD/USD was the biggest mover last week, losing -2.61%. The strong break of 0.6700 support confirms resumption of larger down trend from 0.7463. Outlook will now stay bearish as long as 0.6700 holds. As 61.8% projection of 0.7217 to 0.6700 from 0.6889 at 0.6569 was taken out already, next target is 100% projection at 0.6372.
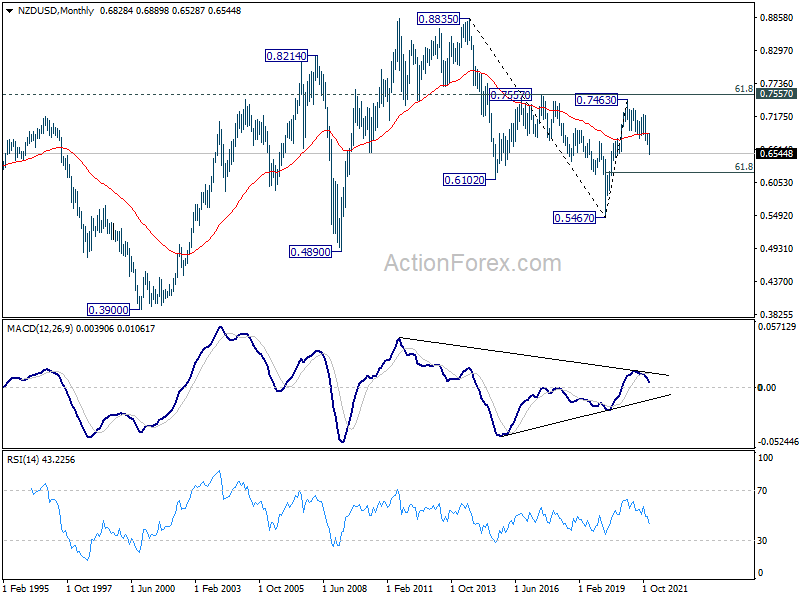
It should be noted that NZD/USD was rejected by a key long term cluster resistance level at 0.7557, with 61.8% retracement of 0.8835 to 0.5467 at 0.7548. It also had a strong break below 55 month EMA. Both developments are rather bearish from long term perspective. Fall from 0.7463 could in the end turn out to be resuming the down trend from 0.8835 high. But it’s of course too early tell. Reactions to 61.8% retracement of 0.5467 to 0.7463 at 61.8% retracement of 0.5467 to 0.7463 at 0.6229 could reveal the long term trend.
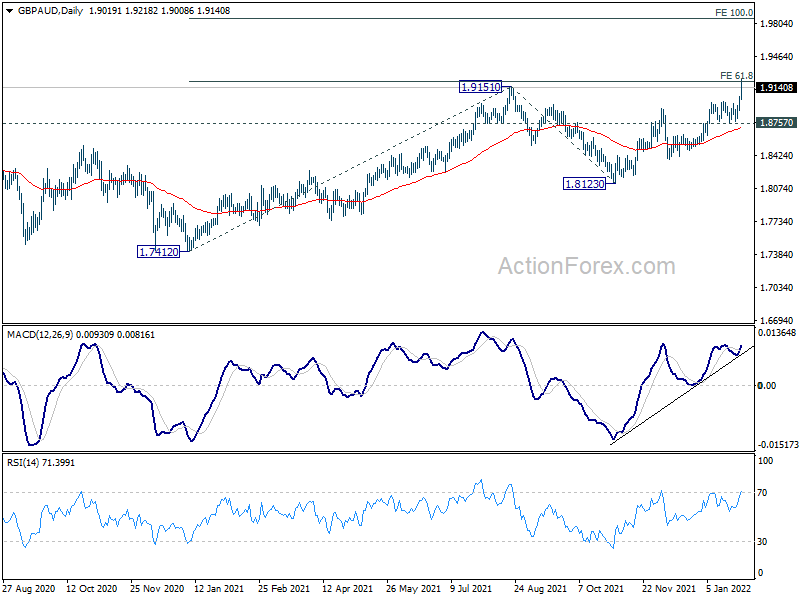
GBP/AUD facing projection resistance as it tries to resume up trend
GBP/AUD surged through 1.9151 high last week and resumed the up trend from 1.7412. But it’s no immediately facing 61.8% projection of 1.7412 to 1.9151 from 1.8123 at 1.9198. Sustained break of this level will but a strong affirmation to the underlying medium term bullish momentum. GBP/AUD could then target 100% projection at 1.9862. However, rejection by 1.9198, followed by break of 1.8757 support, will keep medium term outlook neutral and bring more range trading.
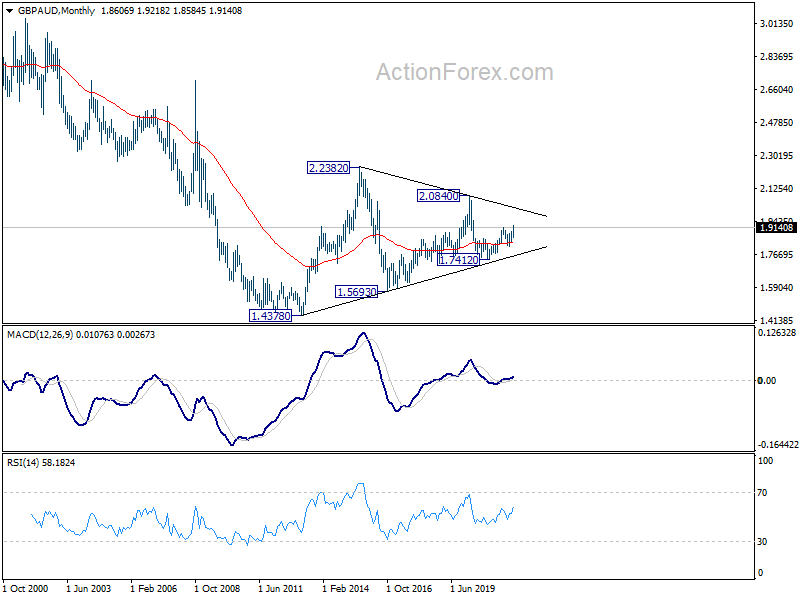
Meanwhile, the break of 55 month EMA, with monthly MACD turning positive, is promising for the long term outlook. GBP/AUD might on on track to head back to 2.084 high, as part of the long term range pattern. Yet, it will have to overcome the above mentioned 1.9198 level with some conviction first.
EUR/USD Weekly Outlook
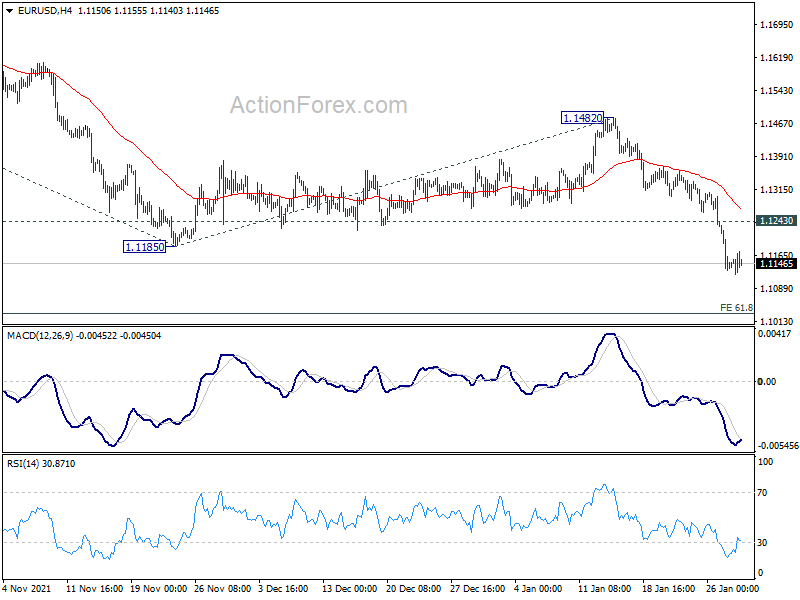
EUR/USD’s down trend from 1.2348 finally resumed last week by breaking through 1.1185 and hit as low as 1.1120. Initial bias stays on the downside this week. Next target is 61.8% projection of 1.1908 to 1.1185 from 1.1482 at 1.1035. Break will target 100% projection at 1.0759. On the upside, above 1.1243 minor resistance will turn intraday bias neutral first. But recovery should be limited well below 1.1482 resistance to bring down trend resumption.
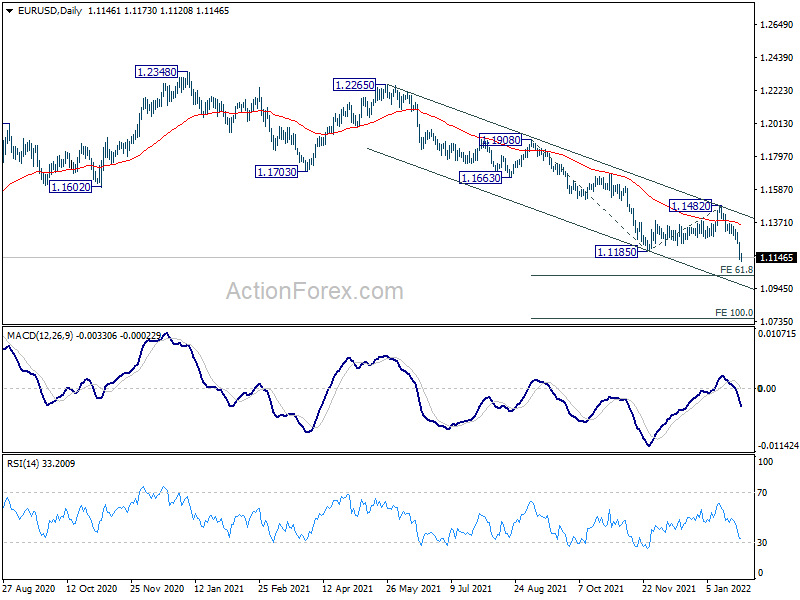
In the bigger picture, the strength of the the decline from 1.2348 (2021 high) suggests that it’s not a corrective move. But still, it could be the fourth leg of a sideway pattern from 1.0339 (2017 low), or resuming long term down trend. In any case, outlook will now stay bearish as long as 1.1482 resistance holds. Next target would be 1.0635 low.
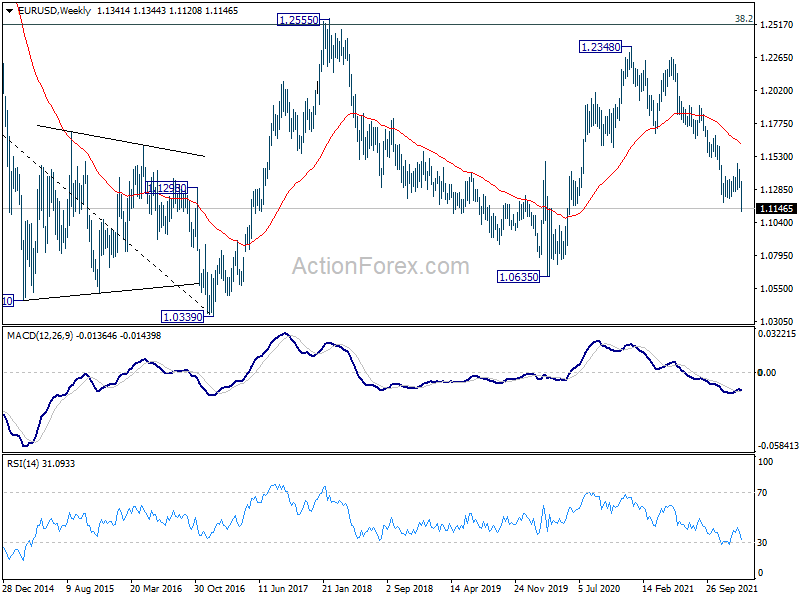
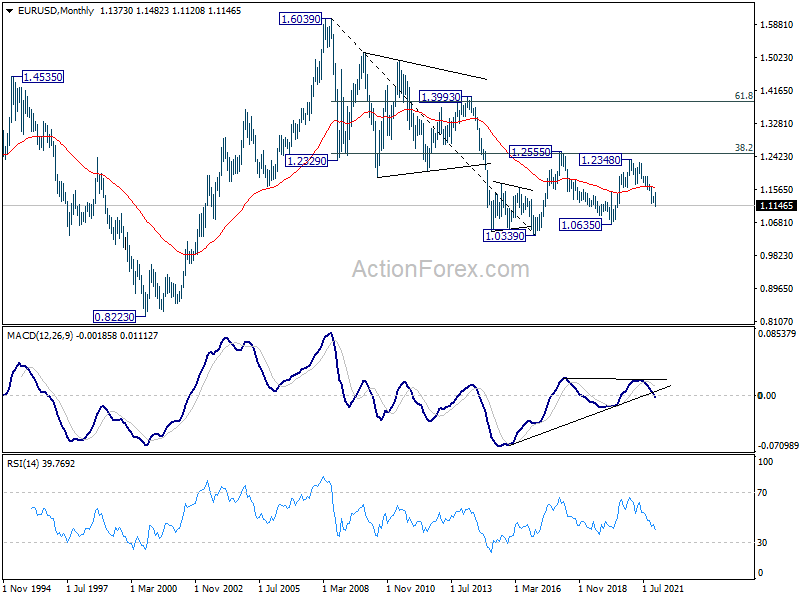
In the long term picture, EUR/USD should have failed 1.2555 cluster resistance (38.2% retracement of 1.6039 to 1.0339 at 1.2516) again. The break below a flat 55 month EMA is keeping long term outlook bearish. That is, the down trend from 1.6039 (2008 high) is still in progress. Break of 1.0339 will open up further decline towards 0.8223 (2000 low).


