
Russia invasion of Ukraine continued last week and risk aversion intensified sharply after Russia’s attempt to attack Zaporizhzhia nuclear power station. European stocks took a steep dive with benchmark yields. Oil prices surged to levels not seen in more than a decade. Gold was originally steady but staged a late rally, probably as people remembered that it’s a safer asset to hold than cryptos in time of world war III.
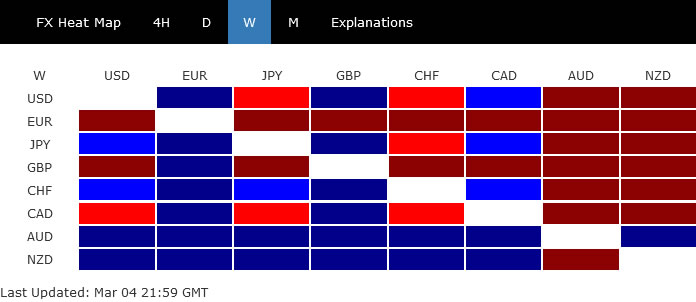
In the currency markets, Euro was overwhelming the worst performing one, with Sterling a distant second. While safe-haven flows boosted Swiss Franc, Aussie and Kiwi were the ones benefited most by skyrocketing commodity prices. Dollar ended mixed with Yen
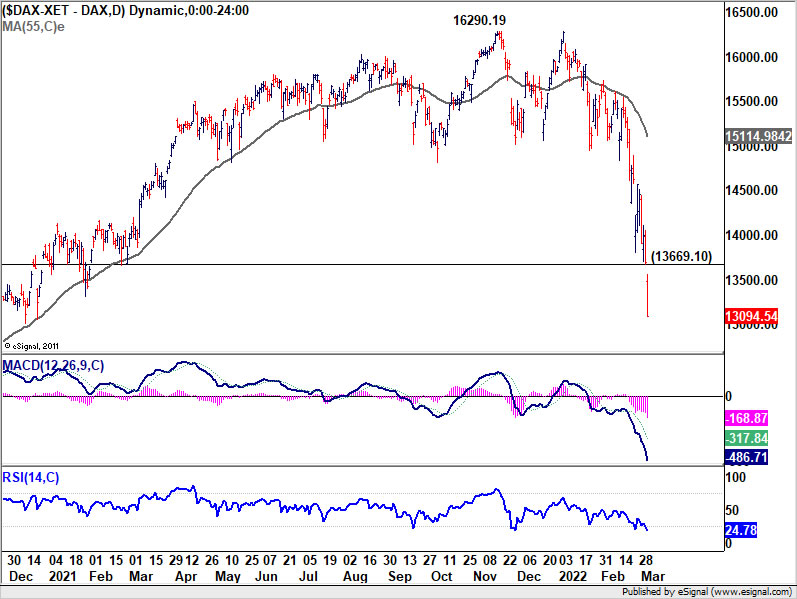
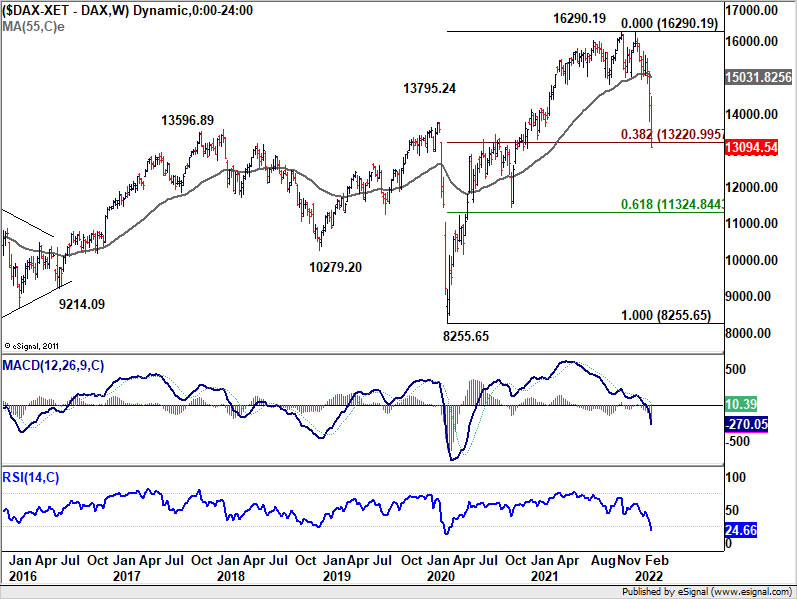
DAX in free fall with benchmark bund yield
Germany DAX was in free fall last week, and selloff was in particular fierce on Friday after a gap down. The close below the long term fibonacci level at 13220.99 (38.2% retracement of 8225.65 to 16290.19) was a rather bad sign. For the near term, outlook will stay bearish as long as the upper edge of the gap at 13669.10 holds. DAX could continue the decline to 38.2% retracement at 11324.84 before finding a bottom. Meanwhile, a break above 13669.10 will suggest some stabilization and consolidations, before staging another fall.
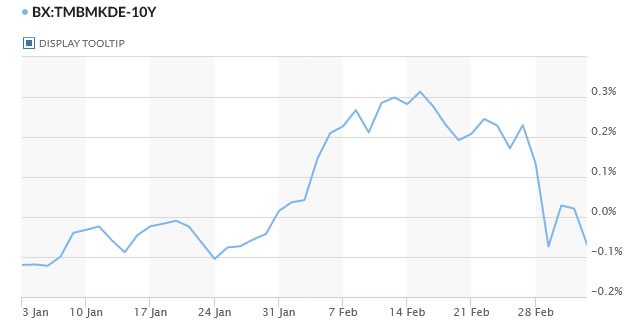
10-year bund yield closed the week down nearly -0.3 to -0.68, turned negative again for the first time since late January.
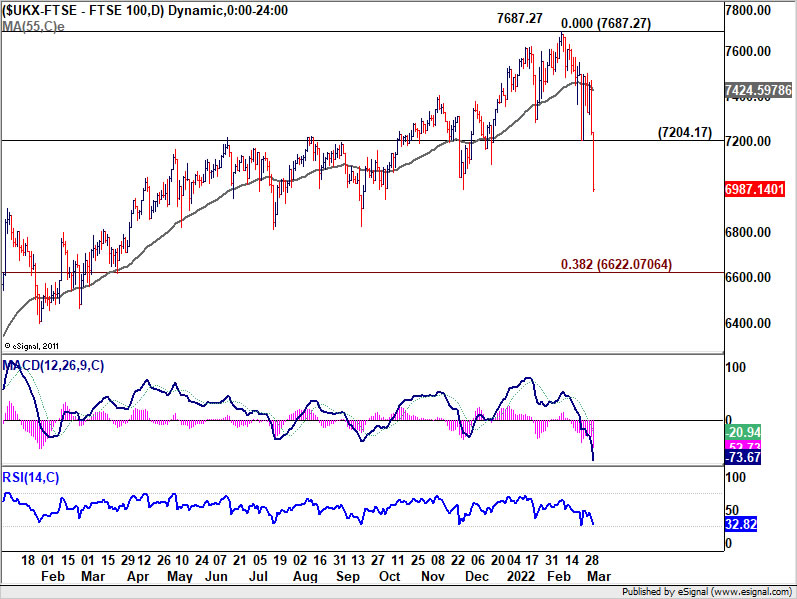
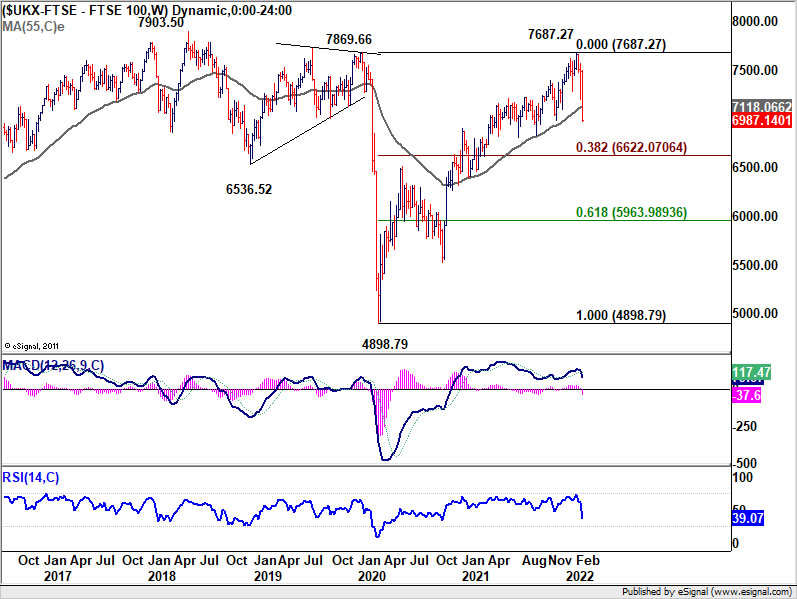
FTSE also tumbled with benchmark gilt yield
Selloff in FTSE was also steep, even though it’s less bearish than DAX’s. For now, further decline is expected in FTSE as long as 7204.17 support turned resistance holds. It should now be in correction to whole correction from the up trend from 4898.79. Deeper fall should be seen to 38.2% retracement of 4898.79 to 7687.27 at 6222.07, before finding a bottom.
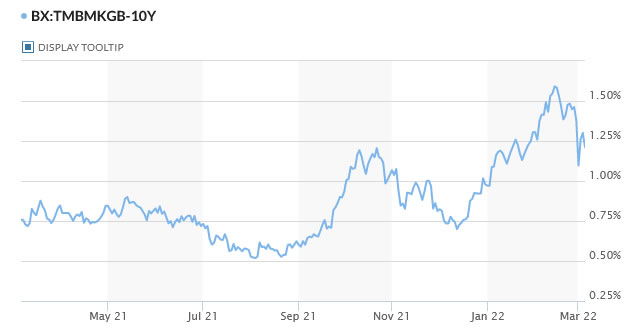
10-year gilt yield also closed down by 0.251 to 1.211, back at the level before February.
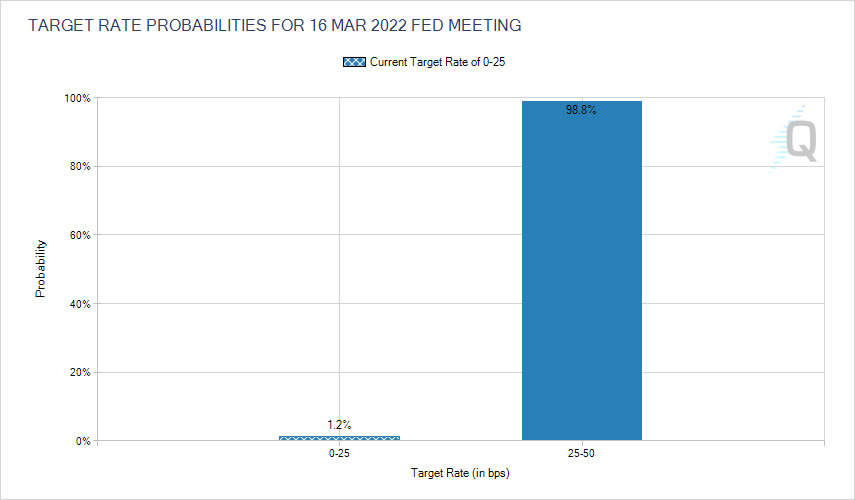
US stocks relatively resilient as Fed bets pared
The selloff in US stocks was much less severe, obviously because it’s out of the war zone while traders also pare back expectation of Fed rate hike. Indeed, Fed fund futures now implies 98.8% chance of a 25bps hike only at the March 15-16 FOMC meeting, with 1.2% chance of Fed standing pat.
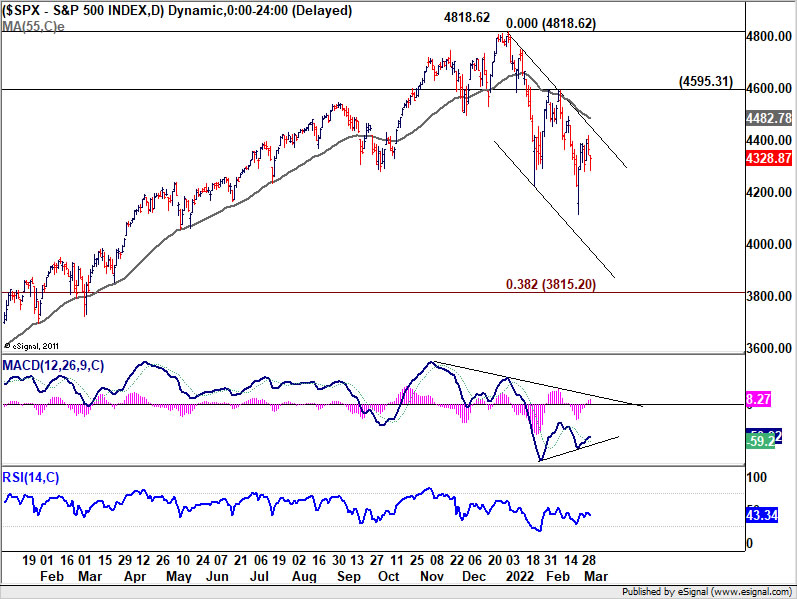
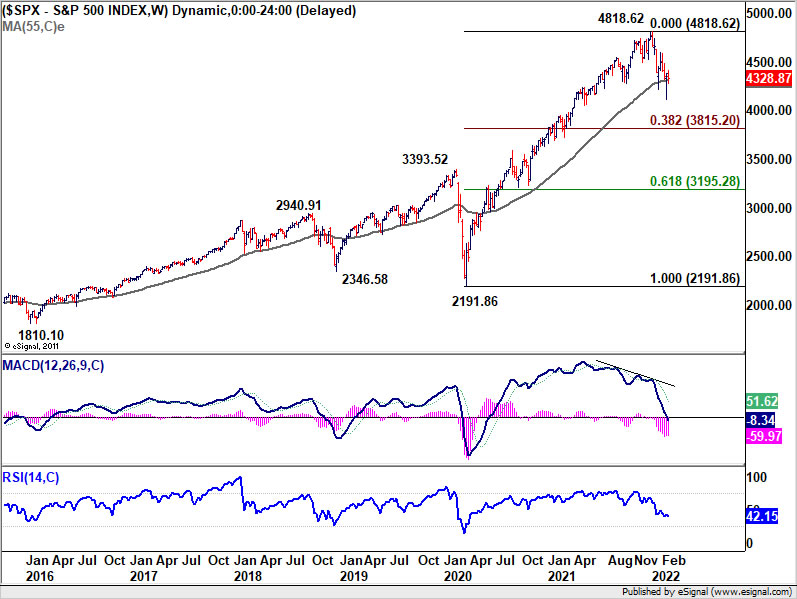
Still, while S&P 500 recovered, the decline from 4818.62 is still intact. Such fall is seen as a correction to whole up trend from 2191.86, and should target 38.2% retracement of 2191.86 to 4818.62 at 3815.20, before making a bottom. Or, it will have to break through 55 day EMA (now at 4482.79) to indicate reversal.
Dollar index broke 97.72 key fibonacci resistance
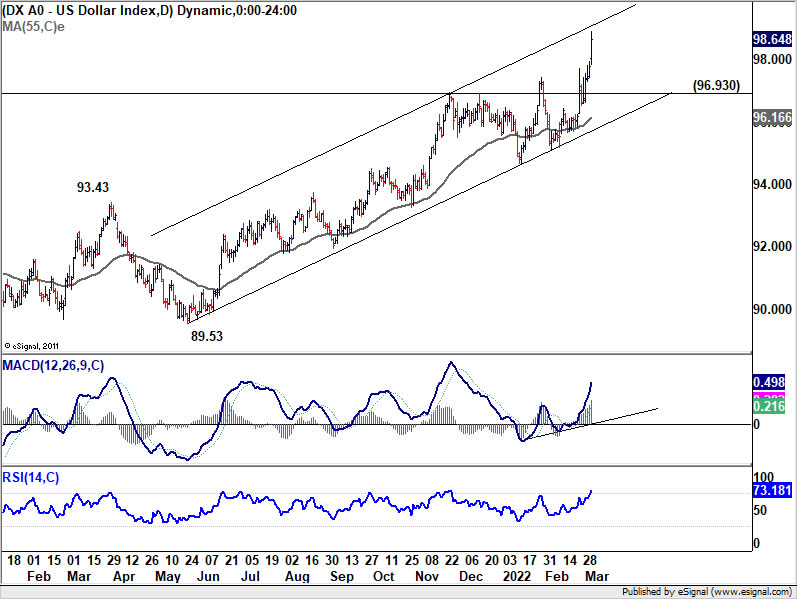
Dollar index surged to close at 96.84, thanks to Euro’s ultra-weakness. Near term outlook will now stay bullish as long as 96.93 resistance turned support. Immediate focus in channel resistance at around 99.00. Sustained break there will be a sign of upside acceleration.
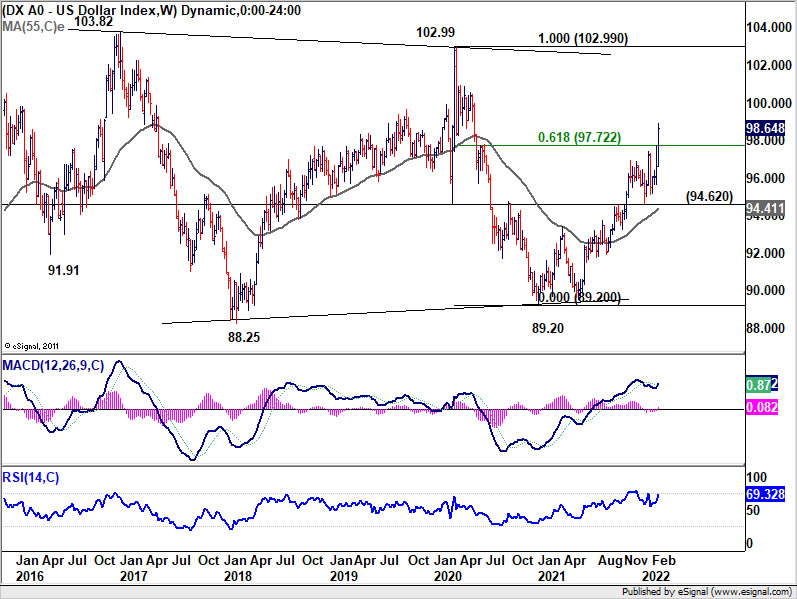
Also, with 61.8% retracement of 102.99 to 89.20 at 97.72 taken out, next target will be 102.99/103.82 long term resistance zone.
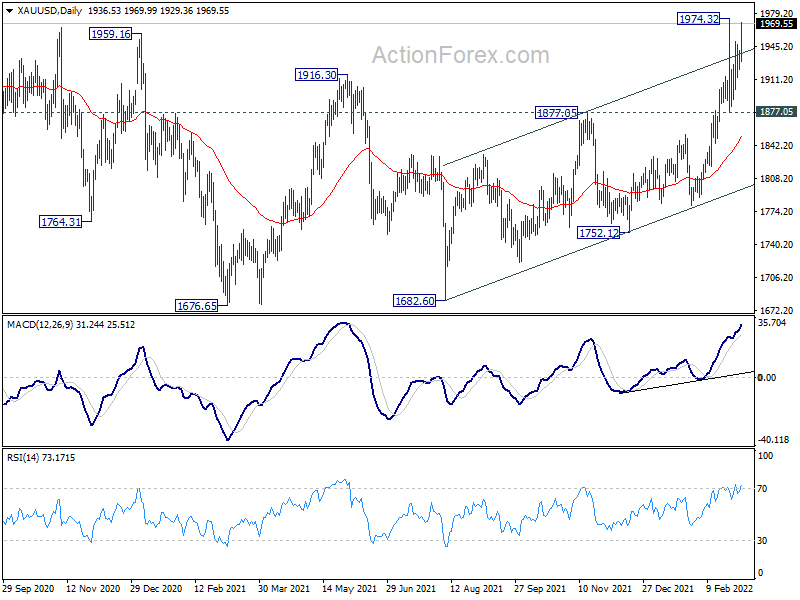
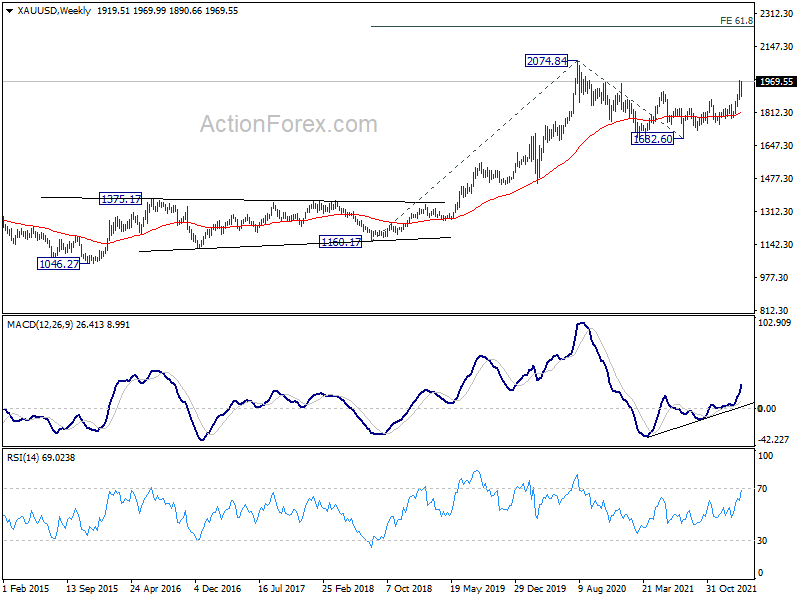
Gold ready to resume rally to retest 2074 high
Gold’s late rally argues that correction from 1974.32 has completed after drawing support from 1877.05 resistance turned support. The buying might have come as people realized that Gold is a better asset to hold than cryptos in real war.
Immediate focus is now on 1974.32. Firm break there will resume the rise from 168.60 to retest 2074.84. Depending on the upside momentum of the next move, there is prospect of resuming whole long term up trend through 2075.84 to 61.8% projection of 1160.17 to 2074.84 from 1682.60 at 2247.86.
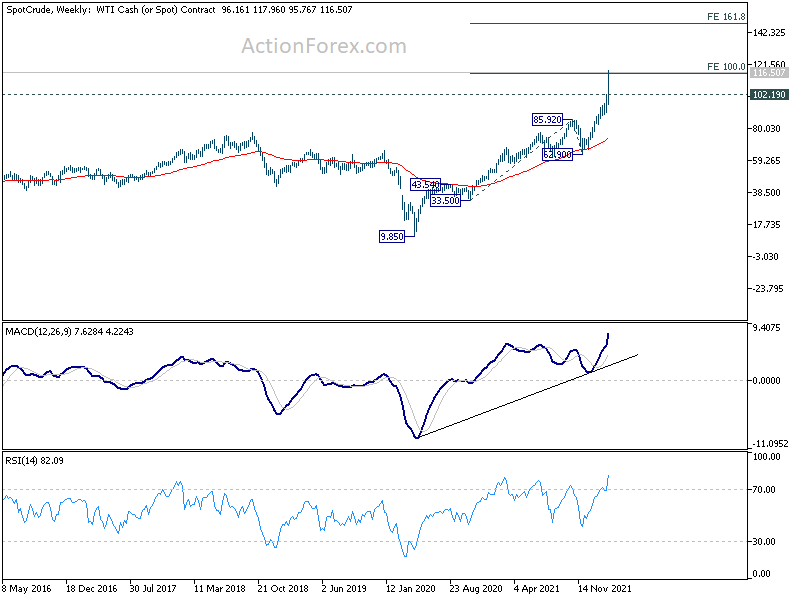
WTI pressing key 115 resistance zone, more rally to come?
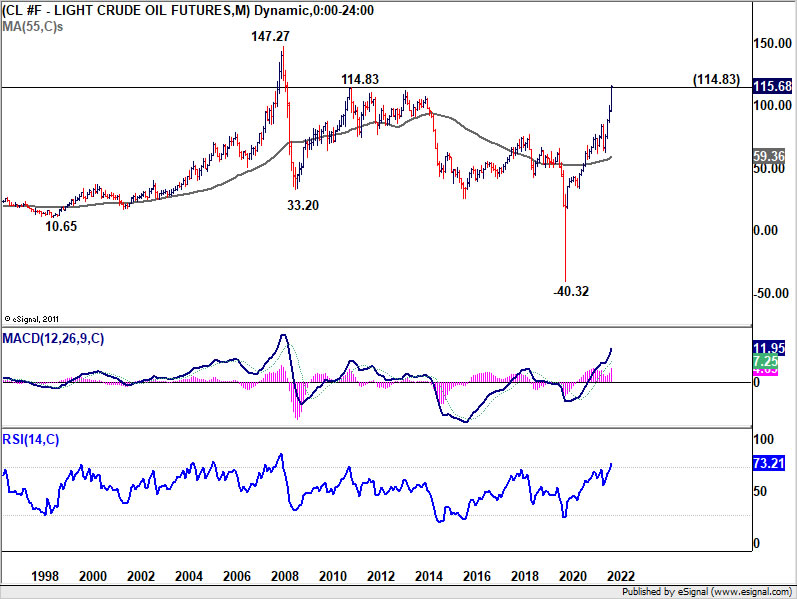
WTI crude oil had a powerful rally to close at 116.50. Theoretically, it’s now in a zone to top, at around 100% projection of 33.50 to 85.92 from 62.90 at 115.32, and more importantly, long term resistance at 114.83 (2011 high).
However, there is so far no sign of topping yet, and further rise is expected as long as 102.19 support holds. Sustained trading above 115.32 could prompt even more upside acceleration, as so in a fear-driven move in commodity markets. That’s just like the dive to negative at the start of the pandemic.
In that case, next target will be 161.8% projection at 147.71. For those who’ve be around long enough, it’s not something unthinkable. It’s just the high reached back in 2008, not that long ago.
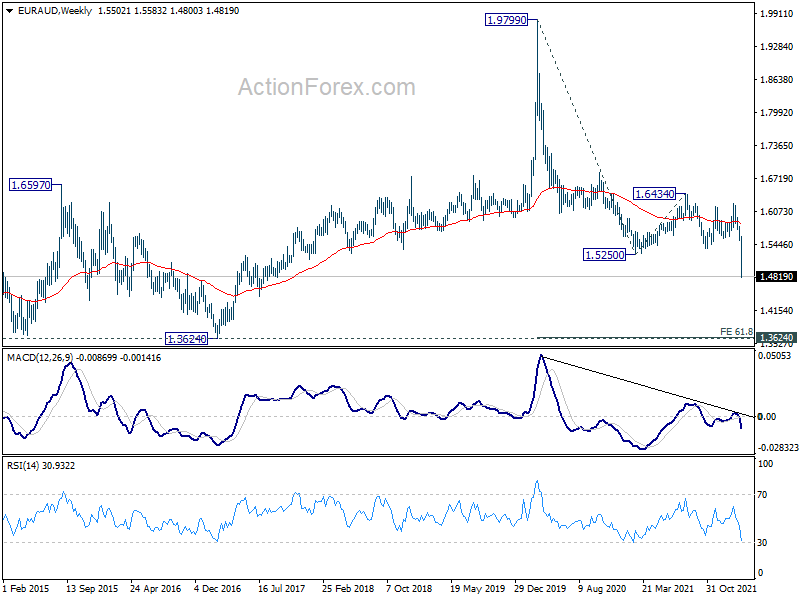
EUR/AUD in free fall towards 1.3623/4 first
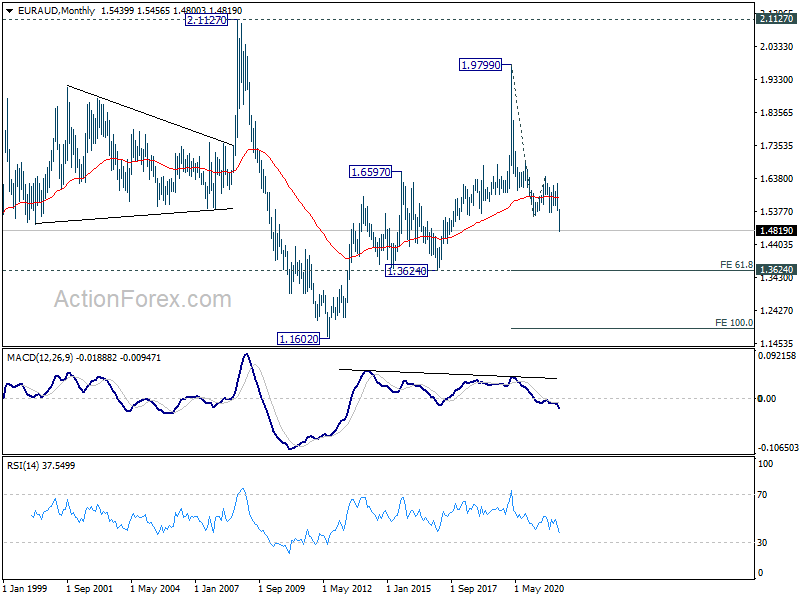
EUR/AUD was the biggest mover last week, losing a massive -5.15%. The strong break of 1.5250 low confirmed resumption of long term down trend from 1.9799 (2020 high). From a longer term perspective, the fall from 2.1127 (2008 high) to 1.1602 (2012 low) was an impulsive move. It’s followed by a three wave corrective move up to 1.9799. Decline from there is so far, rather impulsive looking.
Hence, for the medium term, EUR/AUD could first target 61.8% projection of 1.9799 to 1.5250 from 1.6434 at 1.3623, which is close to 1.3624 long term support (2017 low). It’s still early to say, but there is prospect of a long term down move to 100% projection at 1.1885 before forming a real bottom.
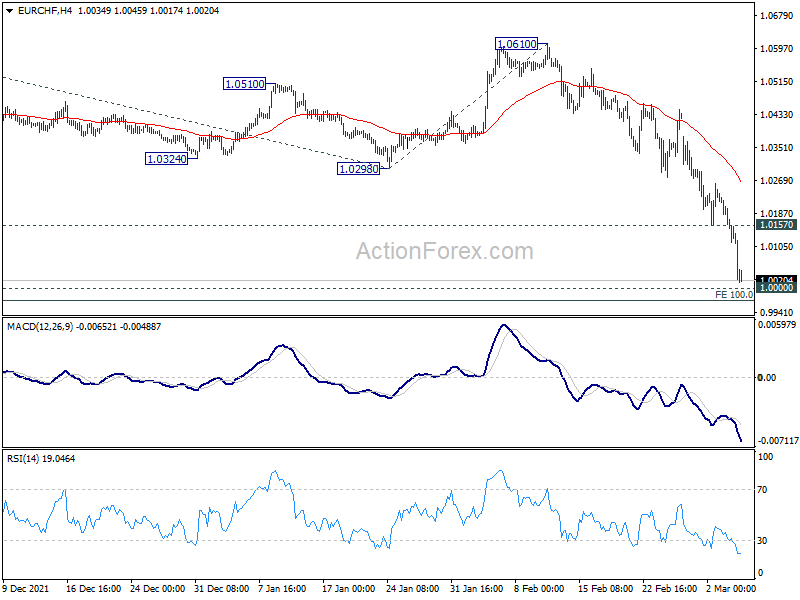
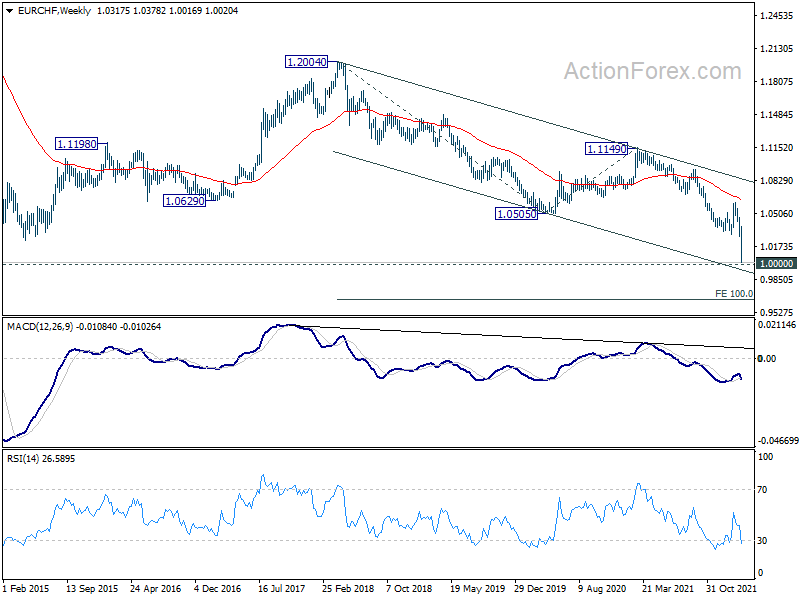
EUR/CHF Weekly Outlook
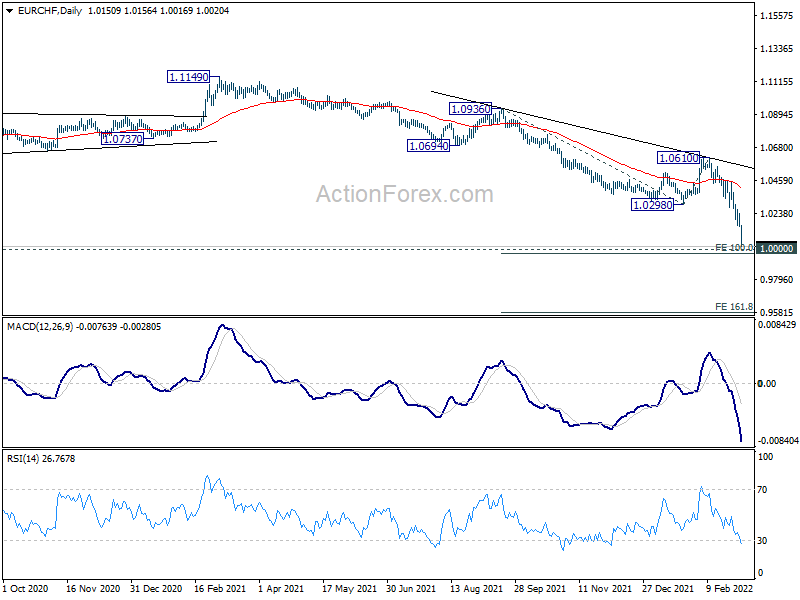
EUR/CHF’s down trend accelerated to as low as 1.0016 last week, just ahead of parity. Initial bias stays on the downside this week for 100% projection of 1.0936 to 1.0298 from 1.0610 at 0.9972. There might be some support there, and break of 1.0157 minor resistance will turn intraday bias neutral first. But in any case, near term outlook will stay bearish as long as 1.0298 resistance turned support holds. Firm break of 0.9972 will target 161.8% projection at 0.9578.
In the bigger picture, long term down trend from 1.2004 (2018 high) is still in progress. Next target is 100% projection of 1.2004 to 1.0505 to 1.1149 at 0.9650. Firm break there will target 100% projection at 0.9650. In any case, break of 1.0505 support turned resistance is needed to be the first sign of medium term bottoming. Otherwise, outlook will remain bearish.
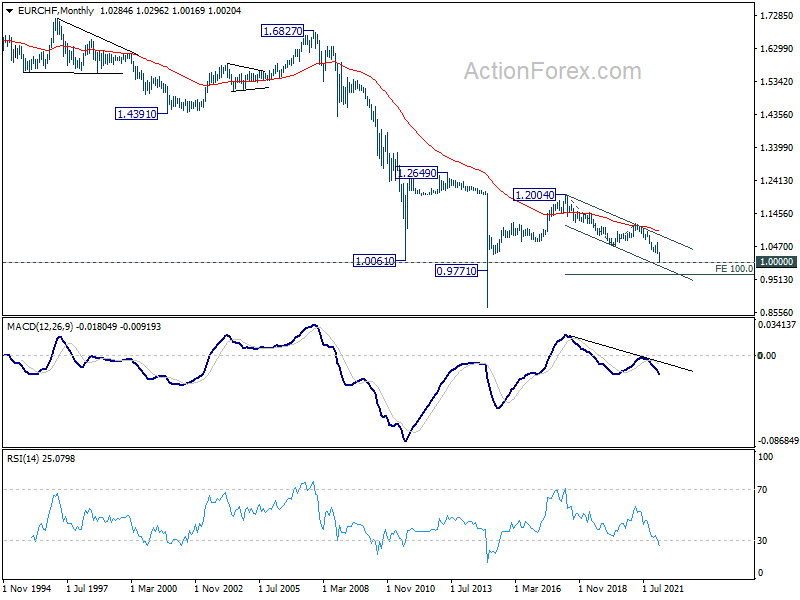
In the long term picture, capped below 55 month EMA, EUR/CHF is seen as extending the multi-decade down trend. There is no prospect of a bullish reversal until some sustained trading above the 55 month EMA (now at 1.0909).


