
In a week brimming with financial intricacies, the most surprising element was the remarkable bounce-back in US stocks post the release of the compelling non-farm payroll report. Conventional wisdom would suggest that such a robust report would serve to reinforce Fed’s inclination towards prolonging its restrictive monetary policy, even if it doesn’t proceed with another rate hike.
Amidst this, a significant backdrop event was the soaring treasury yields, particularly in the long end, which tightens up financial conditions significantly. The yield curve’s brisk return to normalcy, additionally, would typically sound alarms of an impending recession.
Yet, curiously, the anticipated bearish impact on stocks and bullish momentum for Dollar remained elusive. This puzzling disconnect raises critical questions: Is the market’s reaction an endorsement of their unwavering faith in the resilience of the US economy and the prospects of soft landing? Or is it a misjudgment that will soon be corrected? While the answer remains to be seen, what’s undeniable is that the market’s reaction has introduced a layer of complexity.
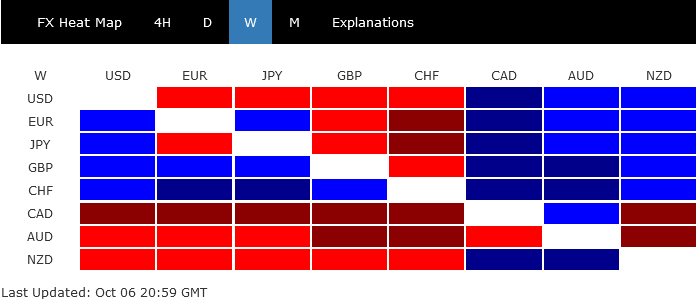
By the week’s end, Dollar exhibited a mixed performance – gaining against commodity currencies but ceding ground to Yen and European majors. Yen’s performance, despite unverified intervention by Japanese authorities, only marginally outpaced Dollar, leading to an essentially mixed finish. Swiss Franc and Sterling emerged as the week’s star performers, with Euro not far behind. Conversely, Australian Dollar languished at the bottom, with Canadian and New Zealand Dollars keeping it company.
Post-NFP U-turn: Real sentiment shift or temporary reprieve?
The financial market threw a curveball that left many analysts and investors scratching their heads. In the wake of the release of an unexpectedly robust non-farm payroll report, US stocks, initially plunging, made an astonishing recovery. The S&P 500 and NASDAQ rallied to close the week with gains of 0.48% and 1.60% respectively, a remarkable turnaround underpinned by complex dynamics, while DOW registered just a marginal decline of -0.30%.
The sustainability of this unexpected rally is yet to be determined. As the market oscillates between caution and optimism, all eyes are on the upcoming CPI data, poised to either validate or challenge the prevailing market storylines.
A combination of factors seems to be at play. Some analysts speculate that traders, in anticipation of the forthcoming CPI data and recognizing a long US weekend on the horizon, opted to secure profits. Meanwhile, others recognized that robust September job growth, stable unemployment figures, and moderating wage inflation may be reinforcing the prospects of a more gradual economic deceleration or a “soft landing.”
In the aftermath of the NFP, the prospects of an additional Federal Reserve rate hike have risen, albeit marginally, and remain below the pivotal 50% threshold. A growing narrative suggests Fed’s focus is less on payroll growth and more intently centered on inflation. The fact that over the past quarter, average hourly earnings have climbed at an annual rate of 3.4% lends weight to this viewpoint. Such a trend, if persistent, aligns well with inflationary figures residing in the mid-to-lower 2% range.
Furthermore, some market watchers suggest that the recent sharp rise in treasury yields, inducing notable financial tightening, may alleviate some pressure on the Fed to introduce further policy adjustments. As articulated by San Francisco Fed President Mary Daly, such market adjustments have effectively “done the work” for Fed.
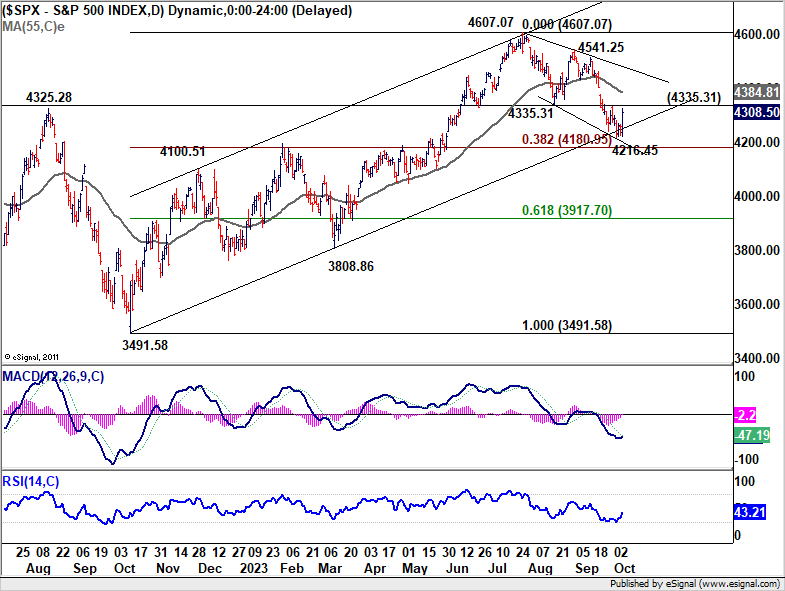
Now, an immediate question is whether S&P 500 has completed the correction from 4067.07 high. That came after drawing support from medium term rising channel, and above 38.2% retracement of 3491.58 to 4607.07 at 4180.95. To confirm this bullish case, there are two hurdles to overcome, 4335.31 support turned resistance, and 55 D EMA (now at 4384.81). In particular, sustained trading above 55 D EMA will strengthen the bullish case, and set the stage for resuming whole up trend from 3491.58.
US treasury yields skyrocket: Impending recession or robust economic signal?
US treasury market experienced significant tumult, particularly in long-term bonds. Both 10- and 30-year yields soared to peaks not seen since 2007. Despite a modest retraction as the week concluded, the surge in these yields was nothing short of striking.
Various economists offered insights into the possible catalysts behind the treasury sell-off. A faction among them emphasized bond investors’ growing apprehensions about US government’s escalating expenditures and the swelling budget deficit, with particular emphasis on rising costs of servicing the debt.
On a more sanguine note, Richmond Fed President Thomas Barkin alluded to the recent influx of positive economic data as a pivotal driver for these higher yields. By this logic, a thriving economy would cement the position of Federal Reserve interest rates, keeping them elevated for an extended period.
Yet, another prevailing argument revolves around the surge in bond supplies, fueled by copious fiscal issuance.
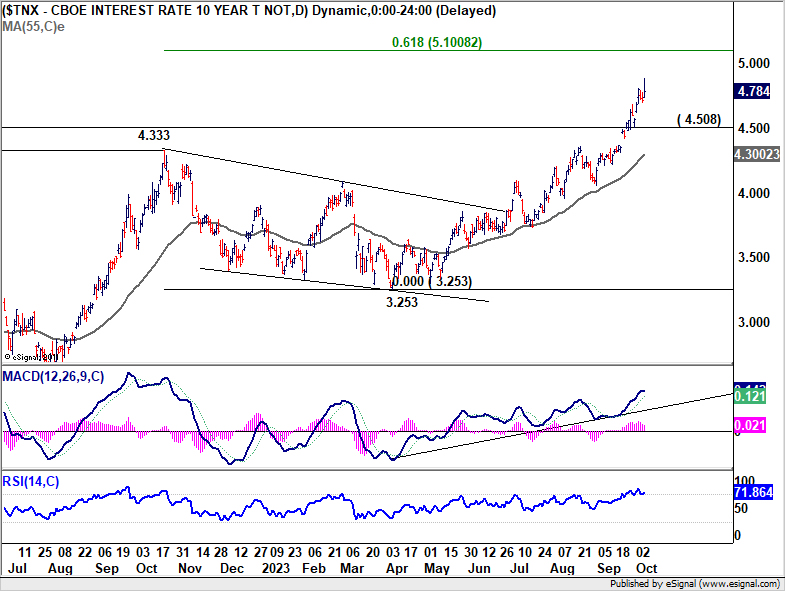
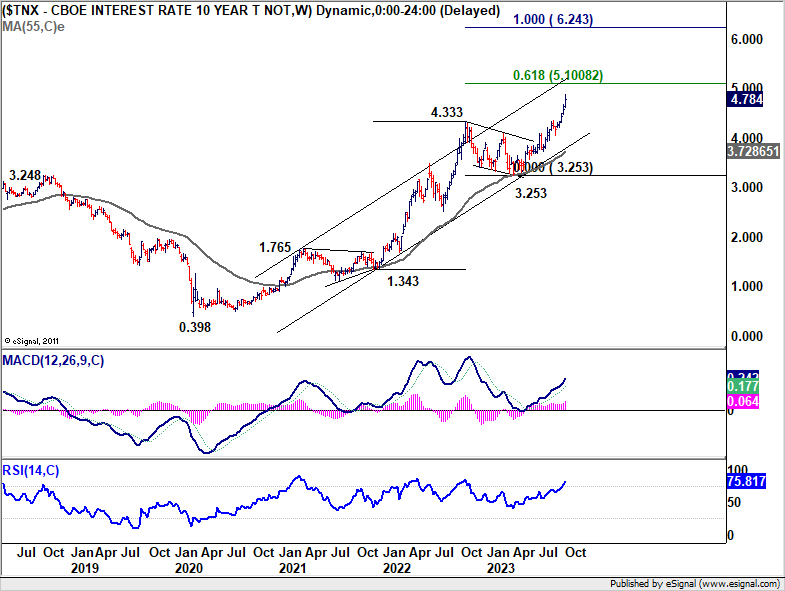
Reflecting on these dynamics, achieving a 10-year yield of 5% seems much less of a stretch today, compared to a mere two months back when it lingered below 4.3%.
From a technical standpoint, Technically, near term outlook in TNX will remain bullish as long as 4.508 support holds, in case of retreat. Current rally should target 61.8% projection of 1.343 to 4.333 from 3.253 at 5.100. Reaching this juncture would perfectly round off the five-wave uptrend originating from the 2020 low of 0.398.
Another intriguing trend to note in the treasury space is the swift normalization of yield curve – a phenomenon some are terming “de-inverting.” The spread between the 2- and 10-year yields has slimmed dramatically, standing at a scant 30bps, in stark contrast to 108 bps just three months ago. With the 2-year yield presently pegged at 5.08%, we could witness a total disinversion any time.
Historically, a fully normalized yield curve has been regarded by many analysts, ourselves included, as a precursor to an impending recession.
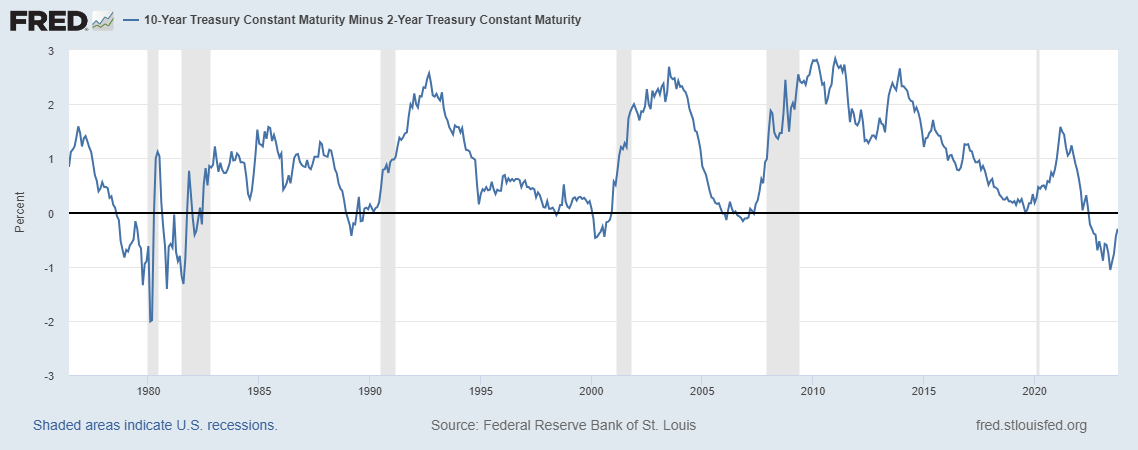
Many market observers, ourselves included, perceive a fully normalized yield curve as a harbinger of an oncoming recession. This notion is bolstered by historical trends that typically presage economic downturns. However, current job market statistics don’t yet hint at such concerns. ISM manufacturing index is improving, while ISM services demonstrate consistent resilience.
It suggests that while potential economic headwinds might be on the horizon, they may need more time to manifest. Perhaps, it would take 10-year yield surpassing the aforementioned 5.1% projection or a definitive bearish pivot in stock trends to bring these concerns to the forefront.
Dollar Index pulls back, topped in short term already?
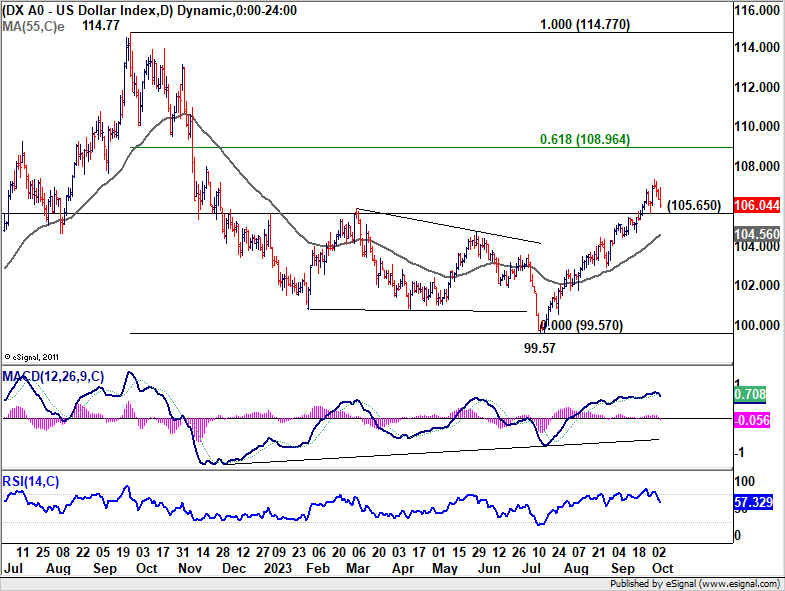
In a counterintuitive move against the backdrop of soaring benchmark yields, Dollar Index reversed course. After an initial surge to 107.34, it settled down, closing the week at 106.04. Immediate focus is now on 106.65 support in the next few days. Firm break there will confirm short term topping, and bring deeper pull back to 55 D EMA (now at 104.56). Strong support is expected from there contain downside and bring rebound.
Rise from 99.57 is seen as reversing the whole down trend from 114.77. Further rally is expected, even with interim consolidations, to 61.8% retracement of 114.77 to 99.57 at 108.96 next. This will remain the favored case as long as 55 D EMA is not sustainably violated.
Japan silent on intervention, but expands view on excessive volatility
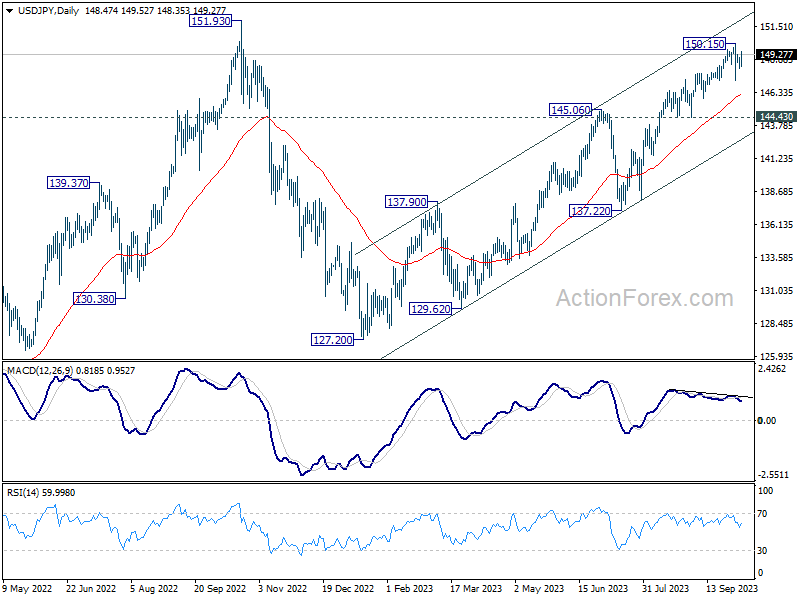
Another important development was Japan’s possible intervention when USD/JPY momentarily surpassed 150 mark. This swift intervention, though not explicitly confirmed, resulted in USD/JPY plunging to 147.28 within just five minutes. However, the pair showed resilience, steadily regaining its footing as the week progressed.
Japan’s reticence on its active role in the currency markets became evident when top officials refrained from acknowledging their intervention. This raises a pertinent question: What drives Japan’s decision to step in? Finance Minister Shunichi Suzuki, when probed if the 150 level serves as an intervention trigger, clarified, “Currency levels are not our criteria. It is volatility that matters.”
However, this statement leads to further curiosity regarding Japan’s interpretation of “volatility”. The recent depreciation of Yen over the last three months doesn’t appear sharp, especially when juxtaposed against the entire trajectory of 2022. This has left market observers speculating on Japan’s rationale.
In what could be an enlightening insight into Japan’s stance, the nation’s chief currency diplomat, Masato Kanda, elucidated, “If currencies move too much on a single day or, say, a week, that’s judged as excess volatility.” Kanda added another dimension, noting, “Even if that’s not the case, if we see one-sided moves accumulate into very big moves in a certain period of time, that’s also excess volatility.”
Through Kanda’s elucidation, it becomes apparent that Japan’s intolerance isn’t confined to rapid depreciations but extends to gradual, yet “accumulated” devaluations of the Yen, unfolding over extended durations.
Technically speaking, while some fluctuations are likely in the near term, there is no indication of bearish reversal in USD/JPY as long as 144.45 support holds. A test on 151.93 high is still the favored case, even the road could be bumpy.
AUD/USD Weekly Report
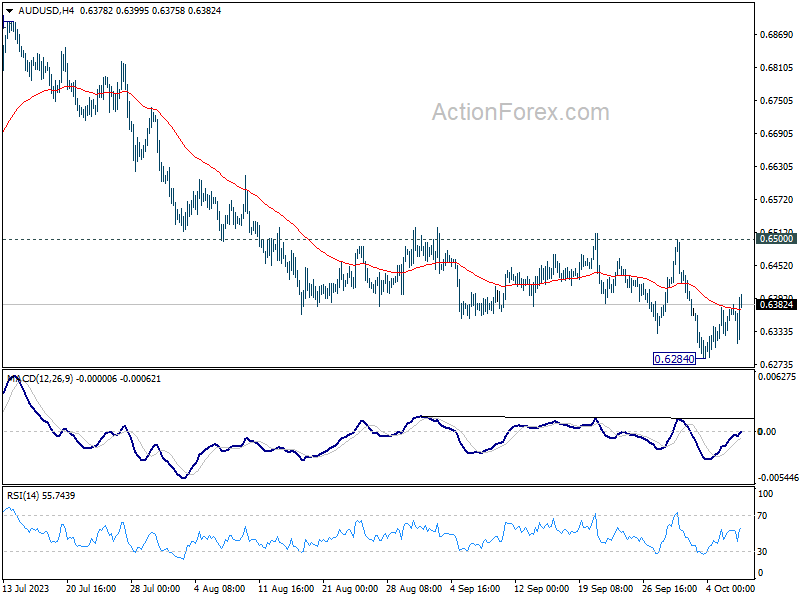
AUD/USD’s decline from 0.7156 resumed last week and fell to 0.6284. But a temporary low was then formed with subsequent recovery. Initial bias remains neutral this week for consolidations. Outlook will stay bearish as long as 0.6500 resistance holds. Below 0.6284 will resume the fall from 0.7156. Next target is 100% projection of 0.7156 to 0.6457 from 0.6894 at 0.6195.
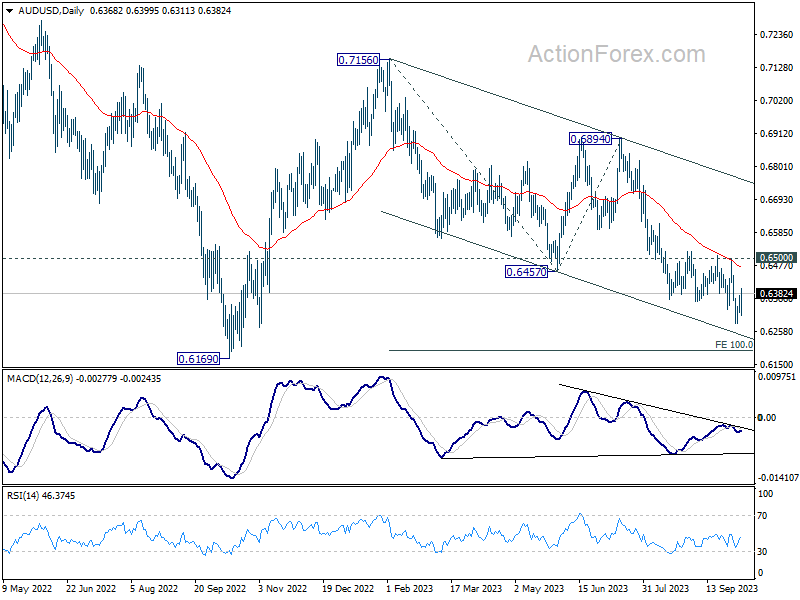
In the bigger picture, down trend from 0.8006 (2021 high) is possibly still in progress. Decisive break of 0.6169 will target 61.8% projection of 0.8006 to 0.6169 to 0.7156 at 0.6021. This will now remain the favored case as long as 0.6894, in case of strong rebound.
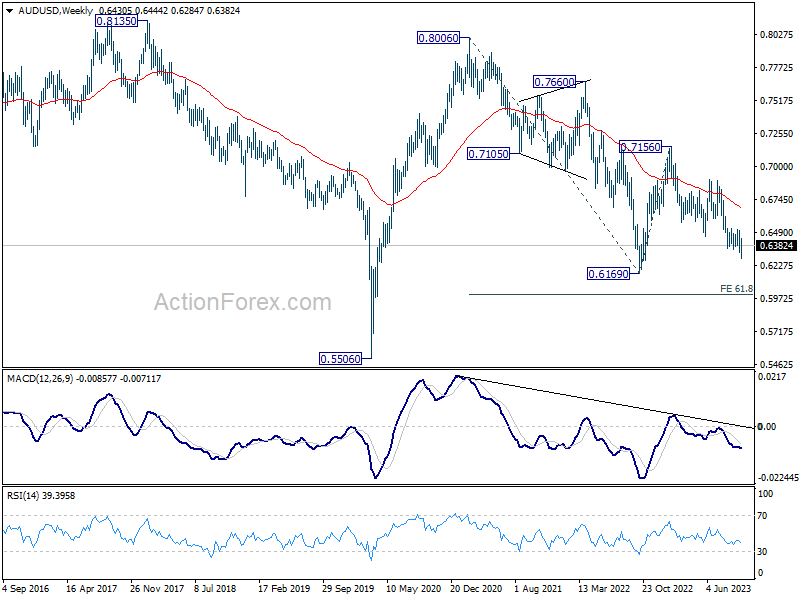
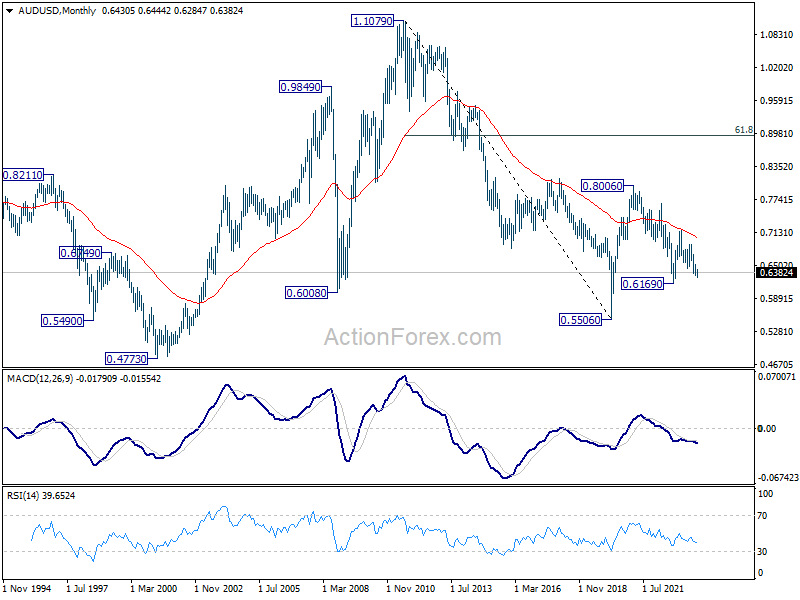
In the long term picture, while fall from 0.8006 might extend lower, the structure argues that it’s merely a correction to rise from 0.5506 (2020 low). In case of downside extension, strong support should emerge above 0.5506 to bring reversal. But still, momentum of the next move will be monitored to adjust the assessment.


