
Dollar ended last week broadly lower, outperforming only the even more beleaguered Yen. That said, the technical deterioration in Dollar is still measured rather than decisive. For now, Dollar’s selling momentum reflects hesitation more than capitulation.
Two key forces are shaping this fragile balance. The first is indecisive risk sentiment, which remains unsettled rather than clearly bullish or bearish. Markets continue to wrestle with competing narratives, Fed easing and AI overvaluation, that have yet to converge into a unified directional signal.
The second, and potentially more consequential, factor emerged late last week with a sharp shift in expectations surrounding the next Fed Chair. The repricing was sudden and meaningful, triggering a drastic jump in the US 10-year yield.
If this repricing in yields proves durable, it could offer Dollar an unexpected lifeline. Rather than extending its decline, the greenback may find support from a renewed debate over the future shape of US monetary policy. That makes the bearish case less straightforward than recent price action implies.
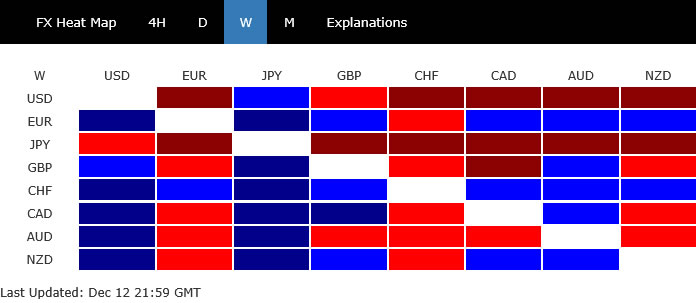
Across currencies, Swiss Franc led the week after SNB pushed back against dovish speculations. Euro followed, largely on Dollar weakness, while Kiwi benefited from Aussie underperformance. Yen was firmly at the bottom despite growing expectations of a BoJ rate hike Dollar ranked second weakest. Aussie was the third worst after labor market disappointment cooled RBA 2026 hike speculations.
Sterling and Loonie ended mixed in the middle. Sterling is weighed down by poor GDP data that reinforces a rate hike in the coming days. Loonie was just steady after BoC’s rate hold and affirmations that it’s now in a long pause.
Fed Cuts Fuel Rally in Traditional Stocks, but Tech Faces Structural Test
US stock markets struggled to find a common direction last week, with gains in traditional sectors offset by renewed weakness in technology. Technology shares bore the brunt of selling pressure, with NASDAQ closing the week down -1.6%. The move reflected mounting concern that AI-driven growth may not translate into profits as smoothly or as quickly as previously assumed, particularly as costs rise alongside scale.
A clear example is Broadcom, which became the focal point of this reassessment towards the end of the week. Despite beating earnings and revenue expectations, its shares collapsed more than -11%. Investors dismissed the headline beat—boosted by one-off factors—and zeroed in on margin compression driven by the rapid expansion of lower-margin, custom AI processors.
This dynamic exposes a key vulnerability in the AI story. While demand is undeniable, the economics are less compelling. Shifting product mixes toward high-volume AI chips boost revenues but dilute margins, forcing investors to rethink how much future growth is truly worth today.
Beyond individual companies, the concern is structural. AI inference workloads are vastly more resource-intensive than traditional computing tasks. Serving each incremental user query requires substantial compute power, raising operating costs and straining margins, especially for firms without diversified revenue streams.
This issue is already evident among AI-focused startups, many of which report strong revenue growth alongside weak or negative gross margins. The market is increasingly wary that similar dynamics could eventually affect larger players, triggering a broader valuation reset rather than isolated corrections.
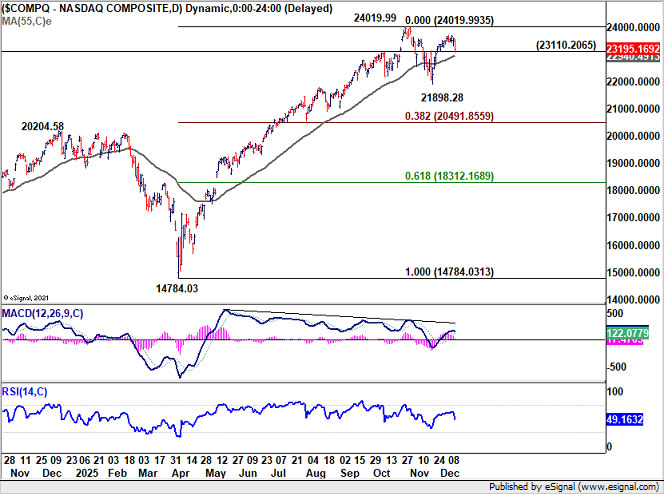
Technically, NASDAQ is pressing key near term support at 23,110.20. Decisive break there would confirm rejection at 24,019.99 high. Sustained trading below 55 D EMA (now at 22,940.48) will solidify the case that corrective pattern from 24,019.99 is already in the third leg. Deeper fall should be seen to 21, 898.28 support, and possibly further to 38.2% retracement of 14, 783.03 to 24, 019.99 at 20, 491.85.
By contrast, traditional stocks continue to thrive. DOW and Russell 2000 both closed at new record highs, buoyed by confidence that the Fed’s easing cycle will extend into next year. DOW gained 1.1% over the week, while Russell rose 1.2%, highlighting broad-based strength outside tech.
After lowering interest rate as widely expected by 25bps to 3.50-3.75% last week, the overall pricing of 2026 Q1 Fed path is essentially unchanged. A pause is widely expected in January, while a 25bps cut in March is at around 50%, pretty much a coin toss.
An important factor is Chair Jerome Powell’s emphasis on the job market during the post meeting press conference. That suggests, with Powell pretty at the center of the FOMC hawk/dove spectrum, the committee is still leaning more towards further easing. This is actually inline with the dot plots, which penciled in one more 25bps cut in both 2026 and 2027.
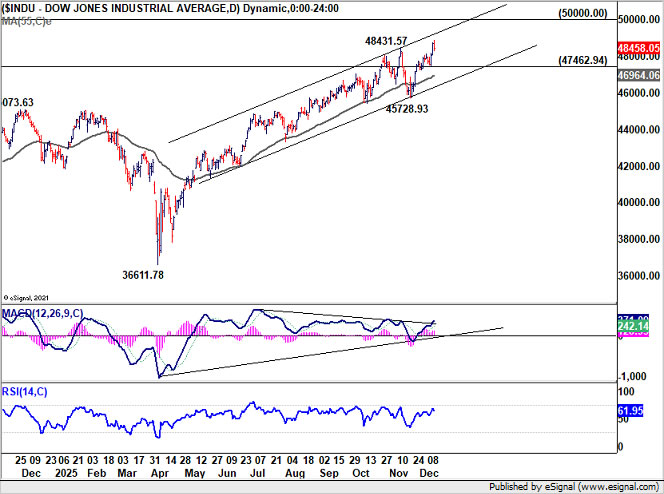
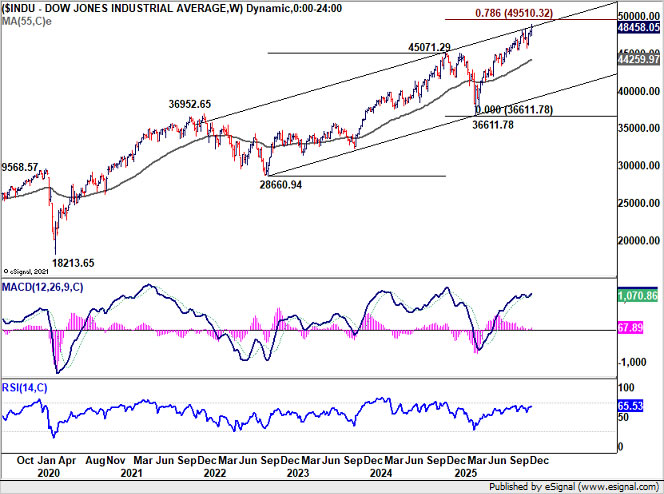
Technically, DOW’s up trend resumed by breaking through 48,431.57 last week and hit new record high. Near term outlook will stay bullish as long as 47,462.94 support holds. Next target is 78.6% projection of 28,660.94 to 45,071.29 from 36,611.78 at 49,510.32. Or even a bit further to 50k psychological level where the real test lies.
Yields Reawaken by Fed Bets, Dollar at a Crossroads
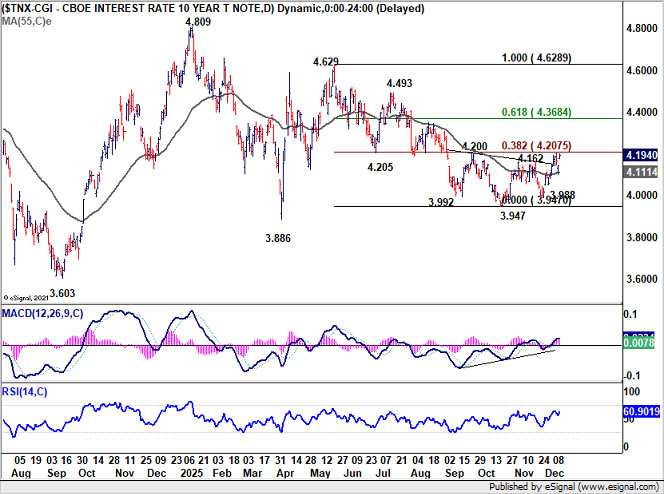
US long-term yields delivered one of the most striking moves of the week, with 10-year Treasury jumping sharply to end at 4.194. The rally followed a brief post-FOMC dip to 4.102, making the reversal both sudden and counterintuitive in the absence of fresh economic catalysts. The abrupt shift points to a reassessment of policy risk rather than a change in growth or inflation expectations.
Late-week reports suggested President Donald Trump may now favor Kevin Warsh to replace Jerome Powell, overtaking Kevin Hassett as the leading candidate. The implications for markets are significant, as Warsh’s policy instincts differ meaningfully from those of his rivals.
Historically, Warsh has been viewed as a policy hawk. During his time as a Fed Governor, he was critical of quantitative easing and vocal about the risks associated with excessive monetary intervention and rising government debt. Even though he has more recently signaled openness to rate cuts, his structural bias is still seen as far less dovish than Hassett’s.
That distinction is critical for markets looking ahead to 2026. A Fed chaired by Warsh would likely place a higher bar on sustained easing, forcing investors to reconsider assumptions embedded in the “lower for longer” narrative. The more accurate framing may now be “less low than expected.”
This repricing helps explain why yields found buyers precisely when technical support was tested. 10-year yield bounced cleanly off the flat 55 D EMA (now at 4.11). That reaction adds a mildly bullish technical undertone to the near term picture.
Immediate focus is back on 4.2 key cluster resistance, with 38.2% retracement of 4.269 to 3.947 at 4.207. Rejection by this level will keep near term outlook bearish for extending the decline from 4.629 through 3.947 low at a later stage. However, decisive break of 4.2 will argue that fall from 4.629 has already completed, and further rise should be seen to 61.8% retracement at 4.368 and possibly above.
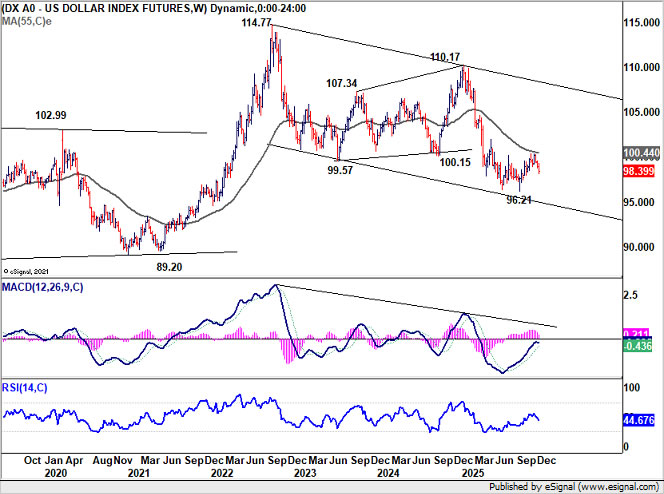
Meanwhile, Dollar Index extended the fall from 100.39 last week and immediate focus is now on 98.03 support. As noted many times before, rebound from 96.21 is seen as a corrective move. Firm break of 98.03 will argue that this corrective rise has completed after rejection by 55 W EMA (now at 100.44). That should bring deeper fall back to retest 96.21 low. In this case, there is also risk of immediate resumption of the whole down trend from 110.17.
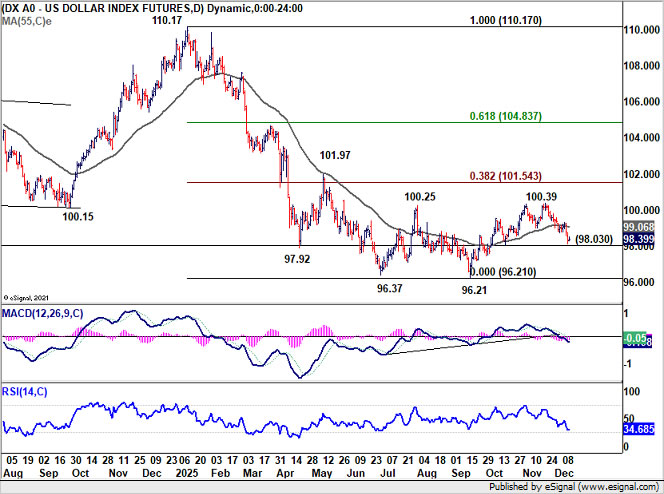
However, decisive break of 4.2 mark in 10-year yield could pull Dollar index higher and help it defend 98.03. In that case, another up leg could be seen with prospect of rising through 100.39 to 38.2% retracement of 110.17 to 96.21 at 101.54.
CHF/JPY Breakout Reflects SNB Resolve
Swiss Franc emerged as the strongest performer in the currency markets last week, drawing renewed support from the SNB after fears of a dovish shift proved unfounded. The central bank left its policy rate unchanged at 0.00%, as widely expected, but the tone of its communication was more important than the decision itself.
SNB acknowledged that recent inflation prints had undershot expectations in the near term, but emphasized that the medium-term inflation outlook remains “virtually unchanged” compared with September. In the post-meeting press conference, Chair Martin Schlegel struck a more upbeat tone than markets as he pointed to a modest reduction in uncertainty, helped in part by the recent US–Swiss trade agreement, which lowered tariff ceilings and improved export visibility for Swiss firms.
Crucially, Schlegel made clear that the SNB does not target a specific inflation point within its 0–2% stability band. As long as inflation remains within that range, there is no urgency to engineer a move toward the midpoint. This directly undercut speculation that the SNB might feel compelled to loosen policy further. He also reiterated that the bar for returning to negative interest rates remains high,.
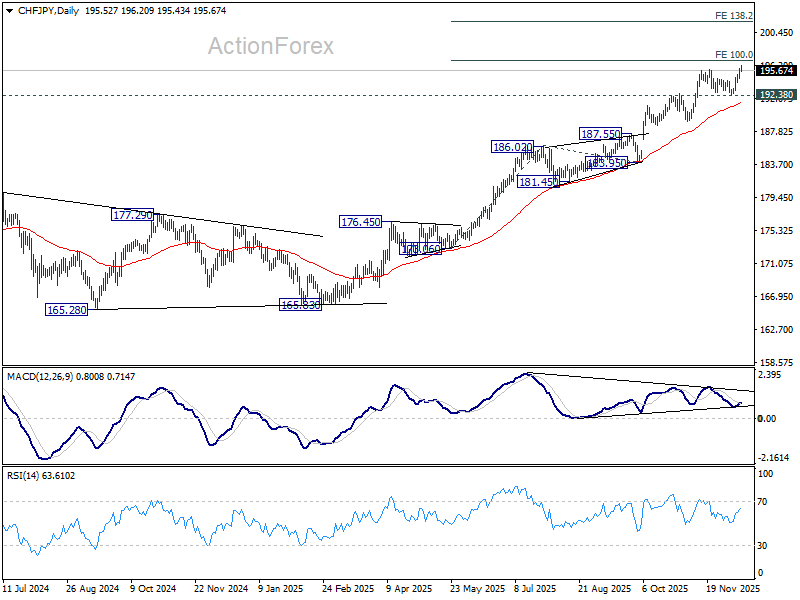
As a result, CHF/JPY surged to new multi-decade high, partly also due to Yen’s broad based weakness. Technically, CHF/JPY’s up trend resumed and is now on track to 100% projection of 173.06 to 186.02 from 183.95 at 196.91. Some resistance could be seen there to cap upside on first attempt. But outlook will stay bullish as long as 192.38 support holds, in case of retreat. Decisive break of 196.91 will pave the way to 138.2% projection at 201.86 next.
AUD/USD Weekly Report
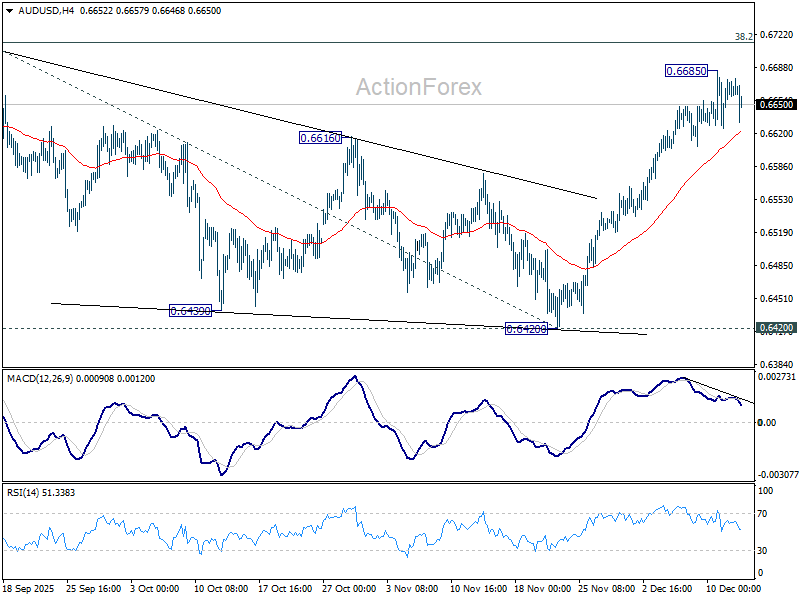
AUD/USD’s rally from 0.6420 continued last week and hit as high as 0.6685 but retreated ahead of 0.6706 high. Initial bias remains neutral this week first. On the upside, firm break of 0.6706 will confirm resumption of whole rise from 0.5913. Next target is 61.8% projection of 0.5913 to 0.6706 from 0.6420 at 0.6910. However, break of 55 D EMA (now at 0.6552) will extend the corrective pattern from 0.6706 with another falling leg.
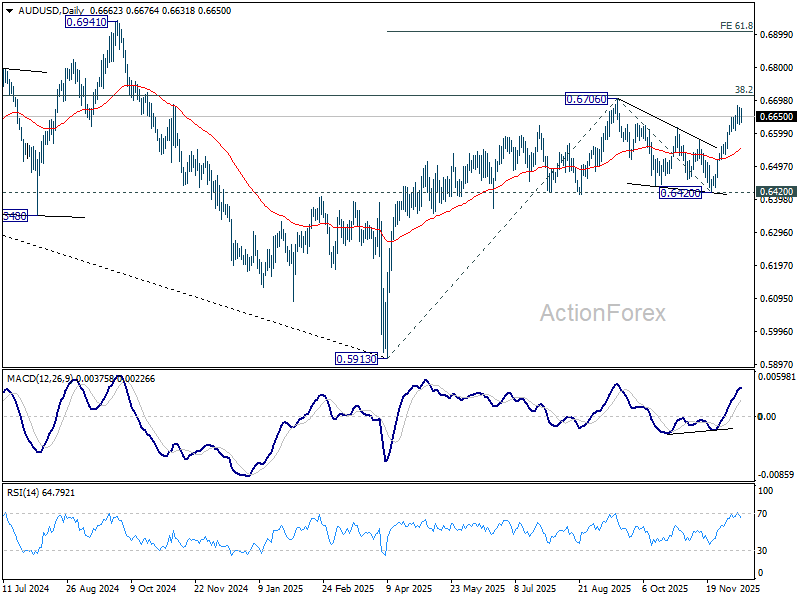
In the bigger picture, the break of multi-year falling trend line resistance suggests that rise from 0.5913 is possibly reversing whole down trend from 08006 (2021 high). Decisive break of 38.2% retracement of 0.8006 to 0.5913 at 0.6713 will solidify this case, and bring further rally to 61.8% retracement at 0.7206. On the downside, however, firm break of 0.6420 support will suggest rejection by 0.6713 and retain medium term bearishness.
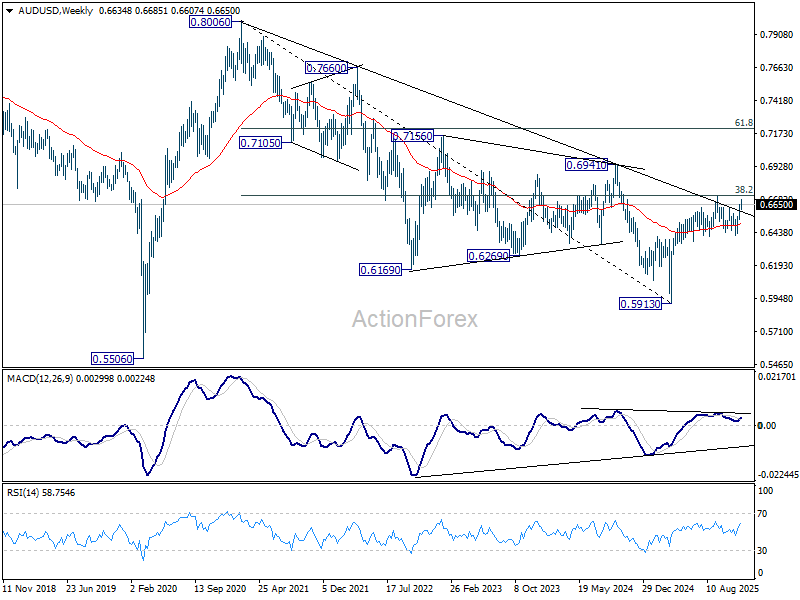
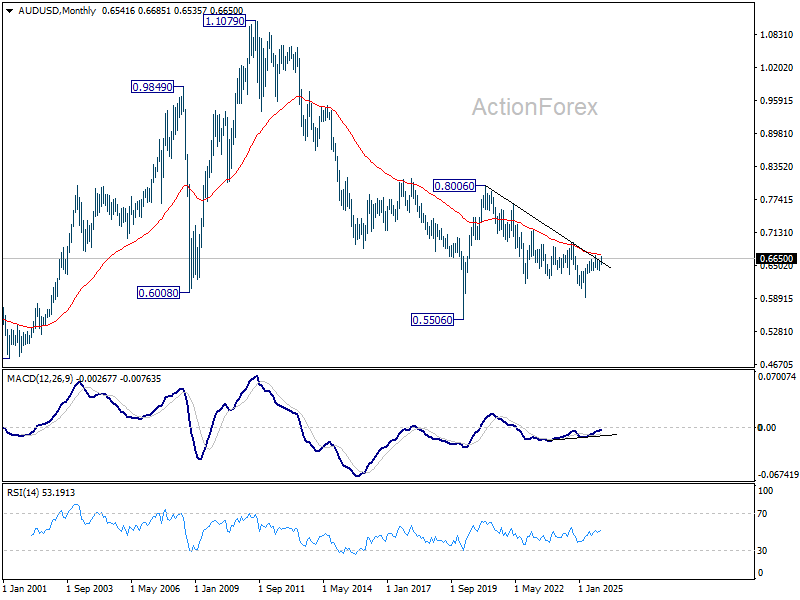
In the long term picture, fall from 0.8006 is seen as the second leg of the corrective pattern from 0.5506 long term bottom (2020 low). Hence, in case of deeper decline, strong support should emerge above 0.5506 to contain downside to bring reversal. On the upside, firm break of 0.6941 will argue that the third leg has already started back to 0.8006 and above.