Japanese Yen ended as the strongest major currency last week as selloff in global stock markets intensified. Dollar followed closely as the second strongest. Sterling, however, ended as the weakest one despite hawkish BoE announcement which hinted at earlier and faster rate hikes. Euro followed as the second weakest while Aussie was the third weakest. DOW recorded two of the largest single day point drops over the week. And two days of more than 1000 pts decline was definitely historic. Judging from the technical pictures of DOW, FTSE and DAX, while the corrections are not finished, they would enter into "buy zone" of traditional medium term corrections on next fall. That is, we could see the selling recedes soon. However, we’d like to point out a big risk ahead, China stocks, that could make these global selloffs long term corrections.
Outlook of China stocks worst among all
Before going into American and European indices, we’d like to share the chart of the China Shanghai composite first. It tumbled -332 pts or -9.6% last week to 3283.74. More importantly, firstly, the choppy medium term rebound from 2638.30 (2016 low) should have completed. Secondly, structure of the rebound suggests that it’s a corrective move. Thirdly, it was rejected cleanly by 3684.56 resistance as well as 38.2% retracement of 5178.19 (2015 high) to 2638.30) at 3608.53. These three observations argue that SSE is ready to resume the down trend from 5178.19.
For the near term, 3000 psychological level is the key. It’s close to 3016.03 structural support. It also coincides with 61.8% retracement of 2638.30 to 3587.03 at 3000.71. It’s also close to 55 month EMA (now at 2971.51). At the same time, it’s a level that could prompt government interventions. However, if the index fails to defend this 3000 handle, we could indeed see a push through 2638.30 low later this year to 61.8% projection of 5178.19 to 2638.30 from 3587.03 at 2017.37. And in that case, it’s highly likely for contagion to other parts of the world. This is seen by us as one of the the biggest risks to the global markets.

Oil could also be reversing medium term trend
Another one to look at is WTI crude oil, which lost -9.5% to 59.20 on worry of over production in the US. It has clearly topped out, at least in near term, at 66.66. More importantly, it was rejected by 61.8% retracement of 107.73 to 26.05 at 66.87, as well as 100% projection of 26.05 to 51.67 from 42.05 at 67.67. Such observations imply that whole rebound from 26.05 has completed. For the near term, deeper fall is now in favor to 55 week EMA at 53.73. Break there could accelerate the decline to 42.05 cluster support (61.8% retracement of 26.05 to 66.66 at 41.56) before crude oil could get realistically sustainable support. This is another big risk to the global markets.
DOW to enter into medium term "buy zone"
Back to equities, DOW once hit as low as 23360.29 (-2160.67 pts down from prior week’s close of 25520.96) before paring some losses to close at 24190.90. It still ended the week down -1330.06 pts, or -5.2%. There is no sign of near term bottoming yet. But if it’s only correcting the up trend from 15450.56, downside potential is relatively limited. There will be strong support firstly from 55 week EMA (now at 22564.40) and 38.2% retracement of 15450.56 to 26616.71 at 22351.24. So DOW would enter into a medium term "buy zone" on the next fall.
However, if the fall from 26616.71 is a correction of a larger scale, accompanied by deeper crash in China and oil, the story will be difference. And in that case, DOW would head to 38.2% retracement of 6469.96 to 26616.71 at 18920.64, before making a bottom. That is close the the level when US President Donald Trump got elected.
So does FTSE…
Picture in FTSE is similar If it’s just correcting the up trend from 5499.50, it’s now very close to channel support (now at 7030), as well as 38% retracement of 5499.50 to 7792.56 at 6916.61. Strong support should be seen from there, at least on first attempt, to bring sustainable rebound.
… and DAX
For DAX, it’s also close to 11868.86 cluster support (38.2% retracement of 9214.09 to 13596.89 at 11922.66). If fall from 13596.89 is just correcting the up trend from 9214.09, there should be strong support from 11868.86, at least on first attempt, to contain downside and bring sustainable rebound.
DXY: Wait for break of 91.01 to assess chance of trend reversal
Yen and Dollar are the two strongest major currencies in February so far. Has the greenback bottomed? For the near term, the close above 90 handle is a sign of bottoming. It looks like the corrective decline from 103.82 is trying to end earlier than we expected. And, it’s drawing support from 50% retracement of 72.69 to 103.82 at 88.25. But without other apparent sign, we’d prefer to, at least, see a firm break of 91.01 support turned resistance before considering a trend reversal. As long as 91.01 holds, the index could still head lower to 84.75 (61.8% retracement of 72.69 to 103.82 at 84.58) before reversing. Nonetheless, firm break of 91.01 will bring 95.15 resistance into focus.
Position trading strategy
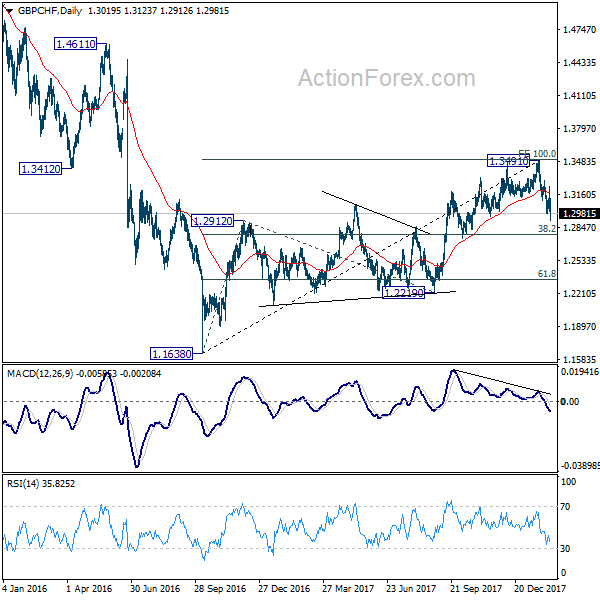
We’ve sold GBP/CHF on break of 1.3105 last week. The short trade once looked very shaky on post hawkish BoE rebound. But it was limited at 1.3239, below our stop at 1.3300, and headed lower again. Worries on no-deal for Brexit transition is cited by many as the reason for Sterling’s decline on Friday. We partly agree to it as the chance for BoE to pull ahead the next rate hike to May hinges on completing a Brexit transition deal. Nonetheless, the lack of follow through buying in Sterling after BoE was also a big hint on underlying indecisiveness.
Anyway, we maintain our view that a short term top was at least formed at 1.3491 on bearish divergence condition in daily MACD. 3491 is very close to 100% projection of 1.1638 to 1.2912 from 1.2219 at 1.3493. And, considering the price actions from 1.1638 (2016 low), the rise from there could be a corrective move completed with three waves at 1.3961. That is, first wave ended at 1.2912, second as a triangle ended at 1.2219, third at 1.3491. Fall from there should extend to 38.2% retracement of 1.1638 to 1.3491 at 1.2783 as the first target. But we’re actually looking at 61.8% retracement at 1.2346 and below. We’ll hold short in GBP/CHF, with stop lowered to 1.3240.
EUR/JPY Weekly Outlook
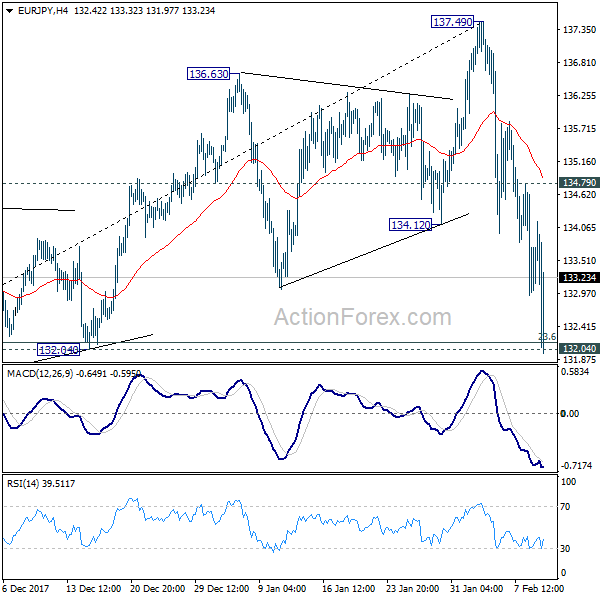
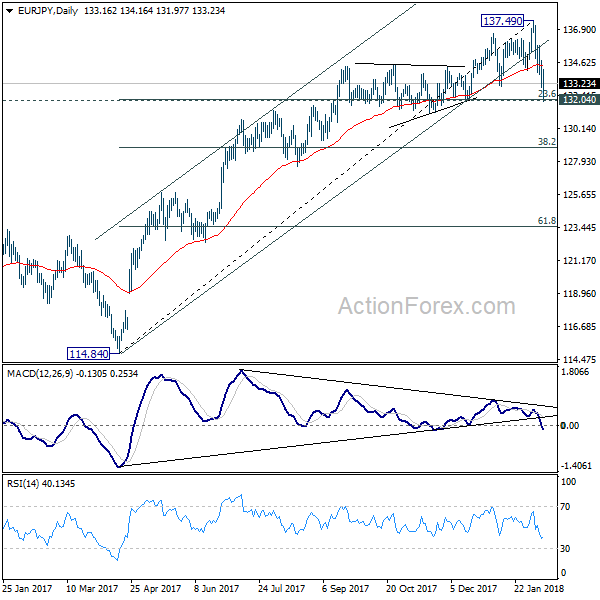
EUR/JPY’s sharp decline last week confirmed short term topping at 137.49. Initial bias remains on the downside this week with focus on 132.04 cluster support first (23.6% retracement of 114.84 to 137.49 at 132.14). Decisive break there will indicate larger trend reversal on bearish divergence condition in daily MACD. In such case, outlook will be turned bearish for 38.2% retracement at 128.38 first. Nonetheless, rebound from 132.04 will retain near term bullishness Break of 134.79 minor resistance will bring retest of 137.49 high instead.
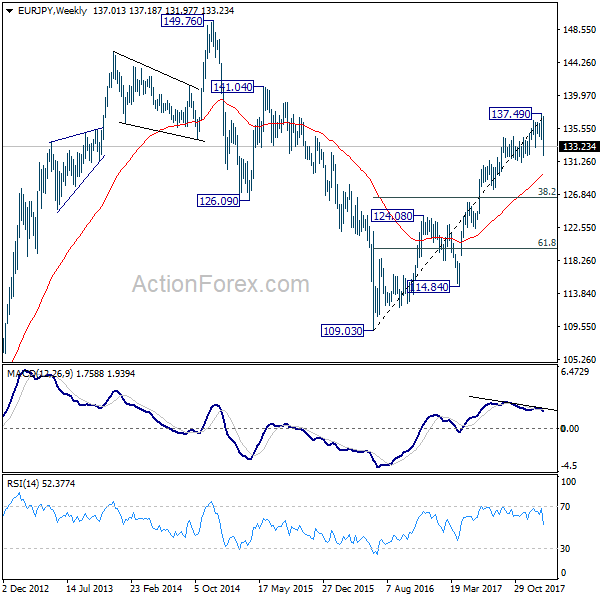
In the bigger picture, bearish divergence condition in week EMA indicates lost up medium term up trend momentum. But there is no clear sign of completion of up trend from 109.03 yet. Break of 137.49 will target 141.04/149.76 resistance zone. However, sustained break of 132.04 will be the early sign of long term reversal and should bring deeper fall back to retest 124.08 key support level.
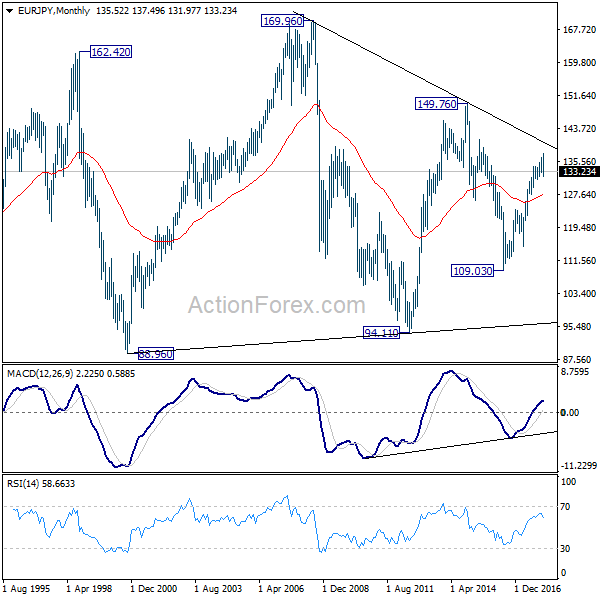
In the long term picture, at this point, EUR/JPY is staying in long term sideway pattern. established since 2000. Rise from 109.03 is seen as a leg inside the pattern. As long as 124.08 support holds, further rally is in favor in medium to long term through 149.76 high. However, break of 124.08 could extend the fall through 109.03 low instead.