
Dollar was given a powerful boost last week on a couple of factors. Firstly, 10 year yield extended recent bull run and hit 3% level for the first time since 2014. Secondly, Euro was sold off steeply after the confusing messages from ECB President Mario Draghi during the post meeting press conference. The common currency was then pressured further after French GDP miss. Thirdly, Sterling joined the selloff after poor Q1 GDP result that almost killed off the chance of a May BoE rate hike. Fourthly, Dollar managed to secure most of the weekly gains after better than expected Q1 GDP result from the US.
However, it should be noted that there was notable retreat in 10 year yield (TNX) on Thursday and Friday, it closed the week at 2.957, just above prior week’s close at 2.951, and even below the weekly open at 2.975. Dollar index also reversed the daily gains on Friday after better than expected GDP report. We’d view TNX and DXY in critical juncture where more is needed to prove their underlying power.
The coming week will feature many heavy weight events that would finally confirm the main trend in the markets. US events include FOMC rate decision, PCE inflation, ISM indices and non-farm payrolls. Eurozone data include Q1 GDP, April CPI flash and European Commission economic forecasts. UK data include manufacturing, services and construction PMIs.
Euro tumbled on ECB outlook, but CAC cheered French data miss
Let’s have a quick recap on Euro first. ECB left monetary policy unchanged last week as widely expected. President Mario Draghi’s post meeting introduction statement noted there was “solid and broad-based expansion” in the Eurozone despite weaker than expected data. However, in the Q&A, Draghi said that Governing Council didn’t even discuss monetary policy “per se” during the meeting. And that’s because more time was needed to assess whether the slowdown in Q1 was “temporary or permanent”. And Draghi also cautioned that understanding the factors behind the moderation in growth is “essential for informing our next decisions.”
The clearly showed ECB policy makers were wondering what recent weak batch of data actually meant in terms of economic outlook. French GDP released on Friday showed only 0.3% qoq growth, down from prior quarter’s 0.7% qoq and missed expectation of 0.4% yoy. The data could prompt some worry among policy makers that Q1’s slowdown was deeper than they originally thought. For now, it is still early to tell if ECB would stop the asset purchase program after September. But it’s getting less likely that ECB will have a decision on it by June meeting.
The upcoming Eurozone GDP on May 2 will provide further evidence on how deep the slowdown was back in Q1. And CPI flash on May 3 will tell us how, or whether, inflation was starting to pick up again at the start of Q2. European Commission forecasts will also tell us how economists there view the outlook.
The solid rally in CAC last week showed that investors were not bothered with the French GDP miss. Instead, they cheered as that could keep ECB’s stimulus longer. CAC closed the week strongly at 5483.19 and is on course to retest 5667.02 high.
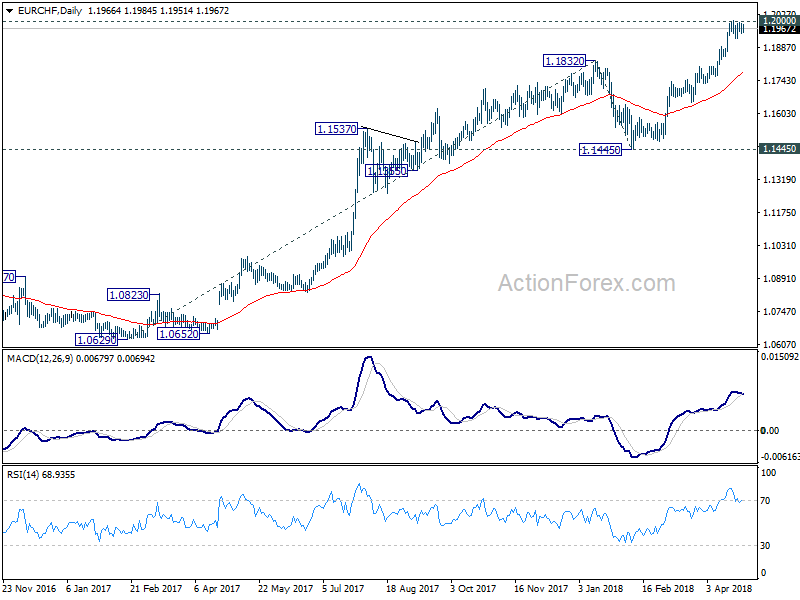
Meanwhile, it should be noted that Euro’s performance was not too bad as it closed the week up against Yen, Swiss Franc, Sterling and Kiwi. Clearly, Yen was troubled by surging US yield. Sterling was troubled by receding BoE rate expectation. Kiwi was troubled but its own sluggish inflation and dovish RBNZ. And finally, solid risk appetite in major European markets, like CAC, kept Franc pressured. Despite failing to sustain above 1.2 historical level, EUR/CHF stayed firm in tight range, close to that level.
Poor UK GDP killed May hike chance, FTSE jumped
Sterling’s selloff started the prior week after triple data misses, wage growth, CPI and retail sales. And, BoE Governor Mark Carney hinted that May rate hike was far from being certain. The Pound looked resilient for most part of last week as traders looked forward to GDP data for rescue. However, that was a big disappointment as the UK economy merely grew 0.1% qoq, much worse than expectation of 0.3% qoq and prior quarter’s 0.4% qoq. Also, that’s the weakest quarterly growth figure in five years.
Q1 GDP data was like the final straw that closed the case for a May hike. According to a Bloomberg survey, investors are now seeing only 20% chance of a May hike, comparing to around 90% earlier in April. But of course, that won’t be the end of the story. As Carney said before, the policy makers are “conscious that there are other meetings” that they could act this year. And the Q1 slowdown could be a result of bad weather only, like Chancellor of the Exchequer Philip Hammond blamed. The upcoming data including PMIs this will show how well the economy rebounds in Q2.
Just like CAC, FTSE surged strongly last week, in particular on Friday on relieve that BoE won’t be ready to hike soon. And depreciation of the Pound also helped. Now with 61.8% retracement of 7792.56 to 6866.93 at 7438.96 firmly taken out, further rise should be seen to historical high at 7792.56.
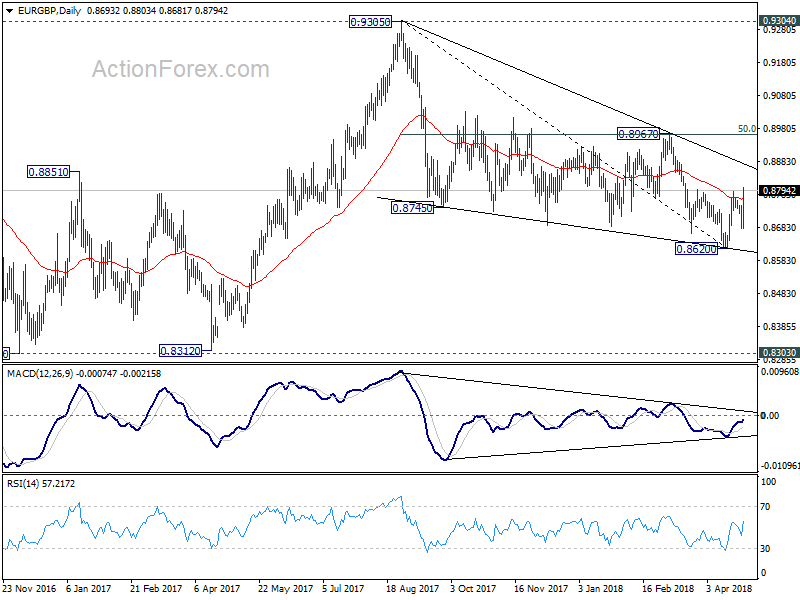
One more point to note is that EUR/GBP’s case of bullish reversal was saved by poor UK GDP. And the rebound from 0.8620 is still on course to 0.8967 resistance in near term. Given the interactive nature of the currency markets, performance of EUR/GBP would have an impact on Euro elsewhere.
TNX hesitated ahead of key long term resistance at 3.036
Now, back to the US… TNX reached as high as 3.035 last week but closed at 2.957 only. We’d like to repeat that 2013 high at 3.036 represents the start of the most important resistance zone. It’s also close to multi-decade channel resistance. Decisive break of which will complete a long term double bottom 1.394 (2012), 1.336 (2016), on bullish convergence condition in monthly MACD. That would also mark the end of the era of persistently falling US benchmark yield. So, given the importance of the level, it’s natural for TNX to have some hesitation.
From near term point of view, 3.035 now looks like a short term top after the exhausting gap up on Wednesday and the gap down on Thursday. And if that’s the case, then rise 2.033 could have completed a five wave impulsive sequence with rise from 2.717 as the fifth. That is, we could seen some consolidation with TNX gyrating down to 2.7/8 zone before having another attempt on the key 3.036 resistance. We’ll have to see how it plays out this week given the heavy weight events from the US. Though, we’re not anticipating that yield would drag down the Dollar. But consolidation in TNX means it won’t give Dollar much boost until the consolidation finishes.
Dollar index’s rise from 88.25 yet to prove it’s impulsive
Last week’s sharp rally in Dollar index built up the case of medium term reversal. Medium term trend line resistance was firmly taken out, so was 91.01 support turned resistance. There is bullish convergence condition in weekly MACD. And Dollar index was supported by 50% retracement of 72.69 to 103.82 at 88.25. The ingredients are in place.
However, there is one more thing needed. Rise from 88.25 has to show that it’s impulsive in nature. For now, it’s not proven yet, maybe because of timing. DXY reached as high as 91.98, hitting 100% projection of 88.25 to 90.29 from 89.22 at 91.90. But it failed to stay above this level and closed down at 91.54. Sustained break of 91.90, and better, hitting 61.8% projection at 93.55 will give us much more confidence that it’s a medium term bullish reversal. However, rejection from 91.90 will make the rebound from 88.25 corrective, and thus dampen the bullish case. The coming week, with heavy weight US events, and interaction with Euro, will hold the key.
EUR/USD Weekly Outlook
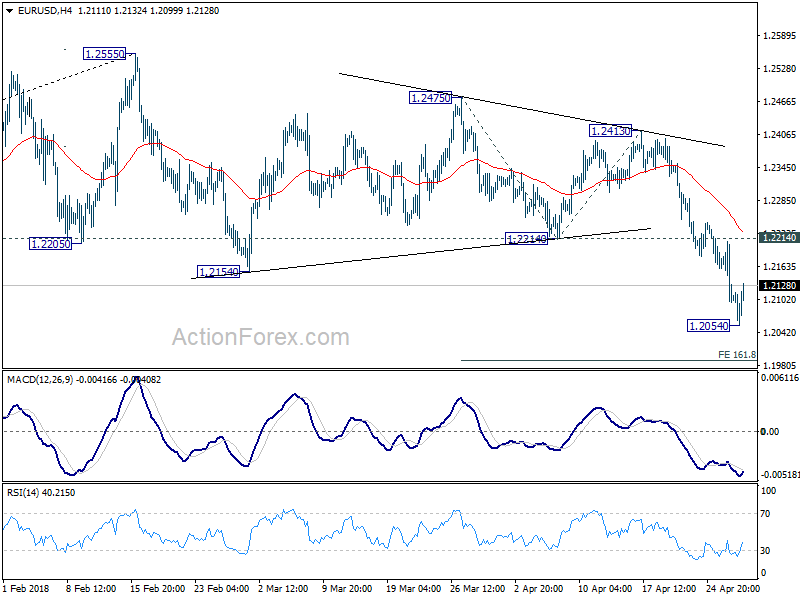
EUR/USD’s dropped sharply to 1.2054 last week. The strong break of 1.2154 key support confirmed medium term topping at 1.2555. But as a temporary low as formed at 1.2054, initial bias is neutral this week for some consolidations first. Upside of recovery should be limited by 1.2214 support turned resistance to bring another decline. Below 1.2054 will target 161.8% projection of 1.2475 to 1.2214 from 1.2413 at 1.1991 first. Break will target 200% projection at 1.1891.
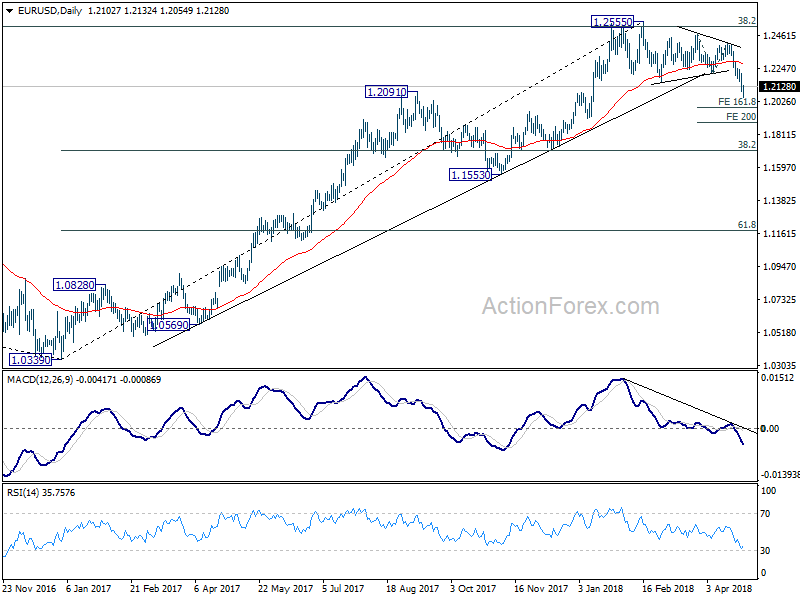
In the bigger picture, current decline and firm break of 1.2154 support confirms rejection by 38.2% retracement of 1.6039 (2008 high) to 1.0339 (2017 low) at 1.2516. A medium term top should be in place at 1.2555 and deeper decline would be seen back to 38.2% retracement of 1.0339 to 1.2555 at 1.1708 first. We’ll look at the structure and momentum of such decline before decision if it’s an impulsive or corrective move.
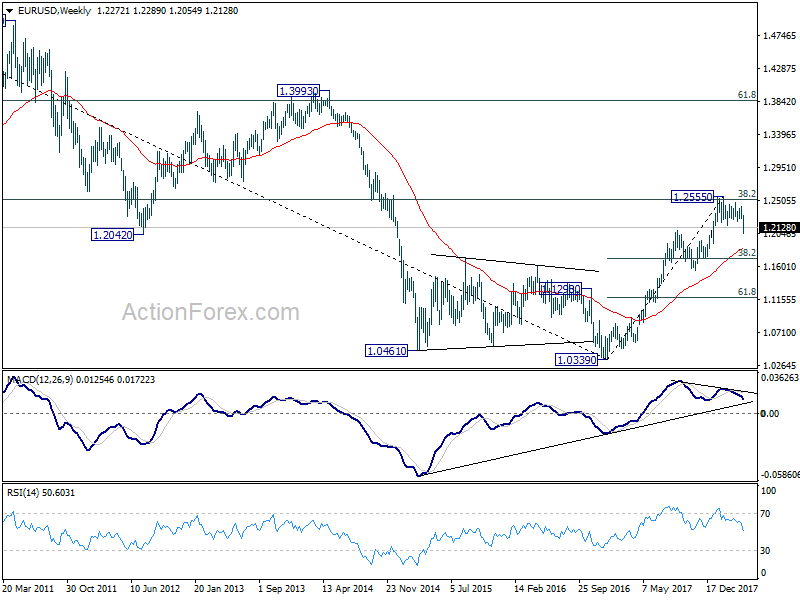
In the long term picture, 1.0339 is seen as an important bottom as the down trend from 1.6039 (2008 high) could have completed. It’s still early to decide whether price action from 1.0339 is developing into a corrective or impulsive pattern. Reaction to 38.2% retracement of 1.6039 to 1.0339 at 1.2516 will give important clue to the underlying momentum.


