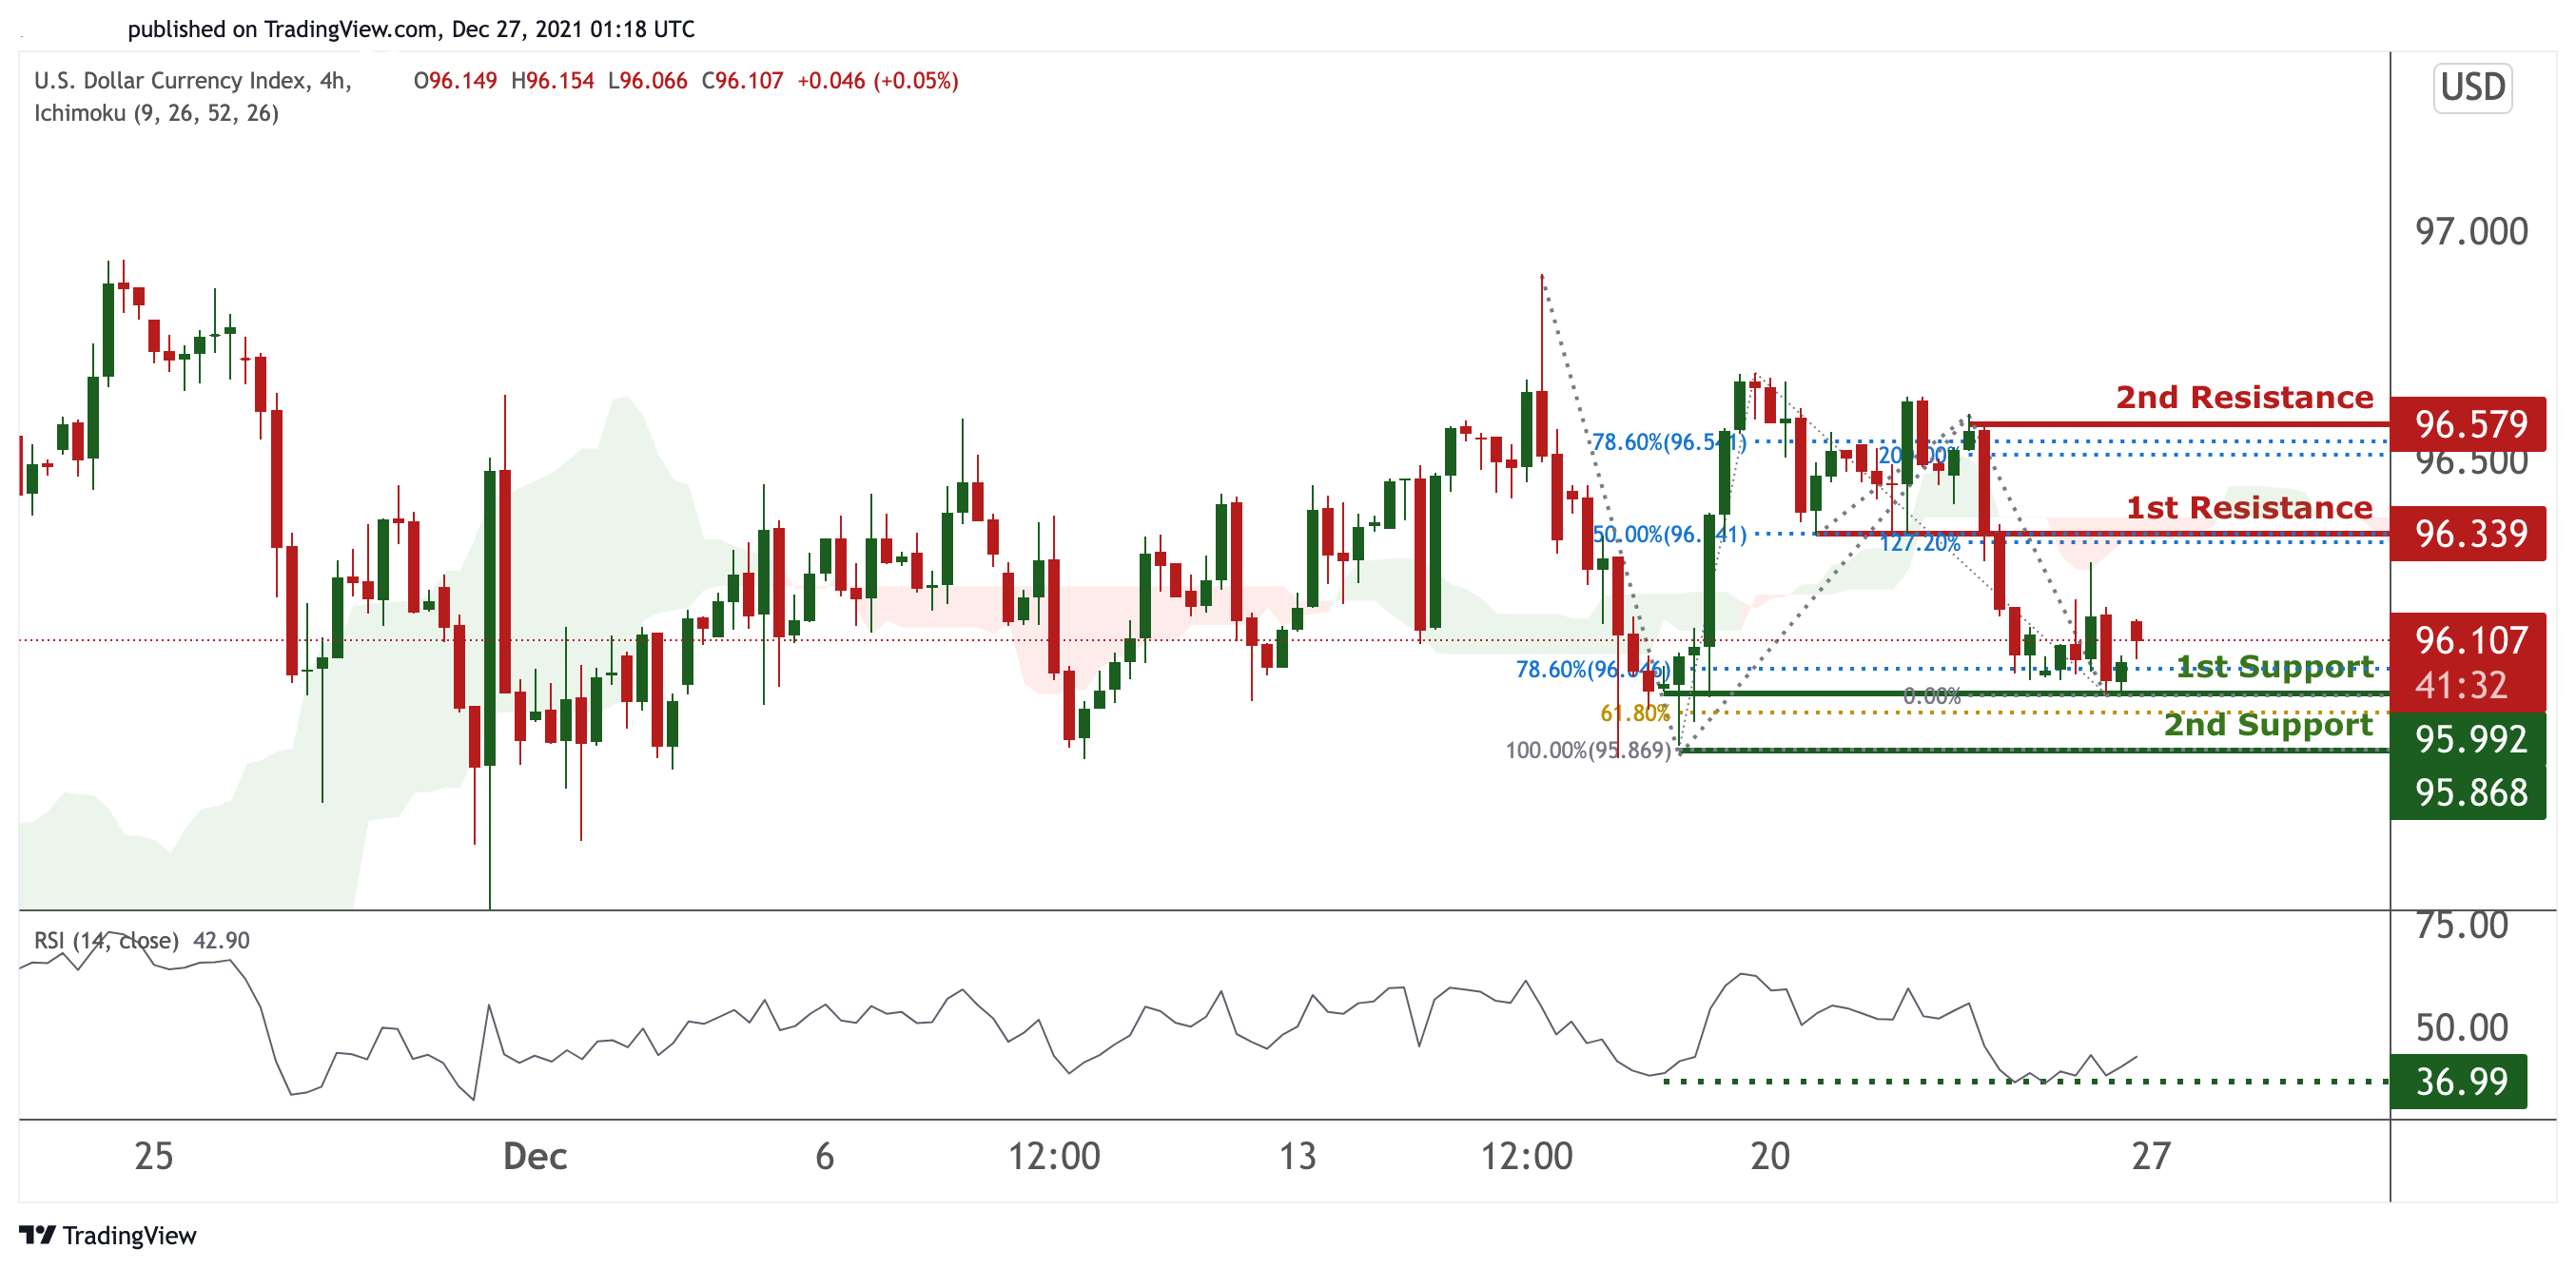
DXY:
On the H4 timeframe, prices have reached a pivot which is a graphical swing low. We would expect a bounce from our 1st support at 95.992 in line with 78.6% Fibonacci retracement towards our 1st resistance at 96.339 in line with 127.2% Fibonacci extension and 50% Fibonacci retracement. RSI is at a level where bounces previously occurred and also ichimoku clouds are showing bullish momentum.
Areas of consideration:
- H4 time frame, 1st resistance at 96.339
- H4 time frame, 1st support at 95.992
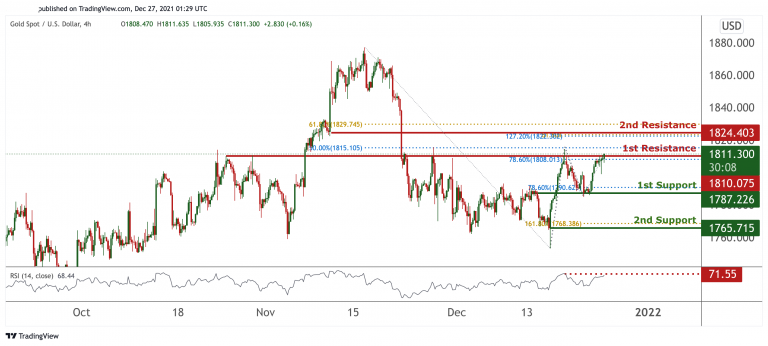
XAU/USD (GOLD):
On the H4 chart, prices are at a graphical strong overlap resistance. We see potential for prices to dip from our 1st resistance at 1810.075 in line with 78.6% Fibonacci extension and 50% Fibonacci retracement towards our 1st support at 1787.226 in line with 78.6% Fibonacci retracement. RSI is at a level where dips previously occurred. Alternatively, breaking our 1st resistance will find prices climbing further towards our 2nd resistance at 1824.403 in line with 127.2% and 61.8% Fibonacci extension and 61.8% Fibonacci retracement.
Areas of consideration:
- 4h 1st support at 1787.226
- 4h 1st resistance at 1810.075
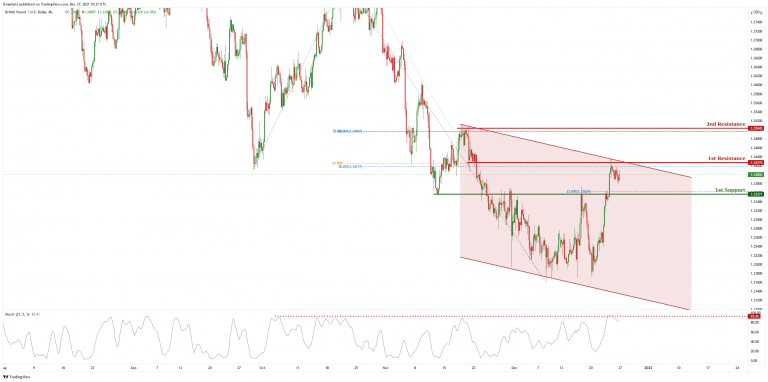
GBP/USD
On the H4 chart, price is trading in a descending channel and near 1st resistance level of 1.34726 which is also 38.2% Fibonacci retracement and 61.8% Fibonacci projection. Price can potentially dip to the 1st support level of 1.33751 which is also the graphical overlap support and 23.6% Fibonacci retracement. Our bearish bias is supported by a stochastic indicator as it is near the resistance level.
Areas of consideration :
- H4 1st resistance at 1.34276
- H4 1st support 1.33571
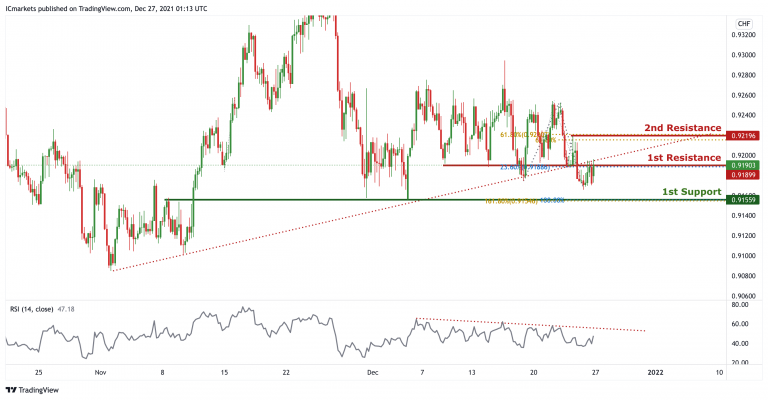
USD/CHF
On the H4 timeframe, price broke out of the ascending trendline support, signifying potential bearish momentum. We can expect price to drop from 1st Resistance in line with 23.6% fibonacci retracement and graphical overlap resistance towards 1st Support in line with graphical overlap support, 100% Fibonacci projection and 161.8% Fibonacci extension. Our bearish bias is further supported by the RSI indicator abiding to the descending trendline resistance.
Areas of consideration:
- Watch 1st Support at 0.91559
- Watch 1st Resistance at 0.91899
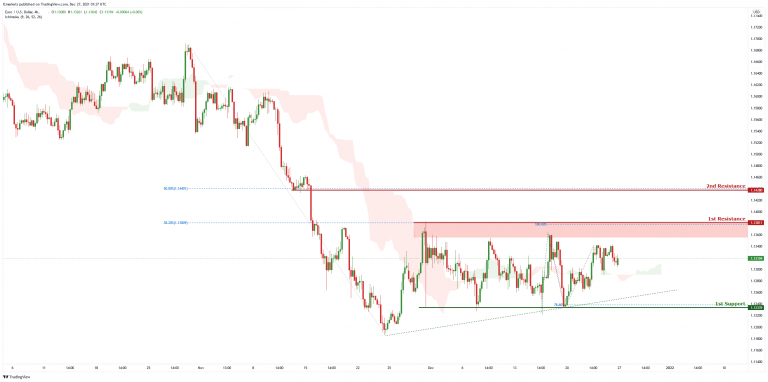
EUR/USD :
On the H4 chart, price is abiding by the ascending trendline and near the first resistance level of 1.13811 which is also 100% Fibonacci projection and 38.2% Fibonacci retracement. Price can potentially dip to the 1st support level of 1.12339 which is also 78.6% Fibonacci projection. Our bearish bias is supported by the ichimoku cloud indicator as price is trading under the cloud
Areas of consideration :
- H4 1st resistance at 1.13811
- H4 1st support at 1.12339
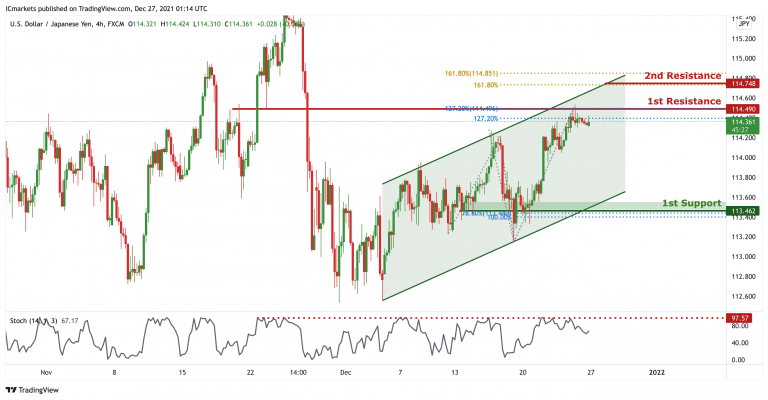
USD/JPY:
On the H4 timeframe, price is abiding to the ascending channel, showing an overall bullish momentum. However, we can expect a short term bearish momentum and drop from 1st resistance in line with previous high ,127.2% Fibonacci projection and 127.2% Fibonacci retracement towards 1st Support in line with horizontal support, 100% Fibonacci projection and 78.6% Fibonacci retracement. Our bearish bias is further supported by stochastic where the %K line dropped from the resistance.
Areas of consideration:
- H4 1st resistance level 114.490
- H4 1st support level 113.462
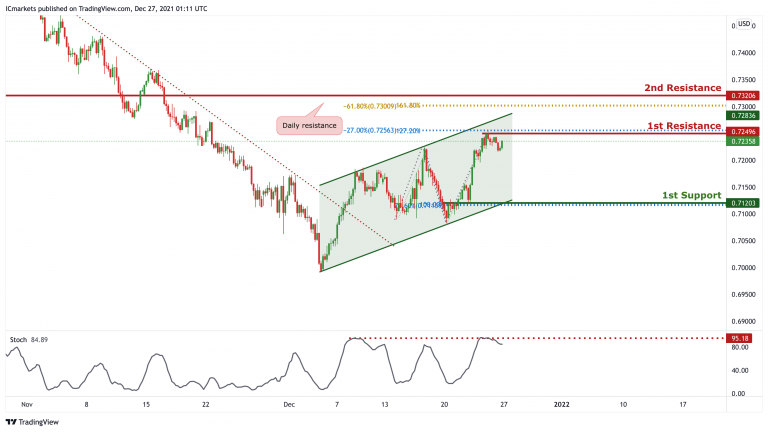
AUD/USD:
On the H4, price is reacting in an ascending channel, signifying bullish momentum. However, price is currently at a resistance, we can expect price to drop from 1st Resistance in line with 127.2% Fibonacci projection and -27.2% Fibonacci Extension towards 1st Support in line with 100% Fibonacci projection and 78.6% Fibonacci retracement. Our short-term bearish bias is further supported by the stochastic indicator where the %K line is at the resistance level. Areas of consideration:
- H4 1st Support level 0.71203
- H4 1st resistance level 0.72496
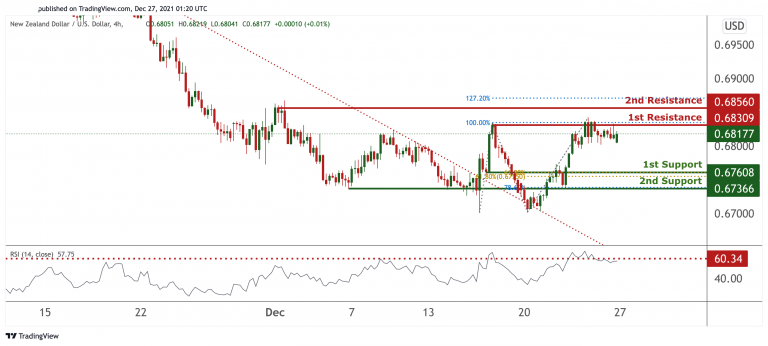
NZD/USD:
On the H4 timeframe, prices are at a graphical swing high and are experiencing a squeeze. We see potential for prices to dip from our 1st resistance at 0.68309 in line with 100% Fibonacci extension towards our 1st support at 0.67608 which is an area of Fibonacci confluences. RSI at a level where dips usually occur. If prices break our 1st resistance, we can potentially find prices climbing higher towards our 2nd resistance at 0.68560 in line with 127.2% Fibonacci extension.
Areas of consideration:
- H4 time frame, 1st resistance at 0.68309
- H4 time frame, 1st support at 0.67609
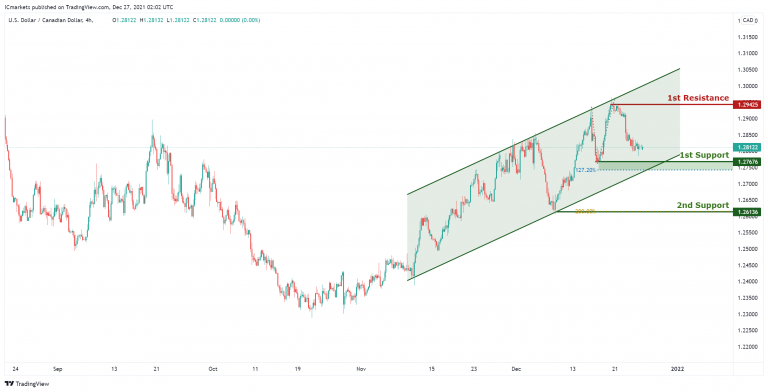
USD/CAD:
On the H4 timeframe,with price moving in the ascending channel, we have a bullish bias that price will rise from 1st support at 1.27676 in line with the graphical swing low support and 127.2% Fibonacci extension to 1st resistance at 1.29425 in line with the graphical swing high resistance. Alternatively, we may see price break 1st support and head for 2nd support at 1.26136 in line with the horizontal swing low support and 200% Fibonacci projection.
Areas of consideration:
- H4 time frame, support at 1.27676
- H4 time frame, resistance at 1.29425
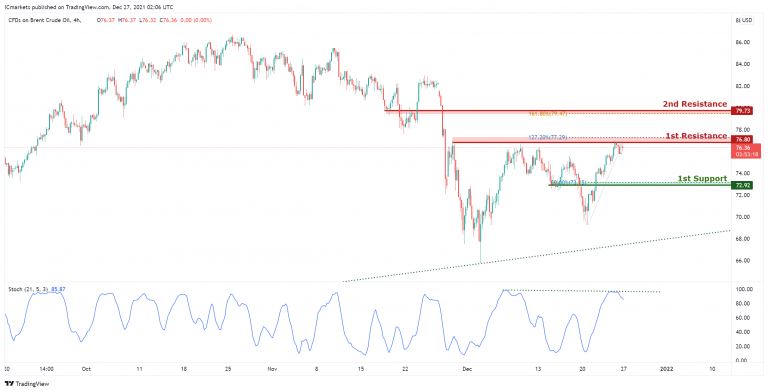
OIL:
On the H4 timeframe,with price approaching the resistance of the stochastics indicator, we have a bearish bias that price will drop to 1st support at 74.92 in line with the graphical overlap support and 50% Fibonacci retracement from 1st resistance at 76.80 in line with the 127.2% Fibonacci projection and graphical swing high resistance. Alternatively, we may see price break 1st resistance and head for 2nd resistance at 79.73 in line with the horizontal swing high resistance and 161.8% Fibonaccai extension.
Areas of consideration:
- H4 time frame, 1st resistance of 80
- H4 time frame, 1st support of 92
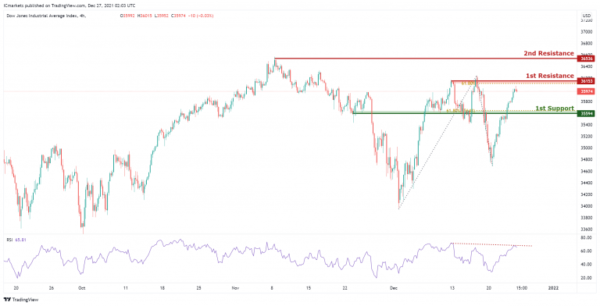
Dow Jones Industrial Average:
On the H4 timeframe,with price approaching the resistance of the stochastics indicator, we have a bearish bias that price will drop to 1st support at 35594 in line with the graphical overlap support and 61.8% Fibonacci retracement from 1st resistance at 36153 in line with the 61.8% Fibonacci retracement and graphical swing high resistance. Alternatively, we may see price break 1st resistance and head for 2nd resistance at 36536 in line with the horizontal swing high resistance.
Area of consideration:
- 4H resistance at 36153
- 4H support at 35594