

Live Comments
China Inflation Misses at 0.5% in July as Goods Prices Weaken, Services Hold Up
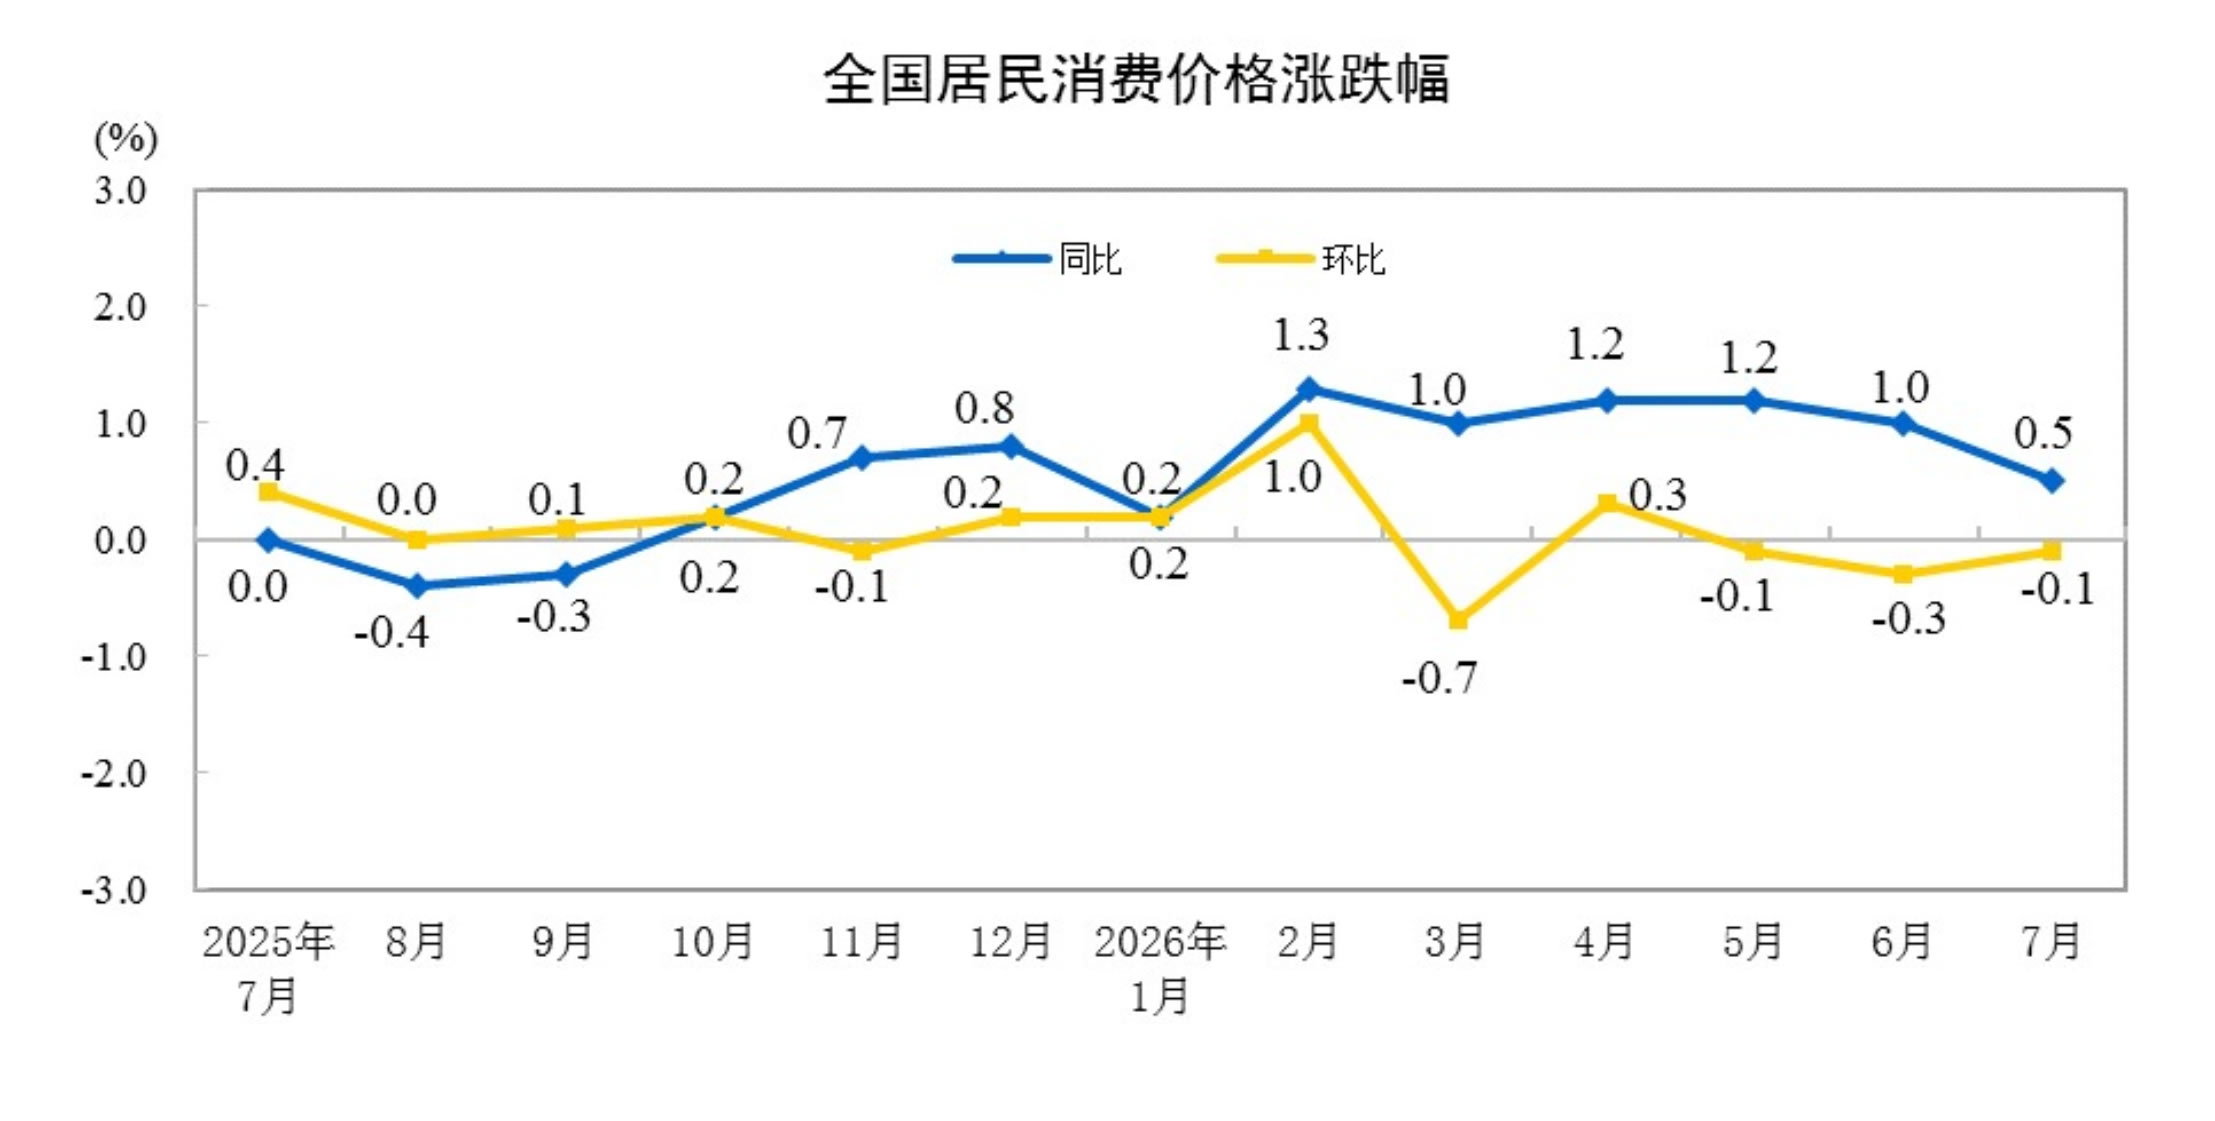
China’s consumer inflation slowed more than expected in July, but underlying breakdown was less uniformly weak than headline suggested. CPI eased from 1.0% to 0.5% y/y, below 0.8% consensus, while monthly CPI improved from -0.3% m/m to -0.1%, still missing expectations for a 0.2% increase. Food prices fell -1.5% y/y, while non-food inflation stood at 0.9%. Goods prices rose just 0.2% y/y, compared with a firmer 0.7% increase in services.
Monthly figures showed an even clearer split. Goods prices fell- 0.6% m/m, while services rose 0.4%, suggesting weakness was concentrated in merchandise rather than spreading evenly across economy. Food prices were unchanged overall, with pork rising 4.1% and fresh vegetables 1.3%, partly offset by a -3.8% drop in fresh fruit. Among non-food categories, education, culture and recreation rose 1.0%, while transportation and communication fell 2.2%.
Taken together, July data point to uneven rather than outright collapsing price pressure. Weak goods inflation and another negative monthly CPI reading still argue that domestic pricing power is limited, but resilience in services tempers a simple deflation narrative.
Alongside PPI slowing from 4.1% to 3.5% y/y, below 3.9% forecast, figures should leave Beijing room to support growth while keeping focus on whether services inflation can broaden into a more durable recovery in domestic demand.
Data Summary
| Indicator | Actual | Expected | Previous |
|---|---|---|---|
| CPI m/m | -0.1% | 0.2% | -0.3% |
| CPI y/y | 0.5% | 0.8% | 1.0% |
| PPI y/y | 3.5% | 3.9% | 4.1% |
Key Takeaways
- China CPI slowed from 1.0% to 0.5% y/y in July, undershooting 0.8% forecast, while monthly CPI improved from -0.3% to -0.1% but remained below expectations for a return to growth.
- Headline weakness was not broad-based. Goods prices rose just 0.2% y/y and fell 0.6% m/m, while services prices increased 0.7% y/y and 0.4% m/m.
- Food prices fell 1.5% y/y, although monthly food prices were unchanged. Pork prices rebounded 4.1% m/m, while fresh fruit prices dropped 3.8%.
- PPI inflation slowed from 4.1% to 3.5% y/y, also below 3.9% forecast, pointing to easing upstream price pressure.
- Overall picture is one of uneven reflation rather than outright deflation: weak goods pricing and softer producer inflation contrast with firmer services prices.
- Data leave Beijing room to support growth without creating an immediate inflation constraint.
Canada Jobs Surge 75K as Unemployment Falls to Two-Year Low
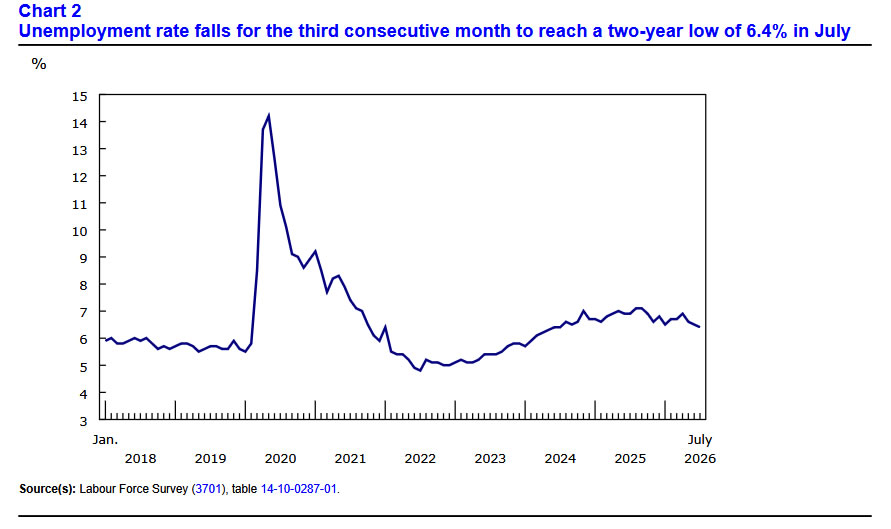
Canada's labor market delivered a strong upside surprise in July, with employment rising 75.1K, far above expectations of 17.8K and accelerating sharply from 18.2K in June. Employment rate edged up 0.1 percentage point to 60.9%, while unemployment rate unexpectedly fell from 6.5% to 6.4%, against expectations for no change. That was lowest unemployment rate since July 2024 and marked third consecutive monthly decline, with rate now down 0.5 percentage point since April.
Job gains were also spread across several important private-sector industries. Wholesale and retail trade added 21K positions, finance, insurance, real estate, rental and leasing gained 18K, professional, scientific and technical services added 17K, while construction employment increased 16K. Those gains were partly offset by declines of -15K in public administration and -9.6K in agriculture.
Wage pressures nevertheless continued to cool, with average hourly earnings growth slowing from 3.3% to 2.8% yoy.
Data Summary
| Indicator | Actual | Expected | Previous |
|---|---|---|---|
| Employment Change | +75.1K | +17.8K | +18.2K |
| Unemployment Rate | 6.4% | 6.5% | 6.5% |
| Employment Rate | 60.9% | — | 60.8% |
| Average Hourly Wages y/y | +2.8% | — | +3.3% |
Key Takeaways
- Canada added 75.1K jobs in July, more than four times expectations of 17.8K and sharply above June's 18.2K increase.
- Unemployment rate fell from 6.5% to 6.4%, reaching lowest level since July 2024. It has now declined for three consecutive months and by 0.5 percentage point since April.
- Employment rate increased from 60.8% to 60.9%, reinforcing strength of headline employment gain.
- Job creation was relatively broad, led by wholesale and retail trade (+21K), finance and real estate-related industries (+18K), professional and technical services (+17K), and construction (+16K).
- Public administration shed 15K jobs and agriculture lost 9.6K, providing some offset to private-sector strength.
- Wage pressures continued to moderate despite stronger hiring. Average hourly wage growth slowed from 3.3% to 2.8% y/y.
US Non-Farm Payrolls Contract -23k. Revisions Expose Deeper Labor Market Weakness
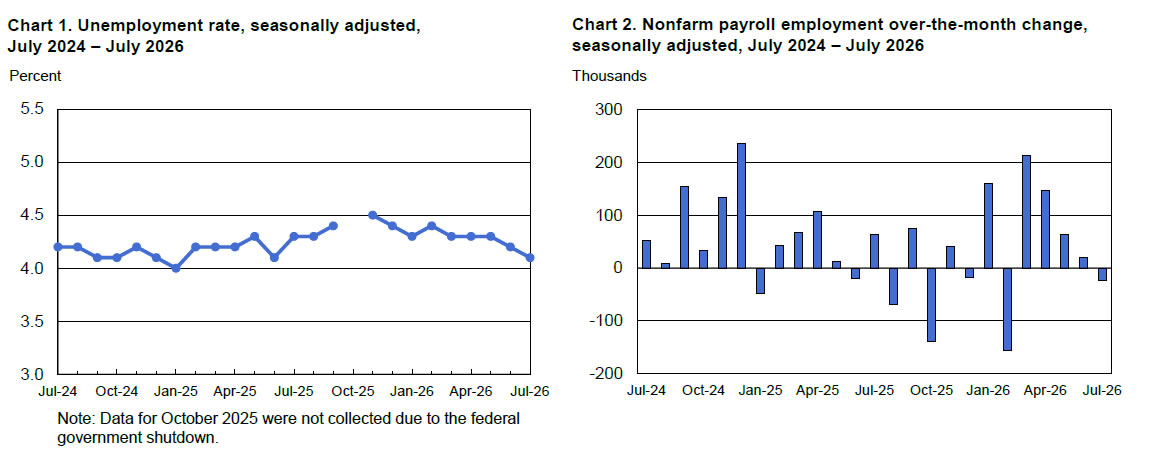
US labor market delivered a major downside surprise in July, with nonfarm payrolls falling -23K, far below expectations for an 85K increase. Weak headline was compounded by another round of substantial downward revisions: May payroll growth was cut from 129K to 63K, while June was revised from 57K to just 20K, leaving combined employment gains 103K lower than previously reported. July weakness was concentrated in local government education and retail trade, while health-care employment continued to trend higher. Taken together, latest figures suggest deterioration in hiring is considerably more pronounced than earlier estimates indicated.
Other parts of report were mixed, but did little to offset payroll disappointment. Unemployment rate unexpectedly fell from 4.2% to 4.1%, versus expectations for no change. But decline came alongside another drop in labor force participation from 61.5% to 61.4%. Participation has now fallen 0.7 percentage point since January, while employment-population ratio has declined 0.5 point over same period.
Meanwhile, average hourly earnings growth slowed sharply from 0.3% to 0.1% mom, missing expectations of 0.3%. Combination of weaker hiring, declining participation and softer wage growth paints a considerably less reassuring picture than lower unemployment rate alone would suggest.
Report should substantially raise hurdle for Fed to hike rates in September. This week's employment indicators had already sent conflicting signals, with weak ADP hiring and contracting ISM Services Employment offset by stronger manufacturing employment and historically low jobless claims. NFP now tilts balance decisively toward labor-market weakness, while softer wage growth reduces one source of inflation concern.
Data Summary
| Indicator | Actual | Expected | Previous |
|---|---|---|---|
| Nonfarm Payrolls | -23K | +85K | +20K |
| Unemployment Rate | 4.1% | 4.2% | 4.2% |
| Average Hourly Earnings m/m | +0.1% | +0.3% | +0.3% |
| Labor Force Participation Rate | 61.4% | — | 61.5% |
| May–June Combined Revision | -103K | — | — |
Key Takeaways
- Nonfarm payrolls unexpectedly fell 23K in July, badly missing expectations for an 85K increase and marking outright employment contraction.
- Weakness extended well beyond July. May was revised down from +129K to +63K and June from +57K to +20K, cutting previously reported employment growth by 103K combined.
- Unemployment rate unexpectedly fell from 4.2% to 4.1%, but this was accompanied by a decline in labor force participation from 61.5% to 61.4%.
- Labor force participation has now fallen 0.7 percentage point since January, while employment-population ratio has declined 0.5 point, making lower unemployment rate less reassuring.
- Average hourly earnings slowed from 0.3% to 0.1% mom, well below expectations of 0.3%, adding evidence that labor-related inflation pressure is easing.
- Employment declined in local government education and retail trade, while health-care employment continued to trend higher.
- Report significantly raises hurdle for a September Fed hike. Negative payroll growth, large downward revisions and softer wages challenge hawkish argument that labor market remains strong enough to comfortably absorb further tightening.