

Live Comments
Canada CPI Accelerates to 3% as Energy Shock Meets Firmer Core Inflation
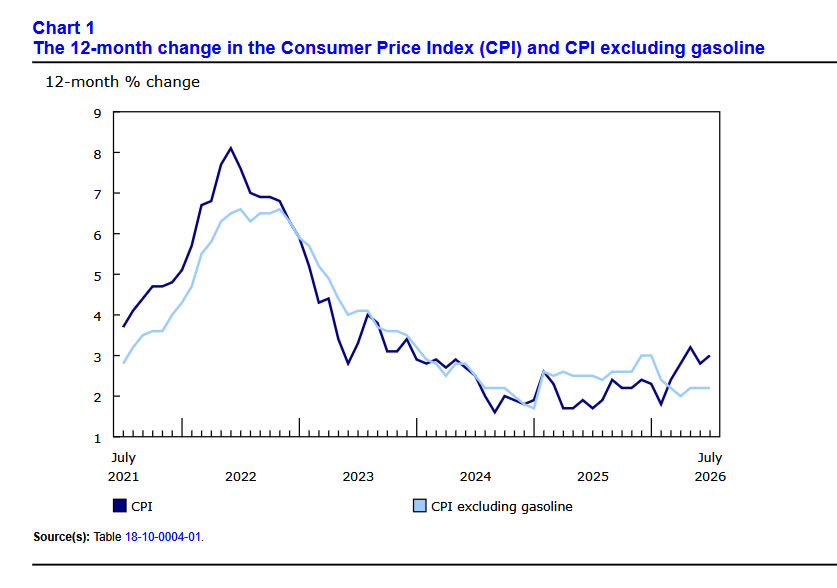
Canada inflation accelerated more than expected in July, with headline CPI rising from 2.8% to 3.0% y/y, above 2.9% consensus. Monthly CPI swung from -0.4% m/m to +0.5%, also stronger than 0.4% expected.
Gasoline was major driver, with annual price growth accelerating from 20.5% to 25.7% as Middle East conflict, Strait of Hormuz blockade and partial closure of Red Sea shipping routes pushed energy costs higher. Travel tours also contributed, while slower grocery inflation provided some offset.
Importantly, July report was not purely an energy story. CPI excluding gasoline held at 2.2% y/y for third consecutive month, while BoC core gauges all edged higher. Median CPI rose from 1.9% to 2.0%, matching expectations; Trimmed CPI increased from 1.8% to 1.9%, above 1.8% forecast; and Common CPI climbed from 2.6% to 2.7%, compared with 2.5% expected. That combination suggests underlying inflation pressure firmed even as gasoline accounted for much of headline acceleration.
Energy-driven headline inflation alone could potentially be looked through by the BoC, but simultaneous acceleration across core measures makes report harder to dismiss as temporary oil noise. Key question now is whether higher energy costs begin feeding more broadly into underlying prices, or whether softer domestic demand keeps second-round effects contained and allows BoC to maintain extended hold.
Data Summary
| Indicator | Actual | Expected | Previous |
|---|---|---|---|
| CPI y/y | 3.0% | 2.9% | 2.8% |
| CPI m/m | 0.5% | 0.4% | -0.4% |
| CPI ex-Gasoline y/y | 2.2% | — | 2.2% |
| CPI Median y/y | 2.0% | 2.0% | 1.9% |
| CPI Trimmed y/y | 1.9% | 1.8% | 1.8% |
| CPI Common y/y | 2.7% | 2.5% | 2.6% |
| Gasoline y/y | 25.7% | — | 20.5% |
Key Takeaways
- Canada headline CPI accelerated from 2.8% to 3.0% y/y, above 2.9% consensus, while monthly CPI rebounded from -0.4% to +0.5%.
- Gasoline was major driver, with annual price growth accelerating from 20.5% to 25.7% amid Middle East conflict, Strait of Hormuz blockade and partial closure of Red Sea shipping routes.
- Travel tours also contributed to faster headline inflation, while slower growth in grocery prices provided some offset.
- Inflation was not purely an energy story. CPI excluding gasoline held at 2.2% for third straight month.
- BoC’s core gauges all firmed: Median rose from 1.9% to 2.0%, Trimmed from 1.8% to 1.9%, and Common from 2.6% to 2.7%.
- Trimmed and Common CPI both exceeded expectations, making July report more hawkish than headline gasoline surge alone would suggest.
China’s Supply-Demand Divide Widens as Investment Slumps and Retail Sales Stall
China’s July activity data reinforced widening split between resilient production and weak domestic demand, with all three major readings undershooting expectations. Industrial production slowed from 5.3% to 4.5% y/y, below 4.8% consensus. Manufacturing nevertheless continued to provide support, particularly equipment manufacturing and high-tech manufacturing, which grew 9.7% and 13.8% y/y respectively over first seven months.
Consumption disappointed more clearly. Retail sales growth slowed from 1.0% to just 0.6% y/y in July, well below expectations for 1.6%. Sales rose only 0.06% m/m, while consumer-goods retail sales increased just 1.2% over first seven months. Services consumption performed better, with retail sales of services up 5.0%, but overall household spending remains too weak to provide a convincing domestic growth engine.
Investment delivered biggest downside surprise. Fixed-asset investment deteriorated from -5.7% to -6.7% y/y year-to-date, weaker than -6.0% expected. Real-estate development investment plunged -19.2%, but weakness extended well beyond property: infrastructure investment fell -3.6%, manufacturing investment declined -1.7%, and private investment dropped -9.4%. High-tech investment, up 5.0%, remained one of few pockets of strength.
Taken together, simultaneous misses in production, consumption and investment sharpen China’s central macro imbalance rather than simply pointing to a broad slowdown. Supply-side activity is still holding up better than domestic demand, while investment weakness is spreading beyond property. NBS itself acknowledged that imbalance between strong supply and weak demand remains acute, keeping pressure on policymakers to support household spending and private-sector activity more forcefully.
Data Summary
| Indicator | Actual | Expected | Previous |
|---|---|---|---|
| Industrial Production y/y | 4.5% | 4.8% | 5.3% |
| Equipment Manufacturing YTD y/y | 9.7% | — | — |
| High-Tech Manufacturing YTD y/y | 13.8% | — | — |
| Manufacturing PMI | 49.2 | — | — |
| Retail Sales y/y | 0.6% | 1.6% | 1.0% |
| Retail Sales m/m | 0.06% | — | — |
| Consumer Goods Retail Sales YTD y/y | 1.2% | — | — |
| Services Retail Sales YTD y/y | 5.0% | — | — |
| Fixed Asset Investment YTD y/y | -6.7% | -6.0% | -5.7% |
| FAI ex-Real Estate YTD y/y | -3.7% | — | — |
| Real Estate Development Investment YTD y/y | -19.2% | — | — |
| Infrastructure Investment YTD y/y | -3.6% | — | — |
| Manufacturing Investment YTD y/y | -1.7% | — | — |
| Private Investment YTD y/y | -9.4% | — | — |
| High-Tech Industry Investment YTD y/y | 5.0% | — | — |
Key Takeaways
- All three major activity indicators missed expectations, reinforcing evidence that China’s July momentum weakened more than markets anticipated.
- Industrial production slowed from 5.3% to 4.5% y/y, but still held up better than domestic-demand indicators.
- Retail sales growth weakened from 1.0% to just 0.6% y/y, far below 1.6% consensus, highlighting persistent consumer caution.
- Fixed asset investment deteriorated from -5.7% to -6.7% y/y YTD, versus -6.0% expected, with weakness extending beyond property into infrastructure, manufacturing and private investment.
- Real-estate development investment fell -19.2% y/y in first seven months, while private investment declined -9.4%, underscoring continued weakness in traditional domestic growth engines.
- High-tech manufacturing and investment remained relative bright spots, but they were not enough to offset broader demand weakness.
- Overall, July data strengthen “strong supply, weak demand” narrative explicitly acknowledged by NBS, keeping pressure on Beijing to do more to support consumption and private-sector investment.
Japan GDP Misses, but Export-Led Growth Keeps BoJ September Hike Alive
Japan’s economy expanded in Q2, but weaker domestic demand left growth well short of expectations. GDP rose 0.3% q/q, or 1.1% annualized, compared with 2.1% annualized growth in Q1 and consensus for around 2.0%. Result covers first full quarter incorporating impact of Iran war and higher energy costs, yet economy still avoided contraction.
Composition was considerably softer than headline growth suggested. Domestic demand fell -0.2% q/q, with private consumption essentially flat and capital expenditure dropping -1.2%, against expectations for an increase. Private residential investment also declined -0.5%. Weak consumption is particularly relevant for BoJ, which is watching whether wage gains are translating into sustained household demand and domestically generated inflation.
External sector did most of heavy lifting. Net exports added 0.5 percentage point to quarterly growth, as exports rose 0.5% while imports fell -1.5%. Solid US demand for Japanese hybrid vehicles and continued global AI investment supported shipments of semiconductor-related equipment and components. Government consumption also rose 1.6%, while some weakness in private consumption may have reflected one-off shifts toward public spending, including education-related measures.
Flat consumption and falling business investment argue against describing domestic economy as strongly accelerating, but positive headline growth and resilient exports leave BoJ normalization case intact if policymakers view Q2 drags as temporary. Bigger question is whether higher energy and import costs begin squeezing households more visibly in Q3, weakening demand just as BoJ considers faster pace toward tighter policy.
Data Summary
| Indicator | Actual | Expected | Previous |
|---|---|---|---|
| GDP q/q | 0.3% | 0.5% | 0.5% |
| GDP annualized | 1.1% | 2.0% | 1.9% |
| Domestic Demand q/q | -0.2% | — | 0.2% |
| Private Consumption q/q | -0.0% | 0.5% | 0.5% |
| Private Non-Residential Investment q/q | -1.2% | 0.4% | -1.0% |
| Private Residential Investment q/q | -0.5% | — | 0.9% |
| Government Consumption q/q | 1.6% | — | 0.4% |
| Exports q/q | 0.5% | — | 1.7% |
| Imports q/q | -1.5% | — | 0.3% |
| Net Exports Contribution | +0.5ppt | — | +0.3ppt |
Key Takeaways
- Japan GDP grew 0.3% q/q in Q2, equivalent to 1.1% annualized, undershooting expectations for 0.5% q/q and 2.0% annualized growth.
- Domestic demand contracted 0.2%, making composition notably weaker than positive headline GDP suggests.
- Private consumption stalled after 0.5% growth in Q1, an important weak point as BoJ looks for a durable wage-consumption-inflation cycle.
- Business investment fell 1.2%, substantially weaker than expectations for a 0.4% increase, while residential investment also declined.
- External demand kept economy growing, contributing 0.5 percentage point as exports rose 0.5% and imports fell 1.5%.
- Government consumption accelerated from 0.4% to 1.6%, providing another offset to weak private demand.
- Report complicates rather than overturns September BoJ hike case. Domestic momentum is soft, but positive growth and resilient exports leave normalization path intact if policymakers see Q2 drags as temporary.
- Q3 focus shifts to whether higher energy and import costs squeeze household spending, particularly as some Q2 durable-goods demand may have been temporarily boosted.