

Live Comments
U.S. Jobless Claims Fall to 206K, but Continuing Claims Rise
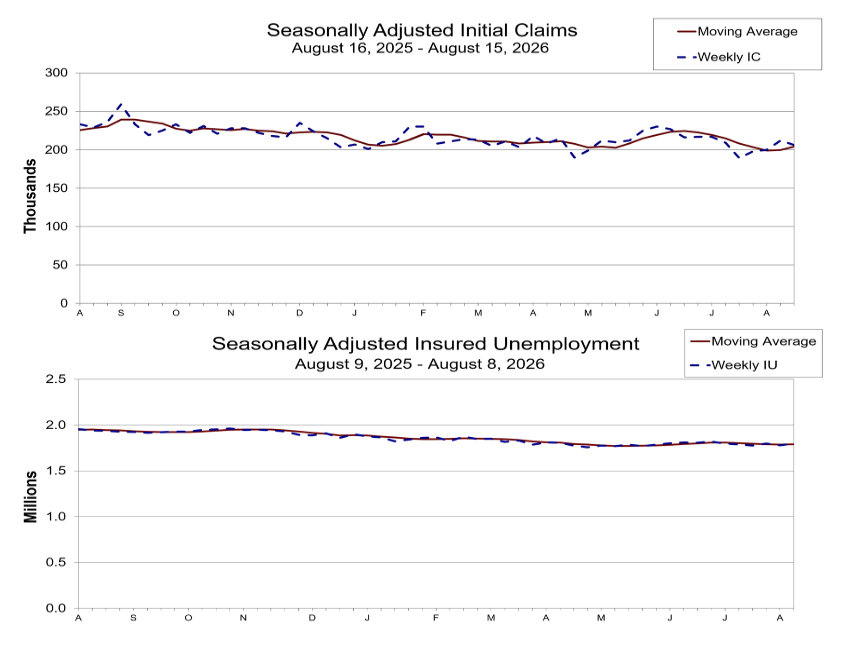
U.S. initial jobless claims fell 6,000 to 206,000 in the week ended August 15, below market expectations for 210,000 and pointing to continued stability in labor-market conditions. However, the previous week's figure was revised up to 212,000 from 209,000, meaning the latest decline partly reflects a higher starting point. The four-week moving average, which smooths weekly volatility, increased to 204,000 from a revised 199,750.
The broader picture is less reassuring than the headline decline suggests. Continuing claims rose 18,000 to 1.799 million in the week ended August 8, while the four-week average increased to 1.789 million. The insured unemployment rate was unchanged at 1.2%. Rising continuing claims indicate that workers who have lost jobs may be taking longer to return to employment, even as the flow of new claims remains relatively low.
Data Summary
| Indicator | Latest | Previous | Consensus |
|---|---|---|---|
| Initial Jobless Claims | 206K | 212K | 210K |
| 4-Week Moving Average | 204K | 199.75K | — |
| Continuing Claims | 1.799M | 1.781M | — |
| 4-Week Avg. Continuing Claims | 1.789M | 1.7865M | — |
| Insured Unemployment Rate | 1.2% | 1.2% | — |
Key Takeaways
- Initial claims fell to 206K, beating expectations for 210K and suggesting layoffs remain contained.
- Previous week's claims were revised higher to 212K, from 209K, reducing the strength of the latest decline.
- Four-week average rose to 204K, pointing to some softening in the underlying trend despite the weekly fall.
- Continuing claims increased 18K to 1.799M, suggesting unemployed workers are taking somewhat longer to find new jobs.
- Labor market is cooling gradually rather than deteriorating sharply. Low initial claims argue against an abrupt downturn, while rising continuing claims provide evidence of weaker labor-market momentum.
Full US jobless claims release here.
Australia Jobs Fall -15.8K as Unemployment Hits 4.5%, Giving RBA More Evidence of Slowdown
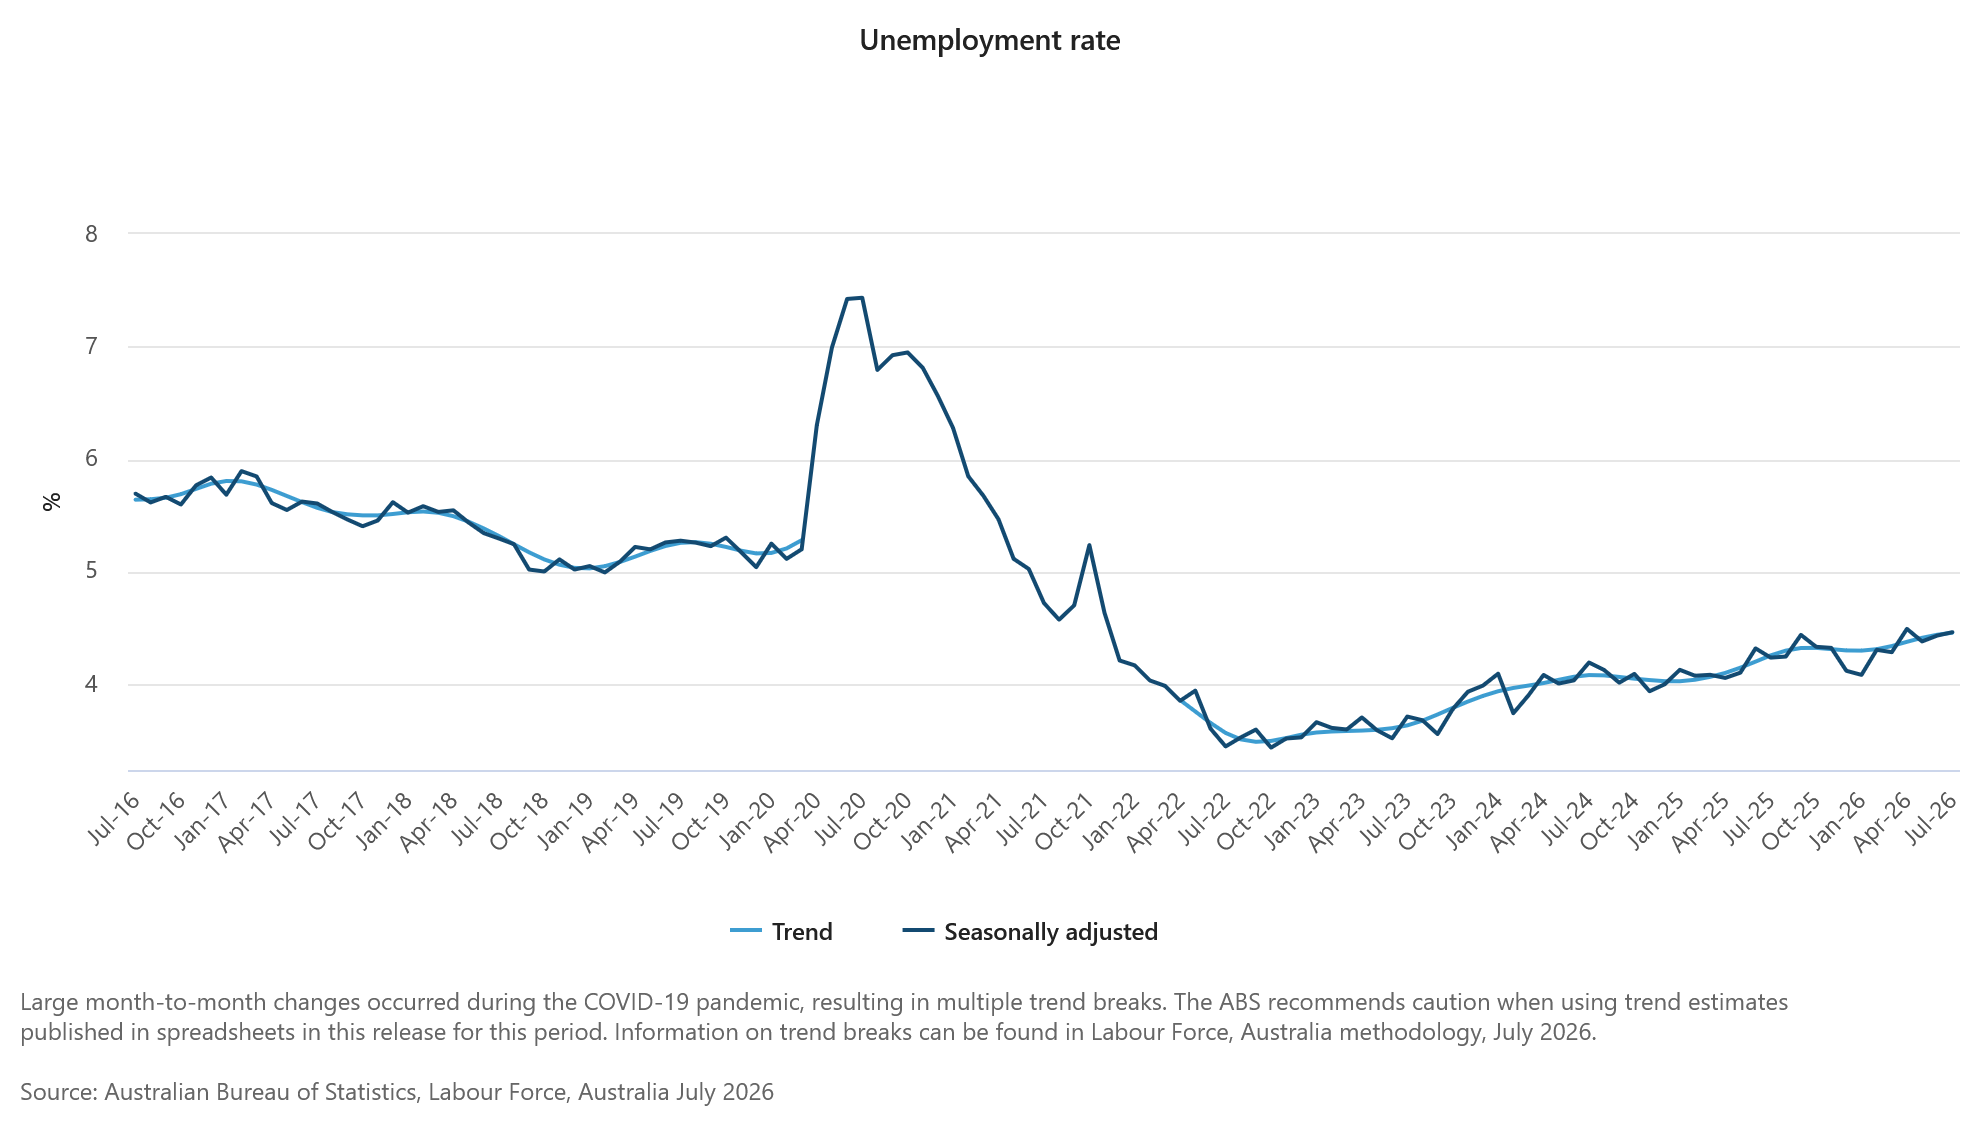
Australia’s labor market softened noticeably in July, with employment falling -15.8K after a revised 80.2K increase in June, missing expectations for an 11.4K gain. Unemployment rate rose from 4.4% to 4.5%, above 4.4% forecast. Weakness extended beyond headline: participation rate slipped from 67.0% to 66.9%, while employment-to-population ratio fell from 64.0% to 63.9%.
Hours worked reinforced cooling signal, dropping -0.6% m/m, or 12 million hours, from 2.010bn to 1.998bn. Employment losses were concentrated among males, down -11K, while female employment fell -5K. Female full-time employment actually rose 17K, but this was outweighed by a 22K decline in part-time positions. Underemployment rate held at 6.4%, suggesting labor-market deterioration is still measured rather than broad-based.
For RBA, report provides fresh evidence that tighter financial conditions are slowing employment after Deputy Governor Andrew Hauser said Wednesday Bank had already seen “a bit of a slowdown in consumption and employment growth, but needs to see more still.” July delivers more of that evidence, with employment, participation and hours worked all weakening together. It does not eliminate tightening risk while inflation and energy costs remain elevated, but it reduces urgency for another near-term hike and raises importance of upcoming inflation data in determining whether RBA’s hawkish bias survives.
Data Summary
| Indicator | Actual | Expected | Previous |
|---|---|---|---|
| Employment Change | -15.8K | +11.4K | +80.2K |
| Unemployment Rate | 4.5% | 4.4% | 4.4% |
| Participation Rate | 66.9% | — | 67.0% |
| Employment-to-Population Ratio | 63.9% | — | 64.0% |
| Underemployment Rate | 6.4% | — | 6.4% |
| Monthly Hours Worked | 1.998bn | — | 2.010bn |
Key Takeaways
- Australian employment fell 15.8K in July after a revised 80.2K increase in June, well below expectations for an 11.4K gain.
- Unemployment rate rose from 4.4% to 4.5%, exceeding consensus for no change.
- Weakness extended beyond headline employment, with participation rate falling from 67.0% to 66.9% and employment-to-population ratio slipping from 64.0% to 63.9%.
- Hours worked fell 12 million, or 0.6% m/m, providing another sign of softer labor utilization.
- Underemployment held at 6.4%, suggesting cooling has not yet turned into a broad deterioration.
- Male employment fell 11K, while female employment declined 5K despite a 17K increase in female full-time jobs.
- For RBA, July delivers more evidence of slowdown in employment that Deputy Governor Andrew Hauser said policymakers still needed to see.
- Report reduces urgency for another near-term hike, although inflation and oil-related upside risks mean RBA’s tightening option remains open.
Japan Exports Surge 23.2%, but Weak Yen and Oil Shock Distort the Headline
Japan’s exports accelerated to 23.2% y/y in July, beating 19.9% consensus and marking fastest growth since October 2022, as semiconductor-related demand continued to power overseas shipments. Electrical machinery exports rose 29.4%, while semiconductor-related shipments jumped 49.1% in value. Machinery exports increased 18.4%, including 40.9% growth in semiconductor manufacturing equipment, while motor vehicle exports climbed 19.5%. Geographic demand was also broad, with exports to China rising 25.8% and shipments to US up 22.0%.
But headline considerably overstates underlying growth in real export demand. Overall export volumes rose only 5.2%, indicating that weak Yen and higher selling prices accounted for much of 23.2% increase in nominal value. Autos illustrate that split particularly clearly: passenger-car export value jumped 20.8%, while unit shipments increased just 1.2%. Semiconductor machinery showed firmer underlying demand, with shipment quantities rising 36.4%, suggesting AI-related capital spending remains one of more genuine sources of export strength.
Imports delivered another distortion in opposite direction. Import growth accelerated to 27.8% y/y, above 26.5% expected and strongest since November 2022, outpacing exports and widening trade deficit from JPY 156.3bn a year earlier to JPY 634.5bn. Iran conflict and resulting oil-price surge played a major role, with petroleum imports jumping 87.8% in value. For an economy heavily dependent on imported energy, stronger oil prices quickly translate into a larger import bill even when overseas demand for Japanese goods is performing well.
July report therefore gives a more nuanced picture than export headline alone suggests. External sector remains an important support for growth, following its strong contribution to Q2 GDP, while AI-related demand is providing a clear lift to Japan’s industrial exporters. Yet only a fraction of nominal export surge came from higher volumes, and much stronger energy imports overwhelmed export gains at trade-balance level. Japan is benefiting from weak Yen and global technology demand on one side, while paying increasingly expensive bill for imported energy on other.
Data Summary
| Indicator | Actual | Expected |
|---|---|---|
| Exports y/y | 23.2% | 19.9% |
| Imports y/y | 27.8% | 26.5% |
| Trade Balance | JPY -634.5bn | — |
| Export Volume y/y | 5.2% | — |
| Export Detail | Current y/y | Contribution to Growth |
|---|---|---|
| Electrical Machinery | 29.4% | +5.2ppt |
| Transport Equipment | 20.7% | +4.6ppt |
| Machinery | 18.4% | +3.3ppt |
| Semiconductors etc. | 49.1% | +3.0ppt |
| Motor Vehicles | 19.5% | +3.1ppt |
| Semiconductor Machinery | 40.9% | +1.5ppt |
| Chemicals | 22.9% | +2.4ppt |
Trade balance in July 2025: JPY -156.3bn.
Key Takeaways
- Japan’s exports surged 23.2% y/y in July, beating 19.9% expected and recording fastest growth since October 2022.
- Semiconductor-related demand remained a major driver. Semiconductor exports jumped 49.1%, while semiconductor manufacturing equipment rose 40.9%.
- Export strength was broad geographically, with shipments to China up 25.8% and exports to US up 22.0%.
- But export volumes increased only 5.2%, showing weak Yen and higher selling prices accounted for much of 23.2% nominal increase.
- Autos highlighted that divergence: passenger-car export values rose 20.8%, while unit shipments increased only 1.2%.
- Imports accelerated even faster, rising 27.8% y/y versus 26.5% expected, strongest growth since November 2022.
- Petroleum import values surged 87.8% as Iran conflict pushed oil prices higher, exposing Japan’s vulnerability to expensive imported energy.
- Trade deficit consequently widened sharply to JPY 634.5bn, from JPY 156.3bn a year earlier.
- Overall picture is two-sided: AI and semiconductor demand are supporting Japanese manufacturing, but weak Yen and oil shock are inflating both export values and import costs, limiting benefit to net trade.