AUDUSD Outlook
AUD/USD Weekly Report
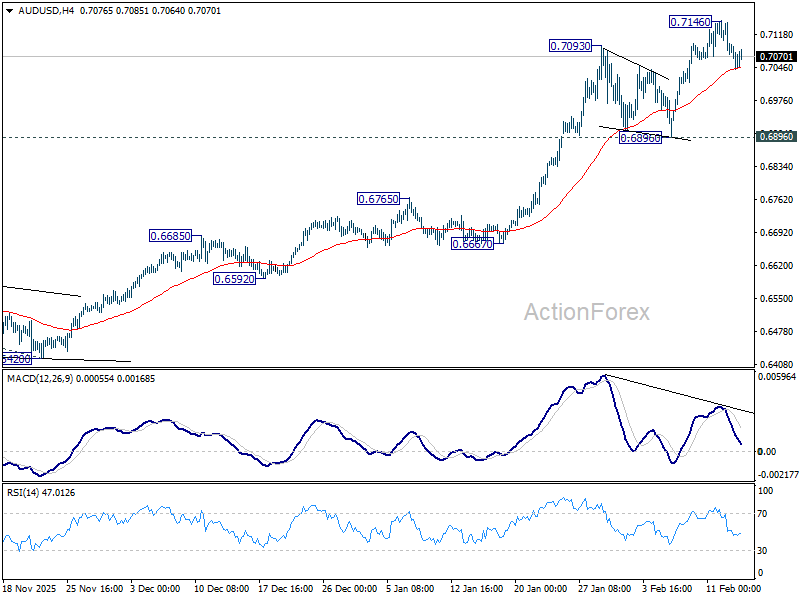
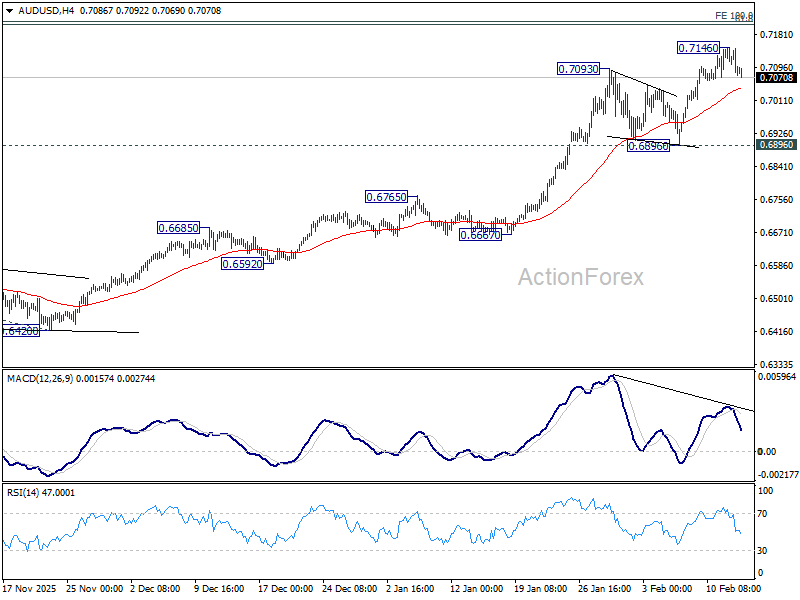
AUD/USD edged higher to 0.7146 last week, but subsequent retreat indicates short term topping, on bearish divergence condition in 4H MACD. Initial bias remains neutral this week for consolidations, and deeper retreat might be seen. But downside should be contained above 0.6896 support to bring another rally. On the upside, above 0.7146 will resume larger up trend to 100% projection of 0.5913 to 0.6706 from 0.6420 at 0.7213.
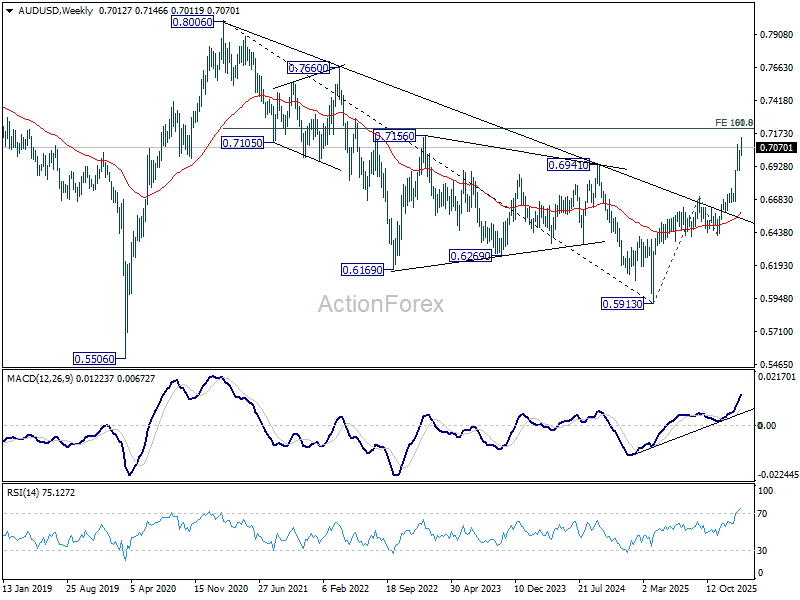
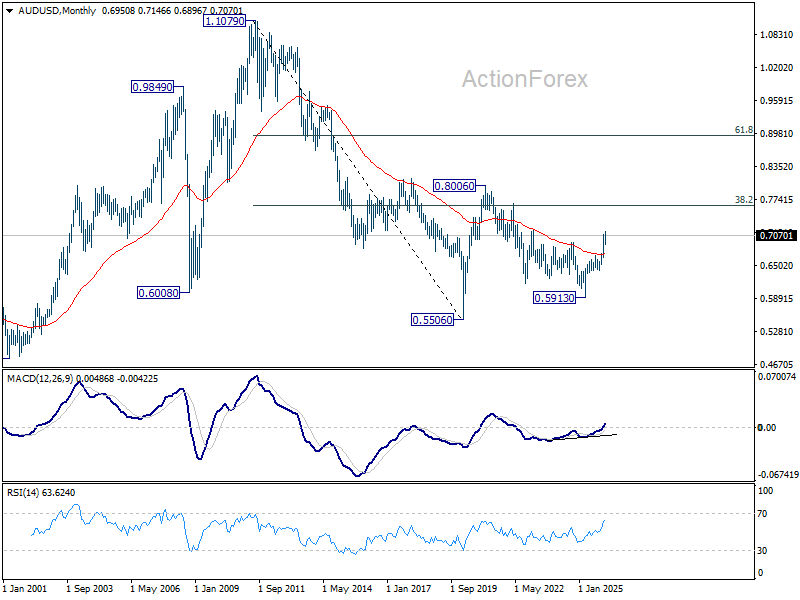
In the bigger picture, current development argues that rise from 0.5913 (2024 low) is reversing whole down trend from 0.8006 (2021 high). Further rally should be seen to 61.8% retracement of 0.8006 to 0.5913 at 0.7206. This will remain the favored case as long as 0.6706 resistance turned support holds, even in case of deep pullback.
In the long term picture, rise from 0.5913 is seen as the third leg of the whole pattern from 0.5506 (2020 low). It's still early to judge if this is an impulsive or corrective pattern. But in either case, further rise should be seen back to 0.8006 and possibly above.
AUD/USD Daily Report
Daily Pivots: (S1) 0.7078; (P) 0.7110; (R1) 0.7159; More...
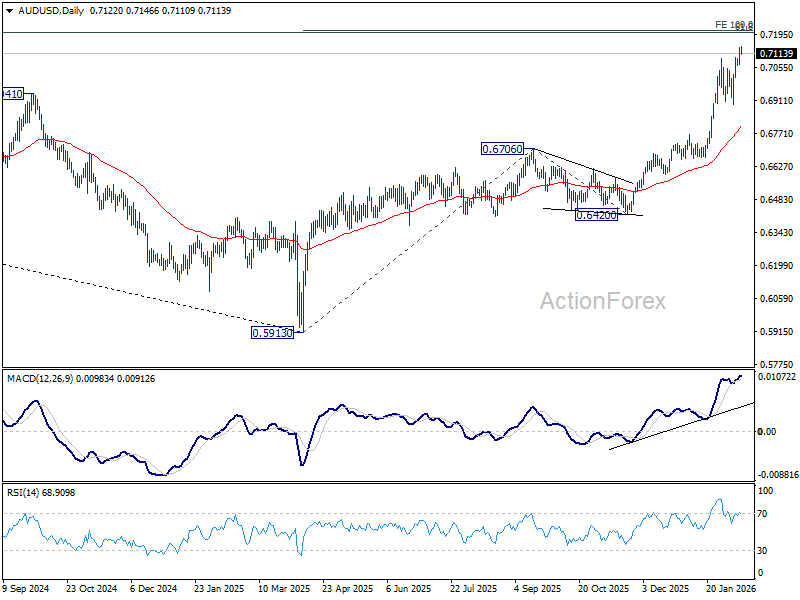
Intraday bias in AUD/USD is turned neutral first with current retreat, and some consolidations would be seen. But downside should be contained above 0.6896 support to bring another rally. On the upside, above 0.7146 will resume larger up trend to 100% projection of 0.5913 to 0.6706 from 0.6420 at 0.7213. However, considering bearish divergence condition in D MACD, firm break of 0.6896 will argue that deeper correction is underway to 55 D EMA (now at 0.6802).
In the bigger picture, current development argues that rise from 0.5913 (2024 low) is reversing whole down trend from 0.8006 (2021 high). Further rally should be seen to 61.8% retracement of 0.8006 to 0.5913 at 0.7206. This will remain the favored case as long as 0.6706 resistance turned support holds, even in case of deep pullback.

AUD/USD Daily Report
Daily Pivots: (S1) 0.7078; (P) 0.7110; (R1) 0.7159; More...
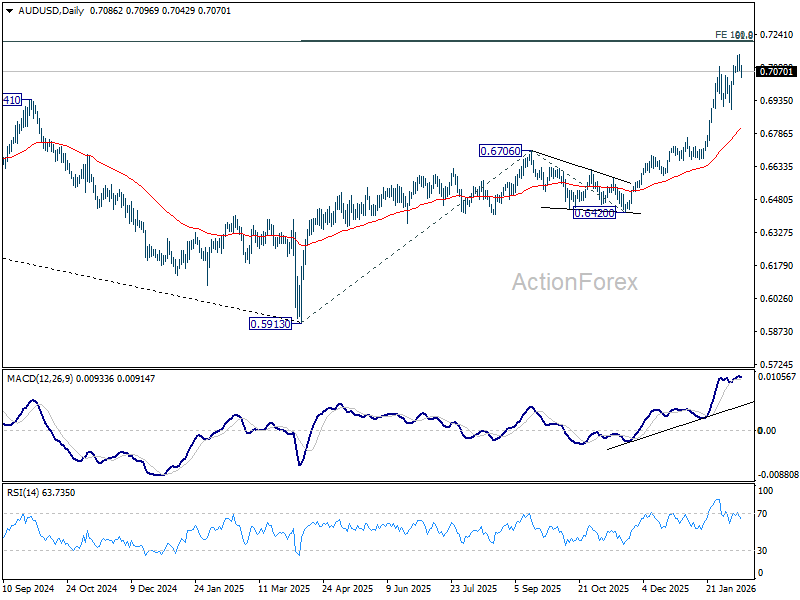
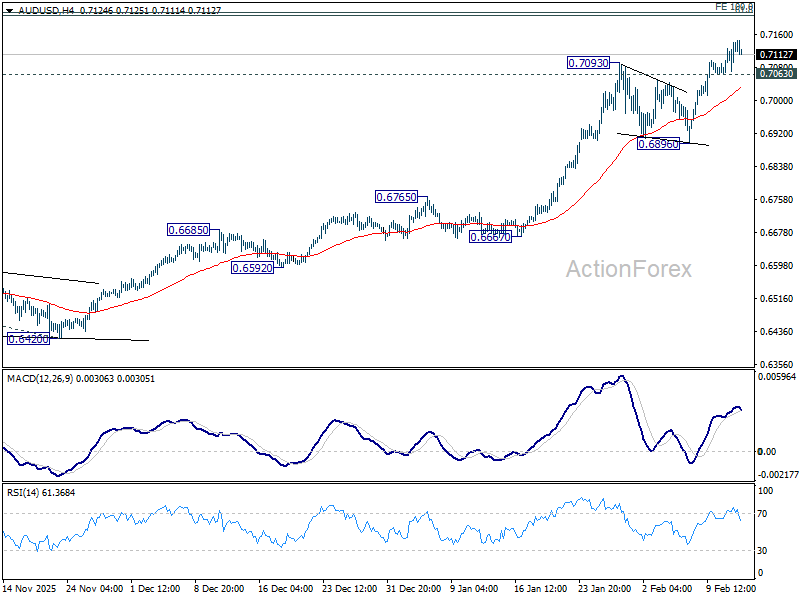
Intraday bias in AUD/USD remains on the upside for the moment. Current up trend should target 100% projection of 0.5913 to 0.6706 from 0.6420 at 0.7213. On the downside, below 0.7063 minor support will turn intraday bias neutral again. But retreat should be contained above 0.6896 support to bring another rally.
In the bigger picture, current development argues that rise from 0.5913 (2024 low) is reversing whole down trend from 0.8006 (2021 high). Further rally should be seen to 61.8% retracement of 0.8006 to 0.5913 at 0.7206. This will remain the favored case as long as 0.6706 resistance turned support holds, even in case of deep pullback.