
Oil continued its downward grind overnight as gold recovered some of its losses as President Trump’s first 100-days draws to a close.
OIL
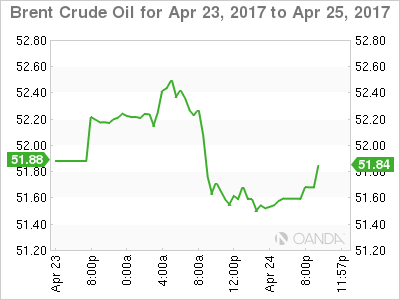
Oil continued its bullish unwind overnight, with both Brent and WTI spot contracts down just over 0.50%. Rising shale production and uncertainty over the OPEC deal extension being quoted as reasons for the fall. We continue to feel the primary cause is excessive short –term long positioning unwinding. In other words, the issues mentioned are known unknowns.
Nevertheless, in the bigger picture, both reasons are relevant. These should ensure any meaningful rallies in oil will be capped until the late May decision date.
Both Brent spot and WTI spot have closed opened in Asia near the previous session’s lows. Brent spot trades at 51.70 with support nearby at 51.30 and then its 200-day average at 50.80 followed by the 50.00 level. Resistance sits at 52.50 and 53.50.
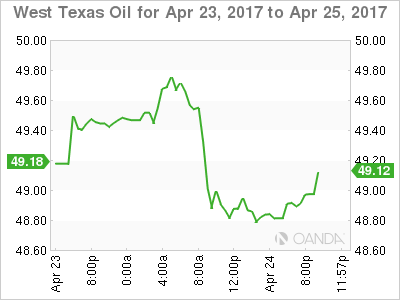
WTI spot trades at 49.00, just above its 200-day average at 48.65, a break opening up a move to 47.00. Resistance sits at 50.00 and 51.00 a barrel.
GOLD
Gold recovered some of its post-election sell-off overnight to open roughly mid-range at 1278 this morning in Asia. With the election fading from memory rapidly the market now turns its attentions to President Trump’s legislative agenda.
Although news of a 15% corporate tax rate will no doubt be warmly received, the worries over a potential U.S. government shutdown seem to be taking precedence in traders’ minds. This has probably been gently supportive of gold overnight. We expect this issue to be more of a storm in a teacup given the soothing noises from Republican leaders this week.
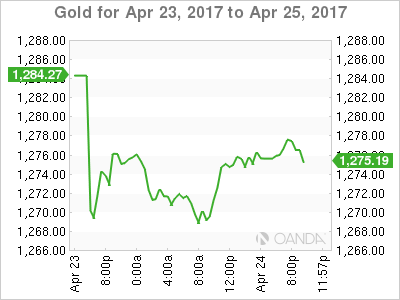
Gold itself, however, is still not a rosy picture technically with the potential of a decent downside correction if and when uncertainty fades. Gold has resistance at 1290 and then 1296, having failed in this area numerous times last week. Below, support lies at 1265.50 and then the 200-day average at 1254.80. A daily close below 1240 would signal a much larger correction could be on the way.


