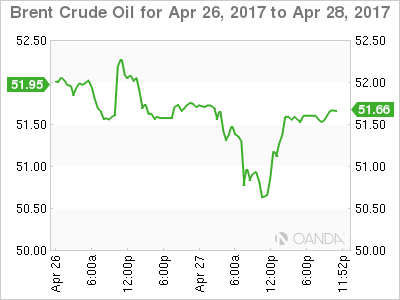
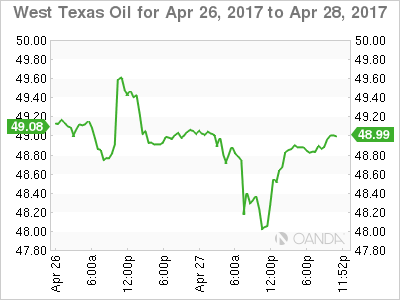
Crude oil staged a dead cat bounce overnight after an initial sell-off, whilst gold flat-lined into Friday.
Both Brent and WTI fell a dollar overnight to make new lows for the week but rebounded aggressively to finish unchanged from Wednesday at 51.50 and 48.90 respectively. Although the talk was of renewed Libyan production, the price action looks suspiciously stop loss driven in our opinion as both broke weekly lows flushing out yet more long-suffering bulls.
Oil’s recovery was probably helped by the International Energy Agency announcing that final investment decisions in new fields had dropped to the lowest level since the 1940’s. That will be a story for another day, more interestingly from a technical standpoint was that both contracts broke their 200-day moving averages intra-day, only to close back then as the New York session ended. Although crude has had something of a dead cat bounce, it may imply we have seen the worst of the sell-off for this week at least.
BRENT
Brent spot opens at 51.50 this morning with support at the 200 DMA at 50.90 followed by the overnight low at 50.0 and then 49.50. Resistance lies just above at 51.80 and then 52.50.
WTI
WTI spot trades at 48.85 with its 200 DMA just below at 48.70, followed by its overnight low at 47.90 and then 46.50. Resistance is just above at 49.00 and then the 50.00 a barrel region.
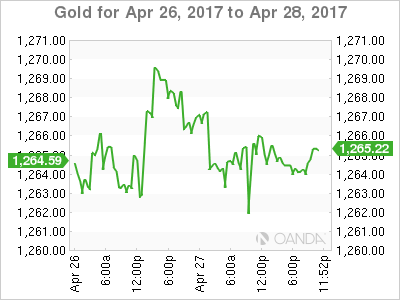
GOLD
Gold heads into the end of the week with more of a whimper than a roar after a deadly quiet session overnight, closing almost unchanged at 1264.50 where it presently trades in Asia. The price action though continues to suggest that gold is treading water before another move down rather than a rally.
With the world an apparently more certain place, the safe haven bid is dissipating which could slowly but surely erode gold’s pricing premium, and a stronger U.S. dollar against the G10 currencies will not be helping.
From a technical perspective, gold has continued to make lower highs on a daily basis over the last two weeks. Gold has initial support at 1259.50 and then the 200-day moving average at 1253.70. The key support region follows this at 1240, a break of which would imply possibly much lower levels.
Resistance lies at 1270 followed by 1280 and then the April highs at 1295.70.