
- Traders have been waiting for the bull rally since early June
- Investors are losing hope for a bull run
- The Bitcoin price may form a bottom in Q3
There was only one dominant colour for cryptocurrencies, it was red. The crypto king, Bitcoin dropped below the $6,000 mark yesterday (back above that vital level today with a gain of 4.64%, last price, $6,310). However, there are some serious concerns that we may actually make another new low for the year because of the sturdy bearish sentiment. Bitcoin is down nearly 55% year to date and it is down -66% from its all-time high.
Traders have been waiting for the bull rally since early June, although there have been two different occasions where we have seen the price action showing some serious strength, but in actual reality, bears have shown their brutal strength over the bulls.
The first bullish signal for the bitcoin price came fairly recently on the back of the speculations that the SEC (U.S. Securities and Exchange Commission) may approve the first Bitcoin ETF (Exchange Traded Fund). The price moved all the way to $8,230 but it failed to break above the $10,000, a major key level for the bulls. The second strong signal came back in early May this year when the price confirmed the bull strength and made a high of $9,734 however it failed to break above the key resistance of $10,000.
The only reason that we are seeing the cryptocurrencies selling off so badly is that traders are losing hope of a bull run. Yes, we are back above the key level of $6,000, but as long as the price keeps on having a stab at the lows of this year $5,791, we are not out of woods.
It is true that the actual bull run starts from September or October (looking at the previous year chart) and we still have time for that, however, the expectations have been that price may form its bottom in the Q2 of this year and from there onwards, it is only green light for Bitcoin. However, we are in the third quarter of this year and it appears that the price may be looking to form some sort of bottom during this quarter. Hopefully, the current sell-off would mark the bottom for the Bitcoin price.
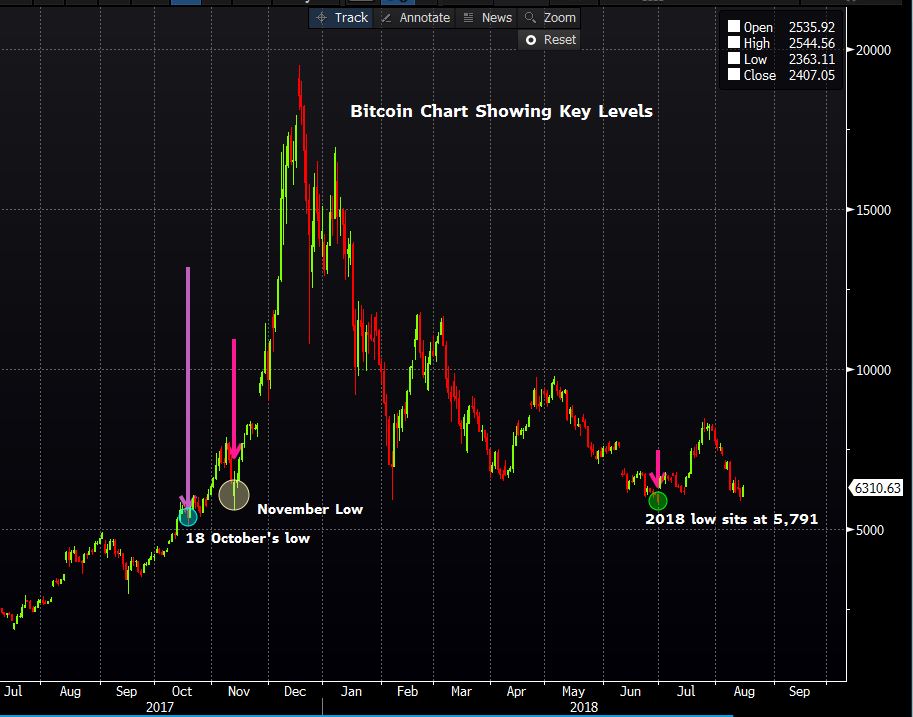
So just how far the current move can extend to? Speaking from a technical perspective, there are some important key levels which I am watching carefully. If the downtrend continues, the following are the key levels:
November 13th low: $5,605
October 18th low: $5,109
Psychological level: $5,000
As of today, the Bitcoin has broken yesterday’s high of $6,298, so there is a possibility that we may just have a false alarm and the price may not form another new low for 2018. If that happens, then there is a strong hope for the bull run continue for this year.


