
U.S. Review
Objects in Rearview Mirror Are Bigger than They Appear
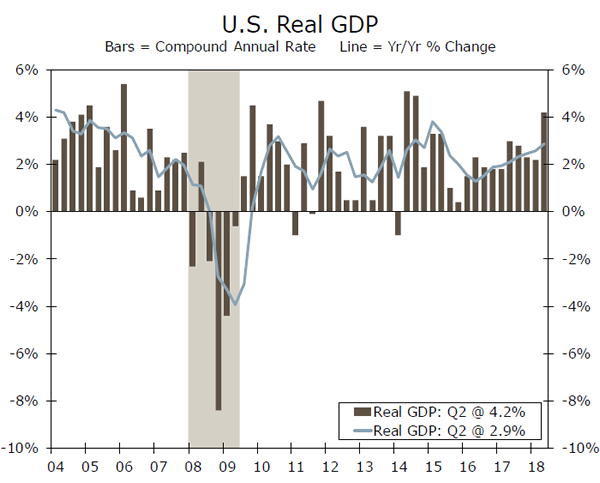
- Revisions to second quarter GDP released this week lifted the growth rate to 4.2 percent in Q2, while revealing a faster rate of business spending and a record high for corporate profits.
- The pace of consumer spending, while still strong, was revised a bit lower. That said, this week’s economic indicators show that the momentum in consumer spending in the prior quarter carried into the current one. The Conference Board’s Consumer Confidence index continued to rise and, reflecting a tight labor market, income gains helped sustain consumer spending growth in July.
Details of GDP Revision Broadly Positive
The second estimate for GDP revealed a faster pace of economic growth than first estimated, with the annualized growth rate quickening slightly to 4.2 percent in Q2. The details also offered additional color on the state of the economy at this late stage of the cycle and, with some exception, those details were broadly positive.
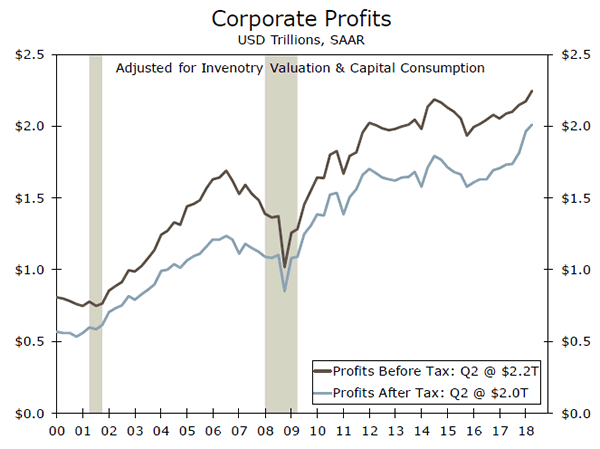
In terms of “new” details, the second GDP release offers the first look at corporate profits. While we already had some positive inklings from the individual company earnings reports, the official figures here for the aggregate economy were solid. Pre-tax profits grew $72.4 billion over the quarter, nudging the overall pre-tax profit level to $2.2 trillion, a record high for the series (top chart).
There is some evidence that the sugar high from the tax cuts is wearing off, however. After-tax profits rose only $47.3 billion, compared to the near $150 billion surge in the first quarter. This more modest increase was partially due to a rise of nearly one percentage point in the effective corporate tax rate. The deceleration in after-tax profits corroborates our forecast that the effect of the 2017 Tax Cuts and Jobs Act will only act as a temporary boost to corporate profit growth.
Businesses are still spending. We also learned in the revisions that business fixed investment was better than first reported, with a 6.2 percent growth rate in the second quarter, up from 5.4 percent previously. Upward revisions to equipment and intellectual property spending accounted for most of the improvement.
Consumer Strength Continued into Current Quarter
Consumer spending was still stellar in the second quarter, growing at a 3.8 percent annualized clip, but admittedly, that is one category that was revised down; the first estimate had a 4-handle. The slight downward revision here does not shake our conviction that consumer spending will continue to support growth in the second half of the year.
The Conference Board’s measure of consumer confidence rose 5.5 points in August, with gains in both present and future expectations. Current optimism continues to be a reflection of the tightening labor market, as the share of consumers stating jobs as plentiful was little changed, and those who see jobs as hard to get fell 2.1 points. Not all measurements of confidence improved in August, for example the August University of Michigan’s measure of sentiment slipped to its lowest level since January. Consumers feel better about their current financial situation than their expected situation, as inflation appears to be a growing concern.
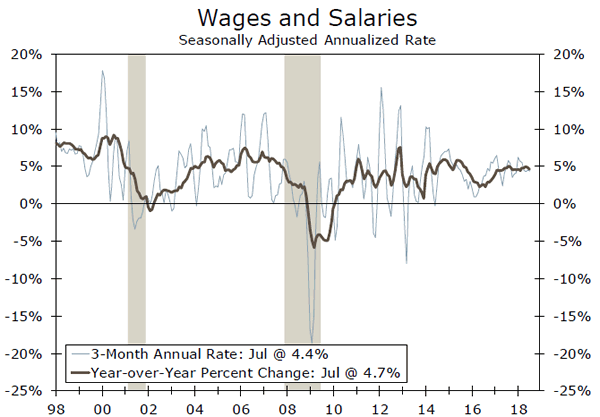
Despite rising inflation concerns, real disposable income was up 2.9 percent over the past year in July. The tight labor market conditions showed up in the personal income and spending report for July, where we saw sustained strength in wages and salaries, which were up 0.4 percent for the second consecutive month. July spending increased 0.4 percent, which offers some affirmation (middle chart) that steady consumer spending carried into the current quarter, though the pace of spending may slow somewhat in the second half of the year.
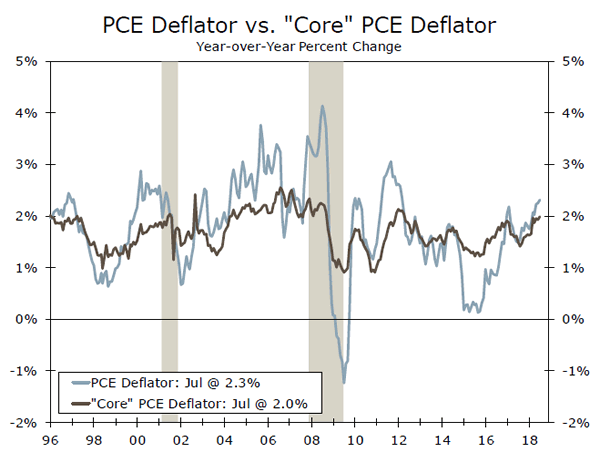
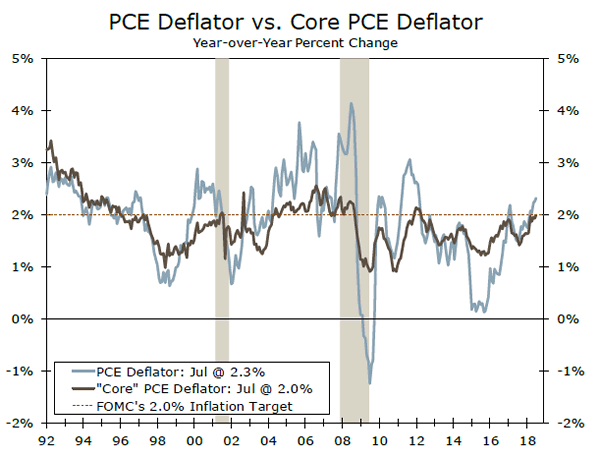
The year-over-year rate of PCE inflation rose to 2.3 percent, the fastest pace in six years and in line with the Fed’s target (bottom chart). Provided we get a decent August jobs number next week, the Fed is on track for another hike at its September 26 meeting.
U.S. Outlook
ISM Manufacturing Index • Tuesday
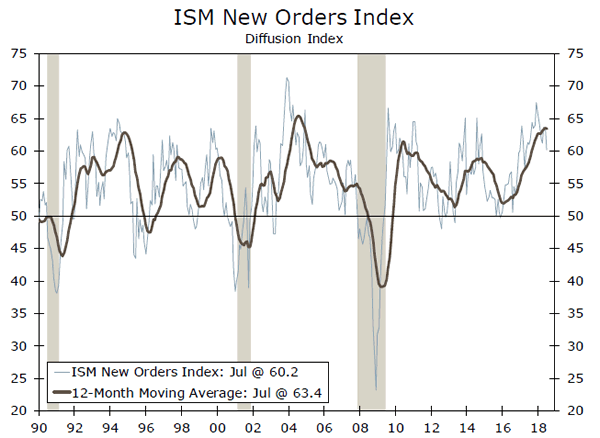
The ISM manufacturing index cooled slightly in July, falling 2.1 points to 58.1. While the index still sits at a high level, signaling that manufacturing activity remains strong, the changing trade environment looks to be affecting activity, as some manufacturers cited slowing in new export orders. The new orders index dropped over three points to 60.2, its lowest reading in more than a year. However, hiring remained a bright spot in July, with the employment index recovering 0.5 points to 56.5. Manufacturing payroll growth has displayed a similar trend, with industry adding 156,000 jobs in H1, more than double the number added over the same period last year. While changing trade policy has clearly affected the sector, regional purchasing managers’ indices show that capital spending plans remain elevated. For now, the slight pullback in the ISM readings should not materially affect the overall economic outlook, and we look for the ISM index to remain solid in August.
Previous: 58.1 Wells Fargo: 57.5 Consensus: 57.7
Trade Balance • Wednesday
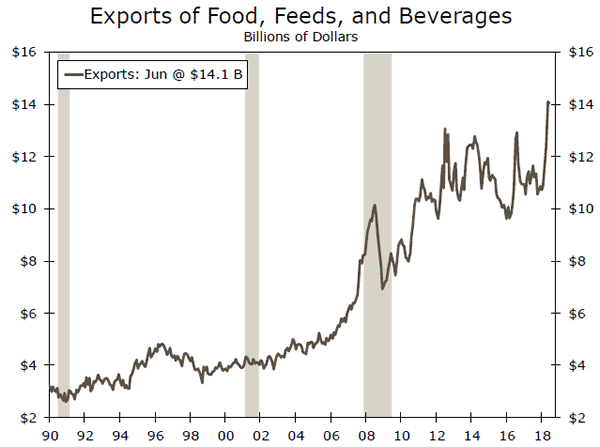
The trade deficit widened to $46.3B in June, largely due to a drop in typically volatile aircraft exports, compounded by a $1.4 billion decline in consumer goods exports. However, soybean exports have surged in recent months, up $4.4 billion year-to-date in June, as farmers have moved to get soybean shipments out of the country ahead of retaliatory tariffs. That said, we look for soybean exports to come back down to earth, which could prove a drag on the more rapid pace of export growth seen over the past few months.
The trade balance likely widened further in July, as a 1.7 percent drop in goods exports reported in the advance release drove the deficit much higher than expected. While real net exports provided a 1.2 percentage point boost to Q2 GDP growth, that contribution looks poised to reverse, and we look for net exports to be a drag on GDP growth in Q3. Solid domestic demand should support growth in imports, while trade-related export distortions will likely fade.
Previous: -$46.3B Wells Fargo: -$50.8B Consensus: -$49.6B
Employment • Friday
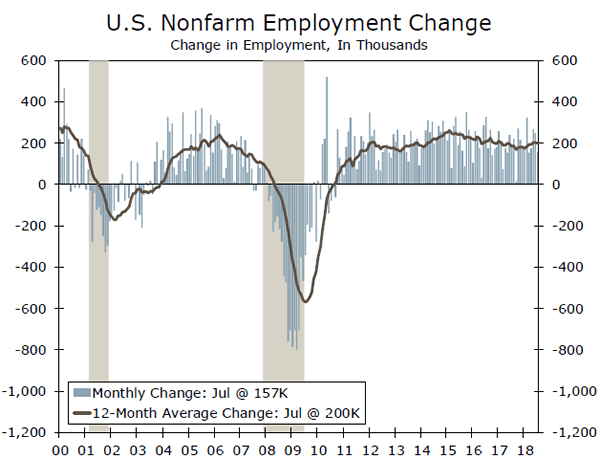
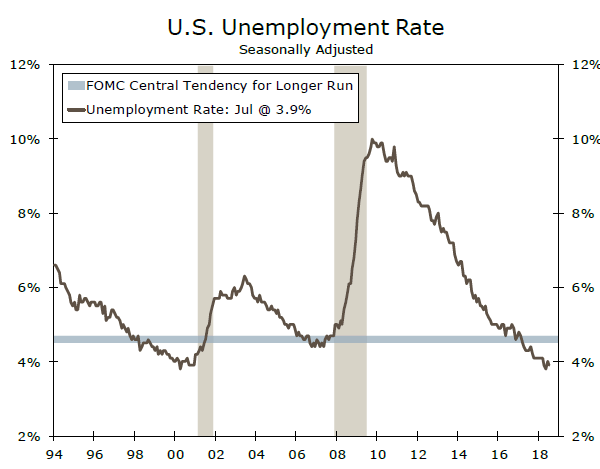
Nonfarm payrolls rose 157,000 in July, with the monthly change coming in a bit lower than the pace seen over the past few months. However, payroll growth has still averaged 215,000 jobs per month since the beginning of the year, up from 184,000 over the same period in 2017. The manufacturing sector has shown particular strength, adding 37,000 jobs in July for the largest monthly increase so far this year. Although July’s employment growth came in slightly weaker than expected, average hourly earnings continued their steady rise, up 0.3 percent over the month. Solid wage growth along with the unemployment rate ticking back down to 3.9 percent confirms that the labor market remains tight. We look for employment growth to regain its upward momentum, and forecast nonfarm payrolls to rise 200,000 in August. These trends should support the Fed’s assessment of a strengthening labor market, and reinforces our call for two more rate hikes before the end of the year.
Previous: 157,000 Wells Fargo: 200,000 Consensus: 187,000
Global Review
Trade Tensions Simmer
- Trade developments this week were mostly benign with a bilateral deal reached between Mexico and the U.S., while progress is seemingly being made with Canada to join a broader deal. However, next week could see an escalation in global trade tensions should the U.S. move ahead with plans to impose another round of tariffs on China.
- Key global data released in the past week were mixed. Canada’s Q2 GDP growth firmed and Eurozone August CPI inflation softened a touch, while Chinese August PMIs edged higher. Argentina’s efforts to support the peso provided little relief.
Trade Tensions Show Some Signs of Easing, For Now
Trade developments this past week were mostly constructive, starting with an announcement on Monday that the United States and Mexico reached a bilateral trade agreement. Among key elements of that deal, the two countries agreed that 75 percent of an automobile’s value be manufactured in the United States or Mexico, up from 62.5 percent in North America under NAFTA, while 40 to 45 percent of a car must be made by workers earning at least $16 an hour for the car to not be subject to tariffs. As the week progressed, key Canadian and U.S. officials met in Washington to make progress on a more comprehensive trade deal that could include all three of the NAFTA countries. As of this writing, those talks are still ongoing. Separately, the U.S. administration said it will maintain tariffs of 25 percent on steel imports and 10 percent on aluminum imports, but announced targeted relief on steel from South Korea and Brazil, and aluminum and steel from Argentina. While trade developments this week were benign, markets will be keenly focused on whether the U.S. moves ahead with further tariffs on $200 billion of Chinese imports after a period of public-comment concludes next week.
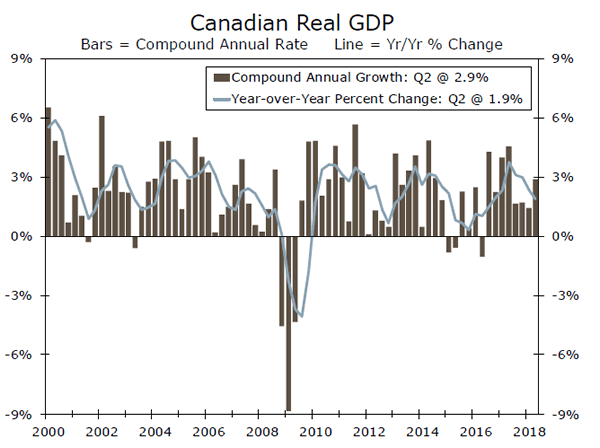
While Canadian officials have been busy negotiating trade, Canada’s Q2 GDP data were released and showed that growth firmed to 2.9 percent on a quarterly annualized basis from 1.4 percent in Q1 (top chart). Energy exports and household spending contributed to the pick-up in Q2 growth, while slowing business investment was the primary factor behind the slightly softer-than-expected overall GDP growth rate. These data along with still lingering trade uncertainty supports the case for further gradual interest rate hikes by the Bank of Canada, discussed on the following page.
Eurozone CPI Inflation
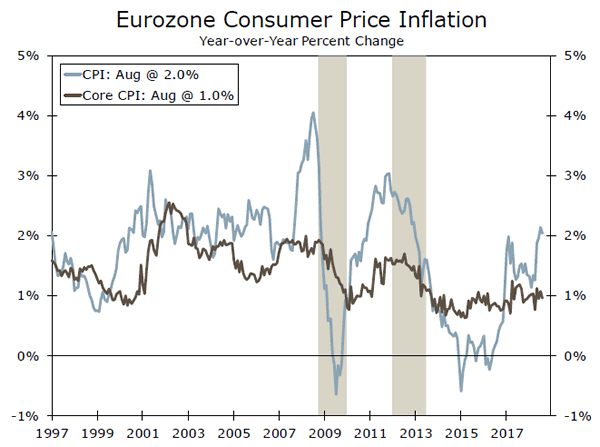
Eurozone August CPI inflation edged down to two percent yearover- year as expected (middle chart). While the overall rate of inflation matched multi-year highs, core CPI inflation was more subdued and eased to one percent year-over-year. Recent inflation trends support the European Central Bank’s current plan to gradually dial back the degree of monetary accommodation, including the end to asset purchases at the end of this year and initiating interest rate hikes from the second half of next year.
Argentine Peso Takes Another Plunge
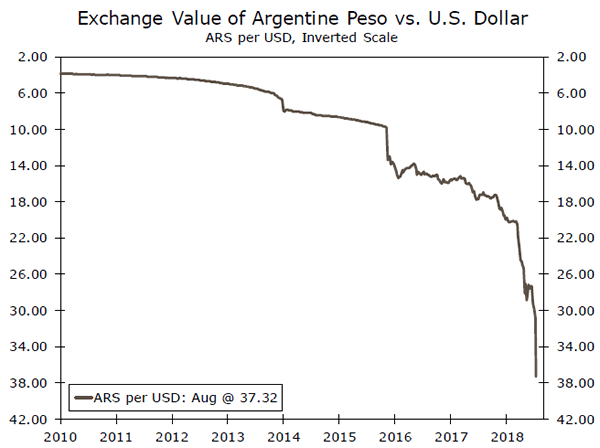
The Argentine peso fell substantially over the past week after previous large declines. The drop in the currency occurred surrounding Argentina’s request of the International Monetary Fund (IMF) to accelerate payments from a $50 billion credit line, which contributed to jitters about the country’s economic fragility. The currency decline prompted yet another central bank interest rate hike, with a 15 percentage point increase in Argentina’s policy interest rate to 60 percent. That move makes Argentina’s interest rates among the highest in the world and has so far done little to stem the peso’s plunge, which weakened to a new record low (bottom chart).
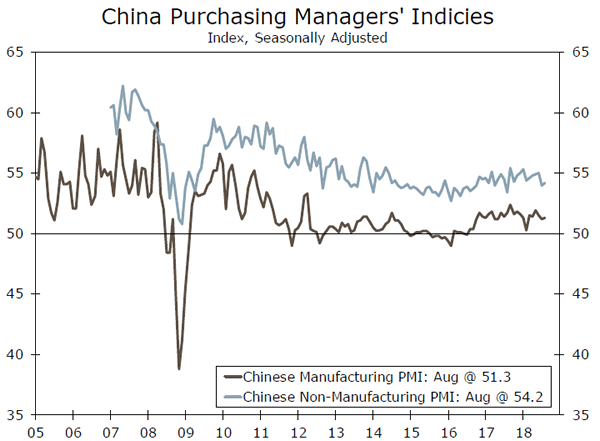
Elsewhere in emerging markets, China’s manufacturing PMI edged up to 51.3 and the non-manufacturing PMI rose to 54.2 (see chart on front page). That data suggest steady overall economic activity as the Chinese economy remains on a path of gradually slowing growth over time.
Global Outlook
U.K. Manufacturing PMI • Monday
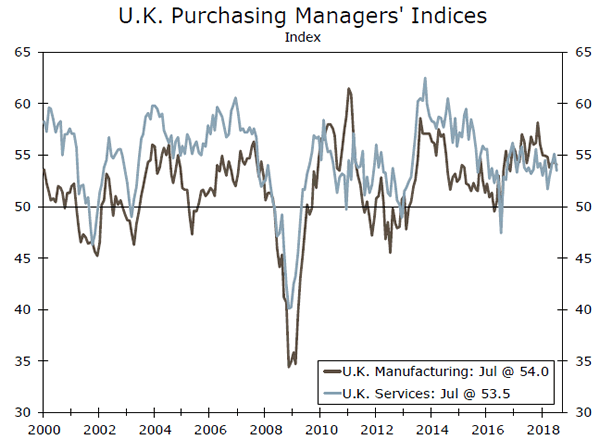
The U.K. manufacturing PMI fell by more than expected in July to 54.0 from 54.3 the month before, and down from a high of 58.2 late last year. The new orders component fell to 54.2, the lowest in over a year, suggesting that the soft start to U.K. manufacturing in Q3 may continue. Moreover, sentiment remained subdued last month amid ongoing Brexit uncertainty, hinting at potential for next week’s release of the August manufacturing PMI to remain somewhat contained.
Later in the week, the services PMI is also due. That release may shed more insight than the manufacturing survey into the U.K.’s overall economic outlook given its more dominant service sector. The July services index declined to 53.5 from a 2018 high of 55.1 in June, as respondents said that Brexit uncertainty contributed to a “wait-andsee” approach to investment. Given Brexit concerns showed little-tono improvement in August, sentiment likely remained subdued.
Previous: 54.0 Consensus: 53.9
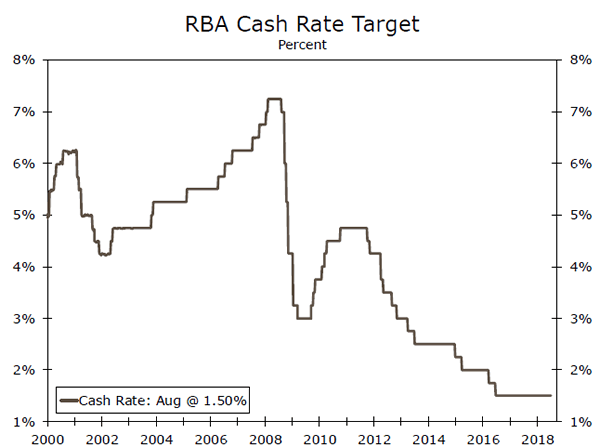
Reserve Bank of Australia • Tuesday
The Reserve Bank of Australia (RBA) has held its Cash Rate at 1.50 percent for the past two years and is expected to keep holding its rate steady for the time being. Growth and inflation firmed modestly in Q2 with CPI inflation moving into the lower end of the RBA’s target range of two to three percent, while wage costs remain subdued. Given the overall gradual progress on inflation, minutes from the last monetary policy meeting noted that there was “no strong case for a near-term adjustment” in rates, while also indicating that the next rate move would more likely be an increase than a decrease. Hence, we look for the RBA to keep rates unchanged next week.
Australian Q2 current account figures are also due on Tuesday, while Q2 GDP data are scheduled for release on Wednesday. The current account deficit is expected to widen slightly, to about 2.4 percent of GDP, while some moderation in Q2 GDP growth is expected, to a 2.8 percent year-over-year rate, down from 3.1 percent in Q1.
Previous: 1.50% Wells Fargo: 1.50% Consensus: 1.50%
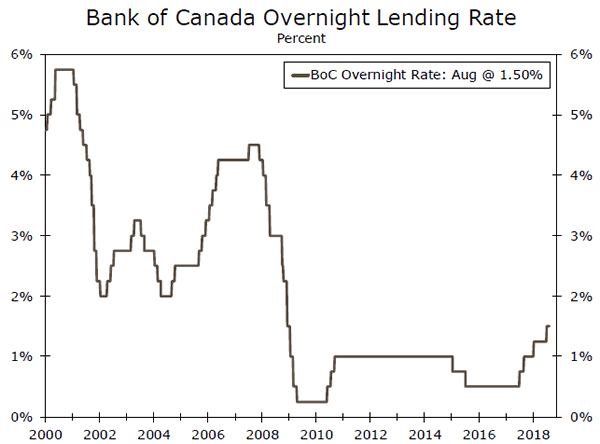
Bank of Canada • Wednesday
The Bank of Canada (BoC) raised its overnight lending rate 25 bps to 1.50 percent at its latest meeting in July. Growth momentum picked up after a relatively soft start to the year, with Q2 GDP growth firming to a 2.9 percent annualized rate from 1.4 percent in Q1. Meanwhile, July CPI inflation quickened to 3 percent, which is the fastest pace since 2011 and the top of the BoC’s inflation target range. Speaking at the Jackson Hole symposium, Gov. Poloz said recent high inflation is transitory, and reiterated a gradual, data-dependent approach to further rate hikes. Thus, while further rate increases are on the horizon, we expect the BoC to remain on hold next week and instead wait until later this year to deliver another rate hike.
Canada’s August employment report is due on Friday and is expected to show a slower pace of job gains than the prior month, while the jobless rate may tick up. Average hourly earnings will also be closely monitored to see if the recent softening in wages continues.
Previous: 1.50% Wells Fargo: 1.50% Consensus: 1.50%
Point of View
Interest Rate Watch
Jackson Hole: Taking the Long View
Last Friday, FOMC Chairman Jerome Powell spoke at the annual Jackson Hole symposium. In terms of the immediate monetary policy consequences of the speech, there were few. Powell broadly reaffirmed the FOMC’s commitment to gradually increasing interest rates. However, rather than dive into the various “risk factors” that could alter the policy outlook, Powell chose to take a more structural view on monetary policymaking.
Chairman Powell thematically walked through the different historical periods of monetary policymaking, with a particular focus on the late 1990s. During this period, a tight labor market was met by declining levels of core inflation, a puzzling real-time problem for Chairman Greenspan and other FOMC policymakers at the time (top and middle charts).
Powell noted that, with the benefit of hindsight, we now know that potential growth had shifted up, allowing the economy to operate at historically high growth rates without overheating. By remaining data dependent “the FOMC thus avoided the mistake of overemphasizing imprecise estimates of the stars [the neutral rates of interest and unemployment].”
In some ways, today’s parallels with the late 1990s are striking. U.S. equity valuations are historically high, the labor market is booming, economic growth is at a cycle-high but inflation remains in check. Without the benefit of hindsight, it is difficult to pin down exactly why this is. But, perhaps Chairman Powell is implicitly stressing that data dependency is critical when there are significant uncertainties about key structural economic variables, such as the neutral interest rate, the natural rate of unemployment or the extent to which inflation responds to resource utilization.
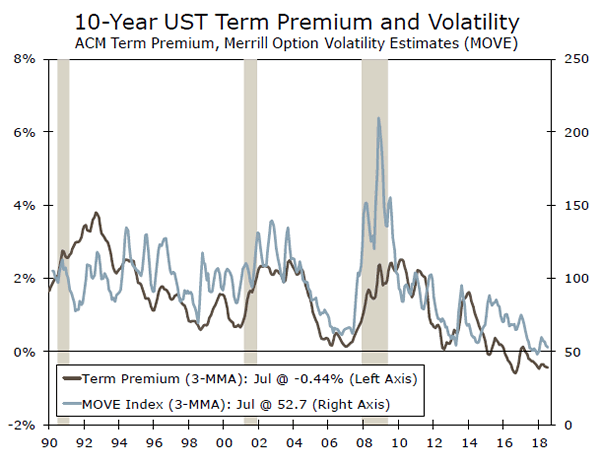
With the term premium still generally considered negative in the United States and interest rate volatility historically on the low side (bottom chart), markets seem to see a below-average level of uncertainty on the horizon for interest rates. Only time will tell if this is consistent with a data-dependent Fed that sees a high level of uncertainty in the stars.
Credit Market Insights
Mortgage Rates and Normalization
Recently there has been a marked deterioration in the Fannie Mae Home Purchase Sentiment Index and the Michigan Consumer Sentiment Survey’s “good time to buy a house” response. A major driver of this worsening outlook of would-be homebuyers has been rising mortgage rates. Indeed, in the past year the conventional 30-year rate has risen to 4.51 percent, from 3.43 percent.
While mortgages rates generally track the ten-year Treasury rate, mortgages— packaged into mortgage-backed securities (MBS)—also carry prepayment risk. Investors therefore demand a higher yield to compensate them for this risk, hence the spread of MBS over Treasuries. The Fed removed much of this risk from the market after the financial crisis as its balance sheet ballooned and its MBS holdings increased from $0 to $1.7 trillion, thereby driving rates down across the economy and aiding the troubled housing sector specifically.
Currently, the Fed is removing this support and allowing up to $16 billion of MBS to roll off its balance sheet each month. How high mortgage rates will go in response remains to be seen, and our forthcoming Part II report on the return to “normal” will explore the effect of the composition of Fed holdings on interest rates moving forward. Of particular interest, noted in Part I, is the possibility of higher rates reducing refinancing activity, thereby slowing MBS redemptions and interfering with the Fed’s carefully choreographed balance sheet reduction and normalization plan.
Topic of the Week
Labor Day Special
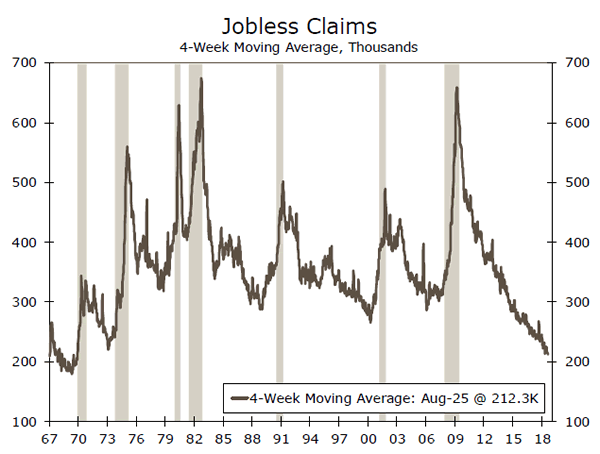
Heading into Labor Day, the four-week average of initial jobless claims fell to 212,250 this week, the lowest level recorded since 1969 (top chart). To put the comparison into perspective, the size of the labor force has more than doubled over this 49-year period. The unemployment rate tells a similar story of an extraordinarily tight labor market; at 3.9 percent, it is near a 20-year low. From the perspective of unemployment, American workers are clearly in an advantageous position this Labor Day. However, the broader picture, incorporating wage and salary growth, offers a more nuanced view.
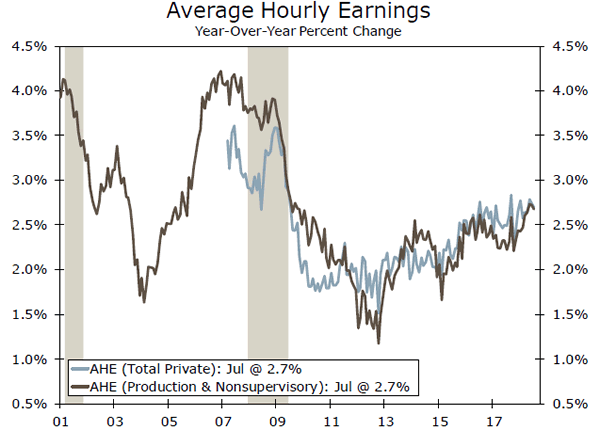
Despite business surveys indicating that employers are facing difficulty filling open positions, they are not rushing to raise wages. Average hourly earnings growth has picked up since the early days of the expansion, but has yet to breach 3 percent (bottom chart). In addition, higher consumer price inflation—which is currently running at 2.9 percent year-over-year—is increasingly eroding nominal wage gains. On a real basis, wages have actually declined for the past three months. As we have written previously, non-wage compensation is showing a more convincing upward trend, with benefits growth outpacing wages. However, total compensation growth remains weaker than in previous cycles.
The puzzle of low wage growth in a tight labor market was addressed this month at the annual Economic Policy Symposium in Jackson Hole, Wyoming, which brings together central bankers from around the world. At the luncheon address, Alan Krueger of Princeton expanded on one possible explanation: declining competition and worker bargaining power. Lower union membership means that workers have less ability to negotiate higher wages, while the increase in employer concentration in the United States facilitates possible collusion on wages. The falling real value of the minimum wage also makes it easier for employers to hold down pay.
We expect wage growth to trend up ahead, but changes in the structure of the economy suggest that we may not see a full return to the conventional relationship between wage growth and labor availability.


