The decline in US stocks accelerated yesterday with the Dow, S&P, and NASDAQ shedding 550, 50, and 115 points respectively. Over the past five days, the three have lost 3.25%, 2.95%, and 4% respectively. This decline has spread around the world with Asian and European stocks dropping as well. These declines are mostly associated with investors’ fear of a slowing economy and the impacts of the ongoing trade conflict between the US and China. In the third quarter earnings releases, a good number of US companies like Apple, Nvidia, and Facebook lowered their guidance. This was also attributed to a strong dollar. Next week, the US President will meet with his Chinese counterpart providing a ray of hope that a trade deal or compromise will be made.
Yesterday, the price of crude oil dropped to the lowest levels since last year. Brent and WTI dropped to lows of $61.95 and $52.69. The decline was because Russia rejected calls by Saudi Arabia to reduce supplies. In the Asian session, the price rose slightly after the American Petroleum Institute (API) released its weekly inventory numbers. The numbers showed a sudden drawdown in crude oil. The inventories declined to 1.54 million barrels. This was significantly lower than last week’s boost of 8.45 million barrels. Today, the EIA will release its numbers, with traders expecting inventories to show 2.94 million barrels.
The US Department of Commerce released the housing numbers yesterday. The housing starts for October rose by 1.5%, which was lower than the consensus estimate of 1.6%. The numbers rose to 1.228 million, which was higher than the estimate of 1.225 million. The building permits for October rose to 1.263 million, which was higher than the estimated 1.260 million. Today, the National Association of Realtors will release the existing home sales numbers for October. Investors expect the numbers to show sales of 5.25 million, which will be higher than September’s increase of 5.115 million. Other important economic numbers will be the durable goods orders and jobless claims.
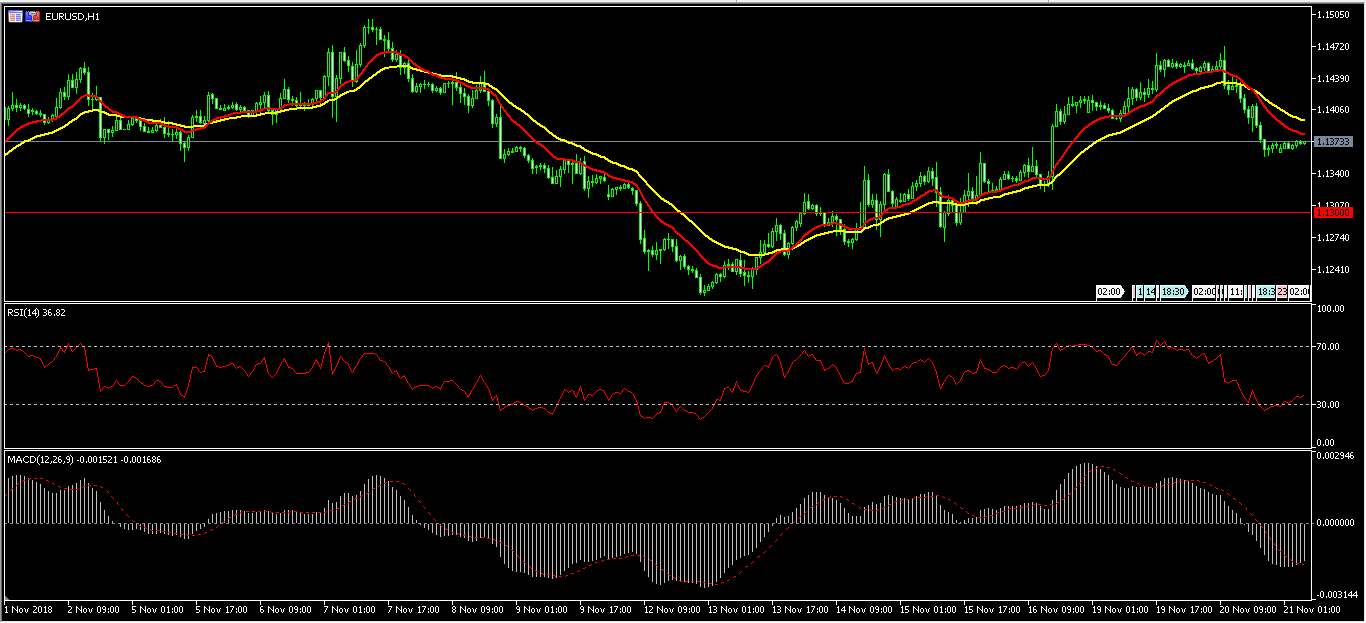
EUR/USD
The EUR/USD pair declined sharply yesterday after the housing starts numbers. In the Asian session, the pair was little moved. The decline came as the 15-day EMA crossed the 30-day EMA in a bearish manner. The RSI has moved from 29 to the current 36 while the MACD shows that more declines are possible. The pair will likely continue moving lower as traders wait for the important building numbers. If it does, it will likely test the support of 1.1300.
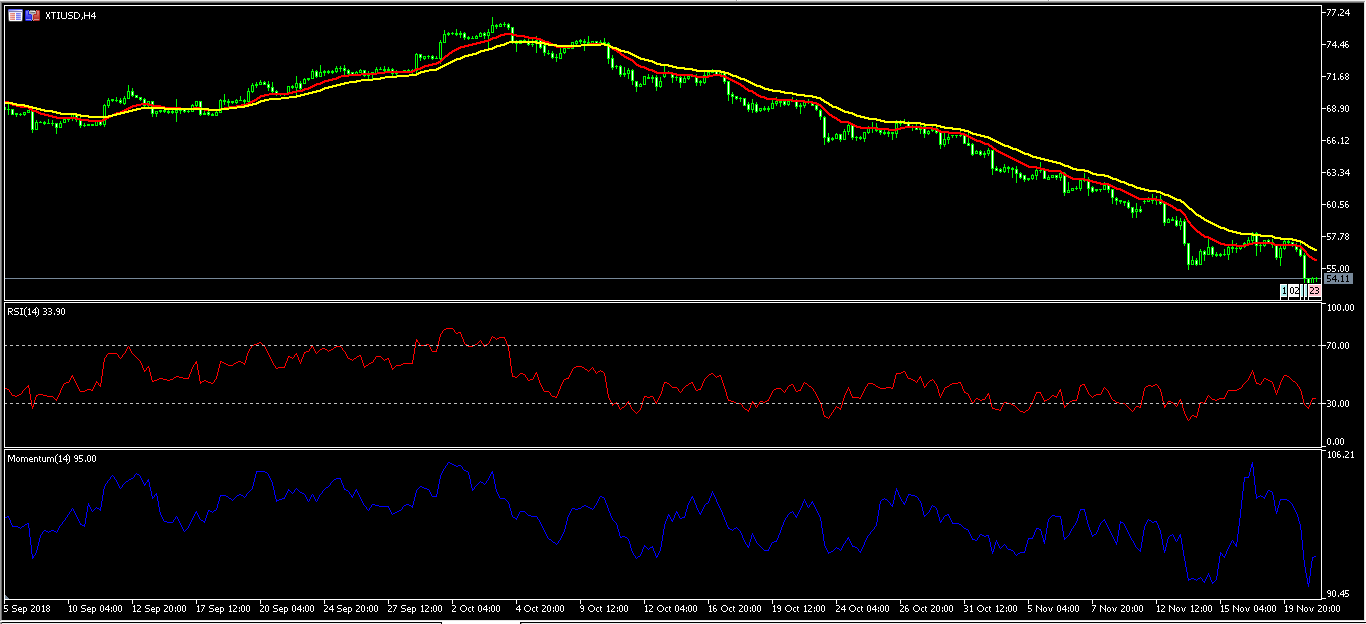
XTI/USD
The XTI/USD moved slightly higher in the Asian session. It still remains near the lowest level since last year. On the four-hour chart, the double EMAs show that the pair could continue moving lower. The RSI has moved slightly up to 34, from the previous low of 29. The momentum indicator too has fallen as shown below. There is a likelihood that the pair will continue the downward momentum as traders wait for the OPEC meeting in Vienna. The meeting will be held on December 6.
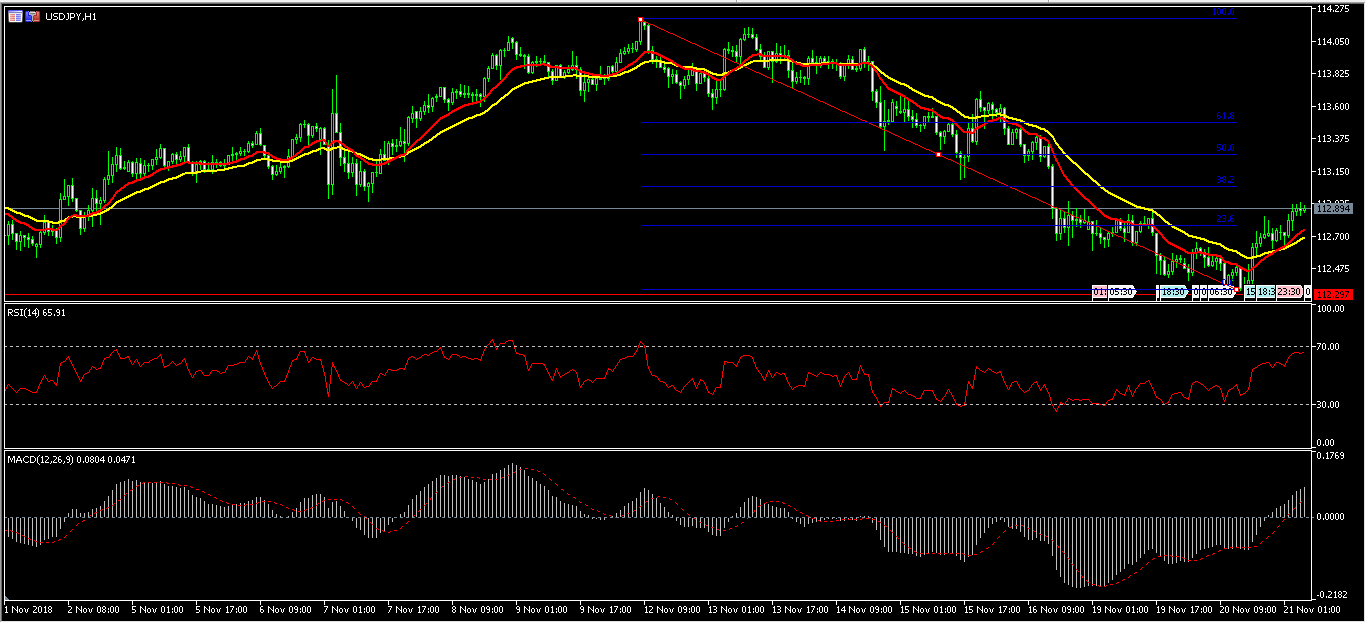
USD/JPY
This week, the USD/JPY pair has risen from 112.29 to the current 112.94. Yesterday, the pair crossed the 23.6% Fibonacci Retracement level of 112.77 and is currently heading to the 38.2% Fibonacci level of 113.04. The RSI has moved to 66, from a low of 29. Today, the pair will likely continue moving up to the 113 level. This is confirmed by the double EMAs, the RSI, and the MACD as shown below.