The price of crude oil experienced its biggest decline of the year in yesterday’s American session only to par some of the losses in the Asian session. There are two key reasons for the decline. Firstly, investors are concerned about the trade war, which they believe will affect demand. Secondly, they are worried about the rising US inventories. On Wednesday, data from EIA showed that the inventories rose by more than 4 million barrels, which was higher than the expected drawdown of slightly under 500K barrels.
Yesterday, US stocks declined sharply as investors continued to worry about trade. The Dow ended the day down by almost 300 points while the S&P declined by 1.2%. 80% of the stocks in the S&P 500 declined. US treasuries too declined sharply. This week, global stocks in Asia, North America, and Europe have all declined sharply as traders worry about the implications of the trade war.
Today, New Zealand released its trade data. In April, exports increased to $5.55 billion while imports increased to $5.11 billion. The trade deficit increased to $5.48 billion, which was worse than the expected $5.465 billion. In Japan, the national CPI and core CPI rose slightly to 0.1% and 0.9% respectively. Later today, the UK will release its retail sales data while US will release the durable goods data.
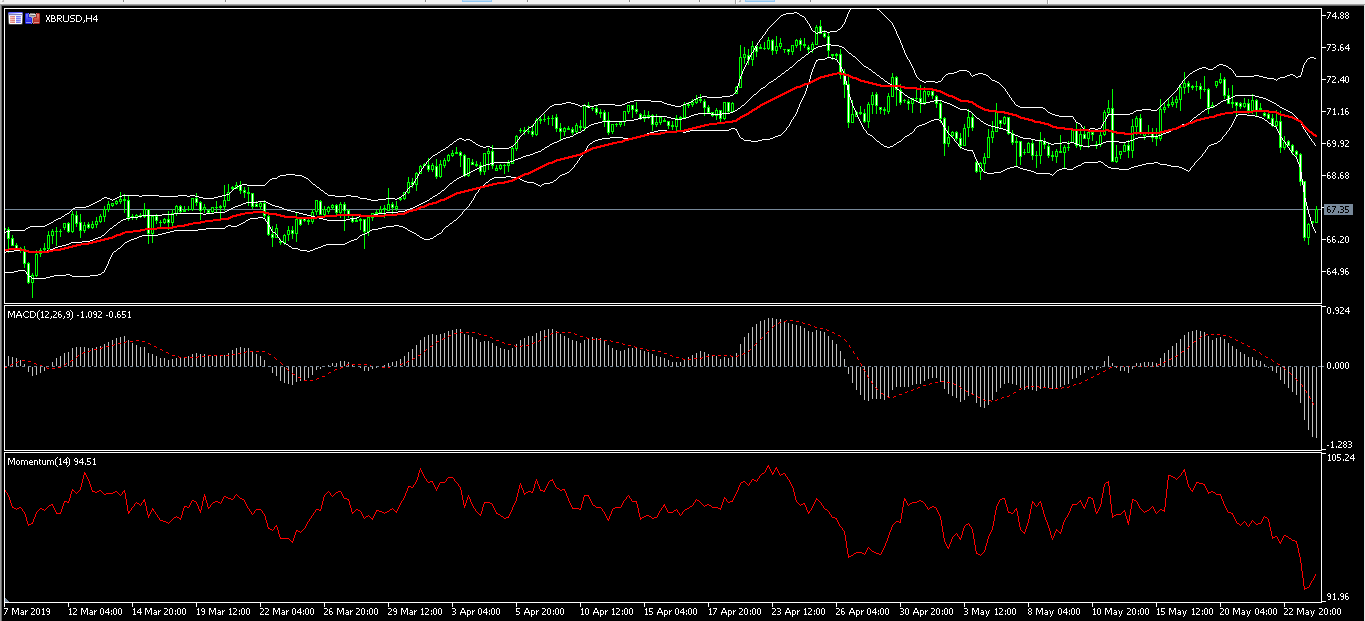
XBR/USD
Yesterday, the XBR/USD pair declined to a low of 65.98, which was the lowest level since March 29. On the four-hour chart, this price is along the lower line of the Bollinger Bands and lower than the 50-day and 25-day moving averages. The signal line of the MACD has declined to the lowest level since December. The same is true with the momentum indicator. While the pair will likely continue moving lower, there is the chance of a recovery in June as OPEC leaders meet.
EUR/USD
The EUR/USD pair rose sharply in the American session. The pair rose from a low of 1.1106 and reached a high of 1.1187. In the Asian session, it was relatively unchanged. On the chart below, the price is above the 50-day and 25-day moving averages. The price is also above the important downward trend line shown below. The 14-day RSI has remained slightly below the overbought level. Looking ahead, with no major data expected from Europe, the pair will likely react to the durable goods data from the US.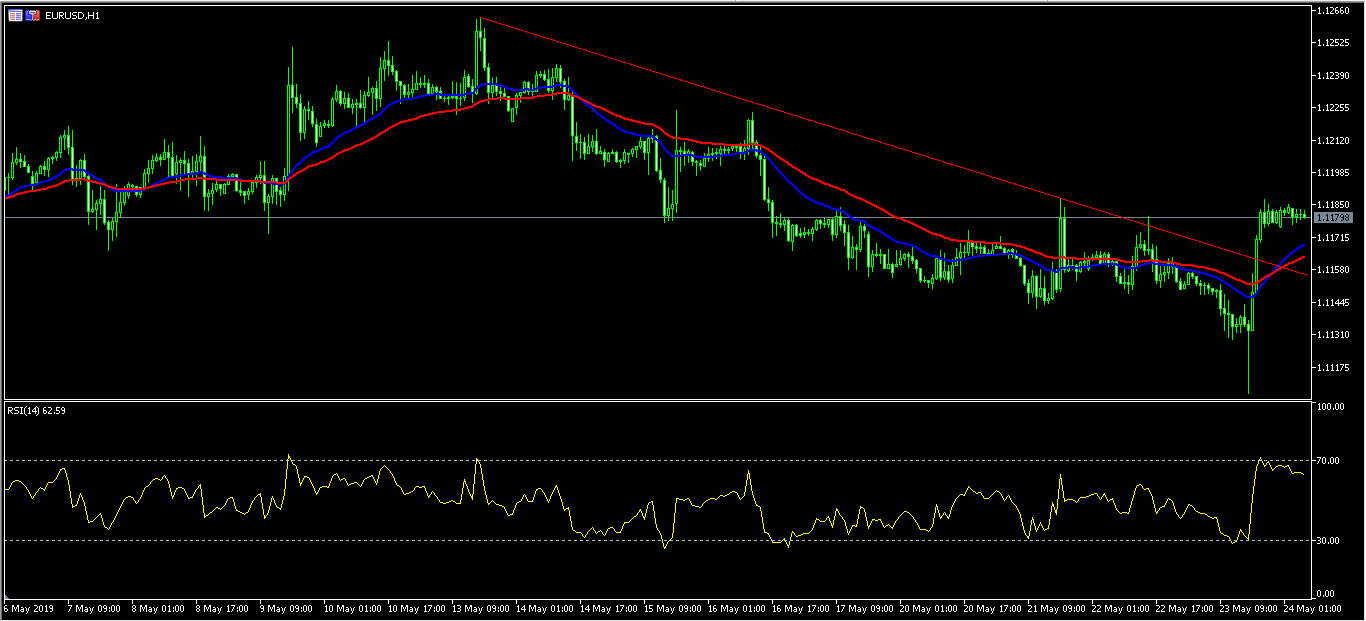
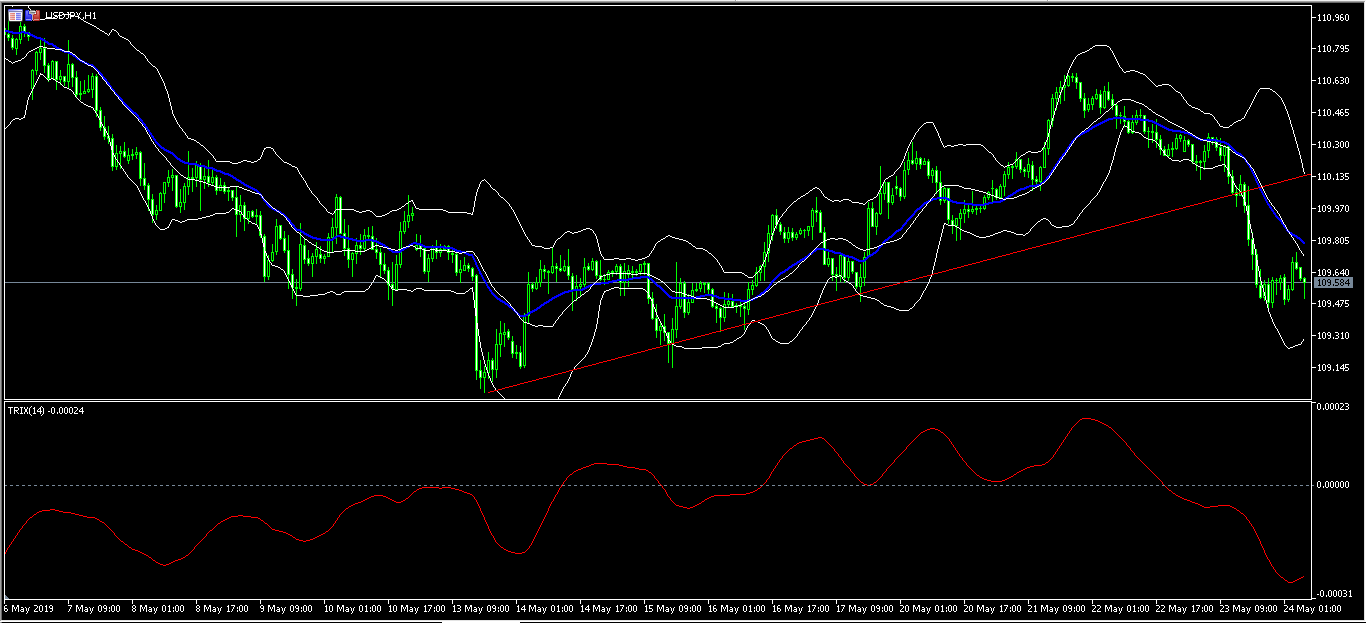
USD/JPY
After almost two weeks of gains, the USD/JPY pair started declining on Tuesday this week. The pair dropped from a high of 110.63 and reached a low of 109.45. On the hourly chart, the price is slightly below the 25-day moving averages and along the middle line of the Bollinger Bands. The triple exponential moving average has continued to decline. While the pair will likely continue to decline, there is a chanceof a recovery in the next few days