The price of benchmark crude oil prices declined to 2-week lows after the EIA released inventory data for the past week. Data showed that crude inventories dropped by more than 282K, which was a smaller decline than the 857k that investors were expecting. The inventories are 5% above the five-year average. In addition, the report showed that US production had climbed to more than 12.3 million barrels per day.
Stocks declined sharply after Donald Trump threatened fresh tariffs on Mexican goods. The new 10% tariff will take effect on June 10 and climb to 25% in October. The new tariffs are intended to push the country to deter the flow of asylum-seeking Central American families to the southern border. In response to the tariff threat, the Mexican President, Andres Manuel López Obrador asked for a deeper dialogue on the migration issue. He said that Mexico was doing whatever it could to curb the flow of migrants across Mexico. The new trade war with Mexico will threaten the gains made in the new NAFTA. It will also be a difficult one because Mexico is the third-largest trading partner with the US.
Earlier today, Asian countries released mixed economic data. In Japan, the CPI for Tokyo declined to 1.1% in May. This was slightly lower than the expected 1.2% and the previous 1.3%. The Tokyo core CPI declined to 1.1% from the previous 1.4%. Retail sales declined to 0.5% from the previous 1.0%. On a positive note, the industrial production rose by 0.5% on a MoM basis from the previous decline of -0.6%. The unemployment rate dropped to 2.4%. In China, the manufacturing PMI data from the China Logistics Information Center declined to 49.4 from the previous 50.1. A PMI number below 50 is a sign of contraction. Later today, investors will focus on the Canadian GDP data, US PCE data, and Germany retail sales.
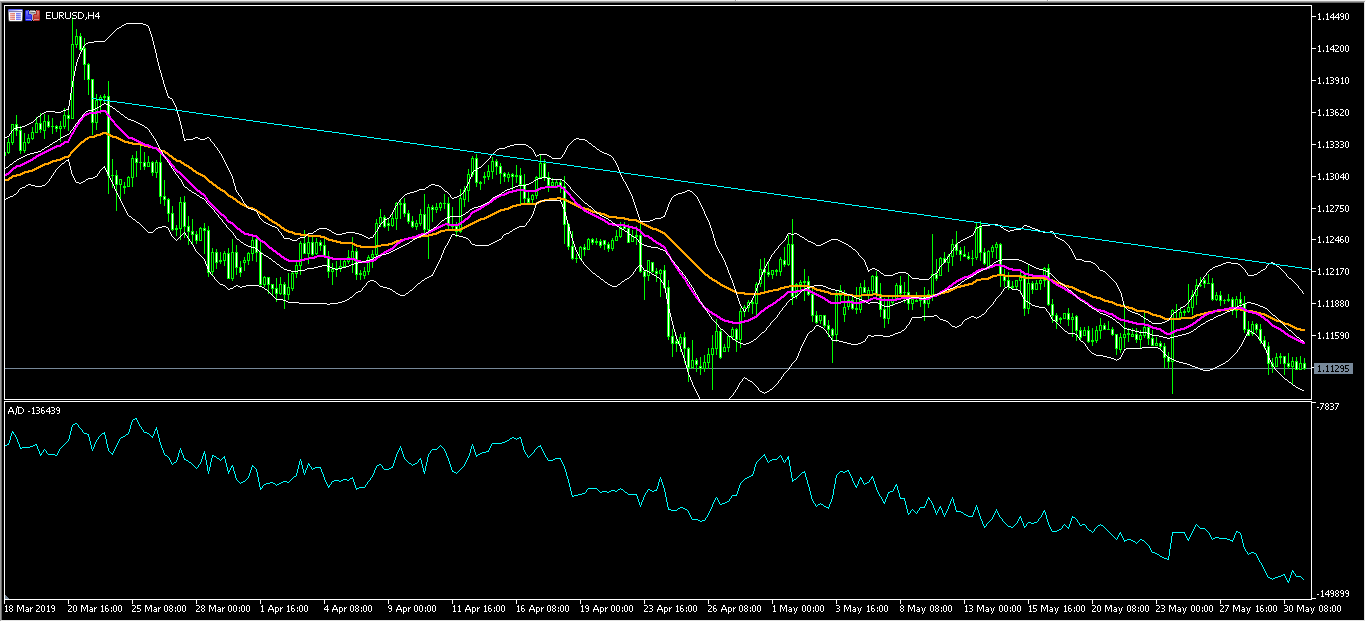
EUR/USD
The EUR/USD pair was relatively unmoved in overnight trading. It is now trading at 1.1130. On the hourly chart, this price is below the 25-day and 50-day moving averages while the accumulation/distribution indicator is moving lower. The price is slightly above the lower line of the Bollinger Bands. The pair could remain along these levels as the month comes to an end.
XAU/USD
The XAU/USD pair rose sharply after the announcement of Mexican tariffs by the US President. The pair reached a high of 1293.12. On the hourly chart below, the price is slightly above the 61.8% Fibonacci Retracement level. It is also slightly lower than the upper line of the Bollinger Bands. It is above the overbought level of 70. The MACD has continued to rise. Gold will likely continue rising as the trade war issues escalate.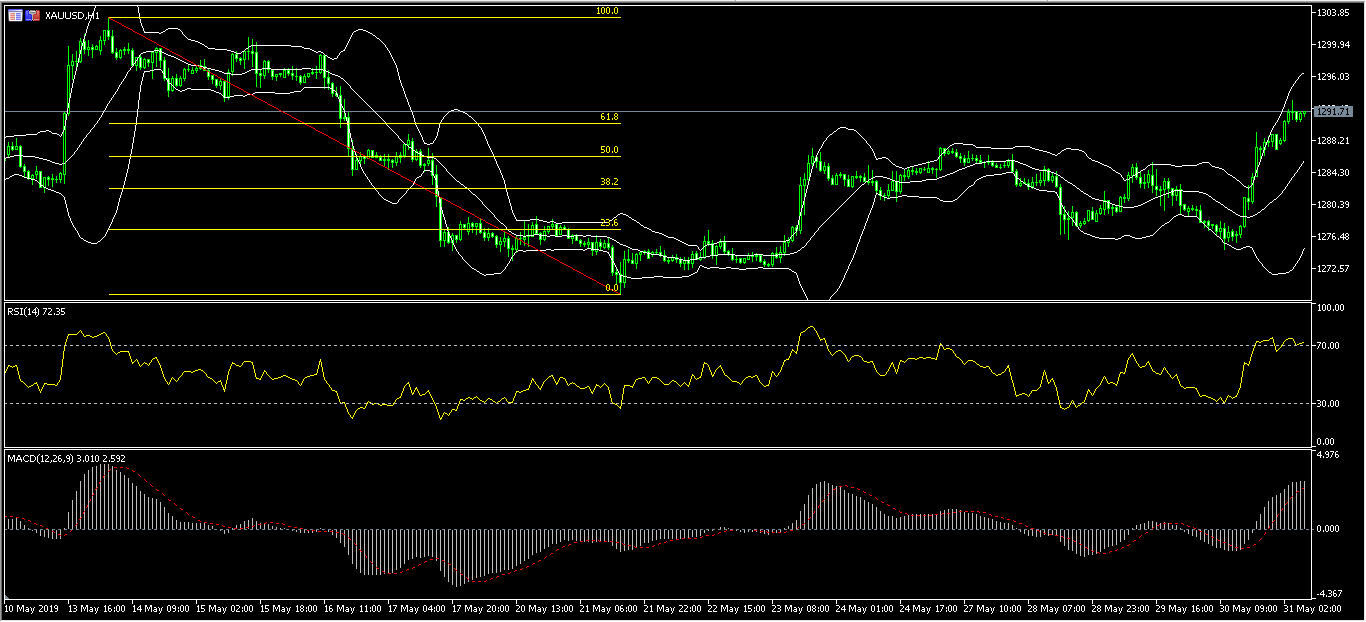
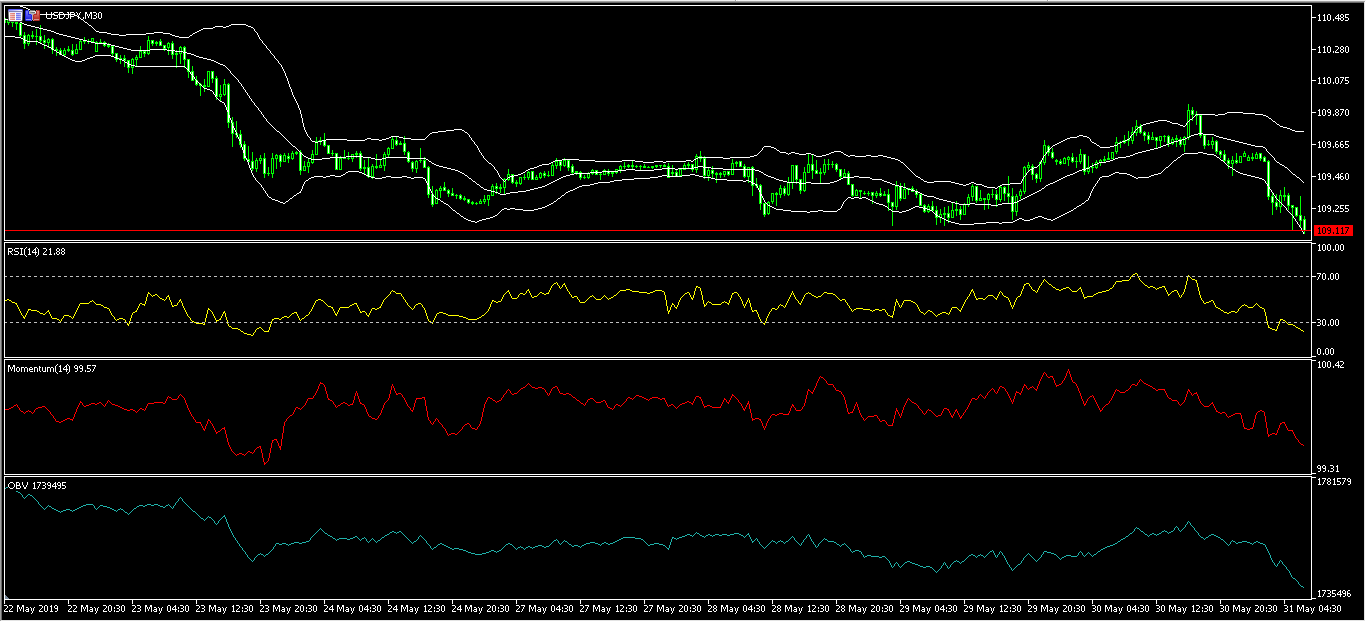
USD/JPY
The USD/JPY declined as traders moved to havens following the Mexican tariff threat. The pair reached a low of 109.11. On the 30-minute chart, the price is along the lower line of the Bollinger Bands. The RSI has dropped below the oversold level of 30. The momentum indicator and the on-balance volumes continue to decline. The pair will likely continue to drop to test the 109.00 level.