
The strong US payroll report for June raised doubts about the Fed’s easing outlook, boosting the dollar to multi-week highs to the detriment of precious and industrial metals.
Precious metals
GOLD is back below the $1,400 handle again after the strong nonfarm payroll data on Friday suggested the US economy might be doing just fine. The firmer US dollar on the back of higher yields hurt sentiment for gold, and the metal looks poised for its fourth daily drop in a row today.
Central banks continue to buy gold with the Peoples Bank of China revealing yesterday that it had increased its gold reserves for a seventh straight month in June, adding 10.3 million tons in the month. Poland had also said last week that it had more than doubled its gold reserves between 2018 and 2019. India hiked the import duty on gold to 12.5% from 10% in its 2019 budget last week.
Speculative investors increased net long positions for a fifth week to July 2, according to the latest CFTC data, driving them to the highest since September 2016.
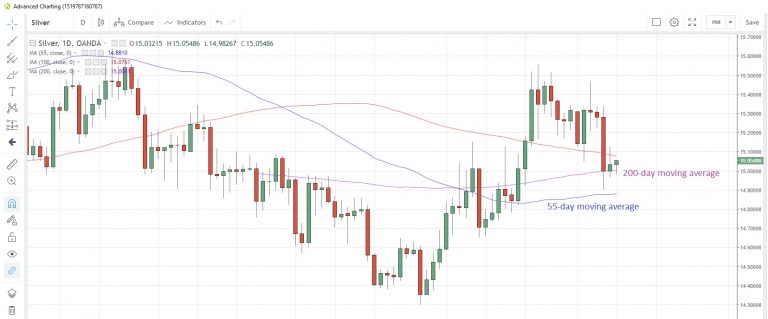
SILVER remains unfavoured versus gold, and is facing the prospect of a close below the 200-day moving average at 15.0039 for the first time since June 17. Speculative investors have turned net bearish in their positioning for the first time in five weeks, data to July 2 show. However, as at last Friday, physical silver holdings with exchange-traded funds were at the highest since November last year.
As mentioned above, silver is flirting with the 200-day moving average, with the 55-day moving average at 14.88 the next possible support point below. The gold/silver (Mint) ratio is hovering near record highs struck earlier this month.
Silver Daily Chart
PLATINUM holdings with exchange-traded funds increased by about 61,000 tons last week, according to a Bloomberg report, while speculative accounts increased their net long positions for a second week to July 2, and they are now at the highest since May 21, the latest data snapshot from CFTC shows.
Platinum is now at 809.62 as the 55-day moving average at 829.15 traded below the 200-day moving average at 830.39 yesterday for the first time since March 25. This crossover is often interpreted as a medium term bearish signal.
PALLADIUM looks poised to extend the decline from 3-1/2 month highs to a second day today as it plays victim to a resurgent US dollar. Speculative investors appeared to be correctly positioned for the last run higher, having been net buyers for a sixth straight week to July 2. Investors are most bullish on palladium since the week of March 26. Exchange-traded funds trimmed their physical palladium holdings by 8,600 troy ounces last week, Bloomberg reported.
Base metals
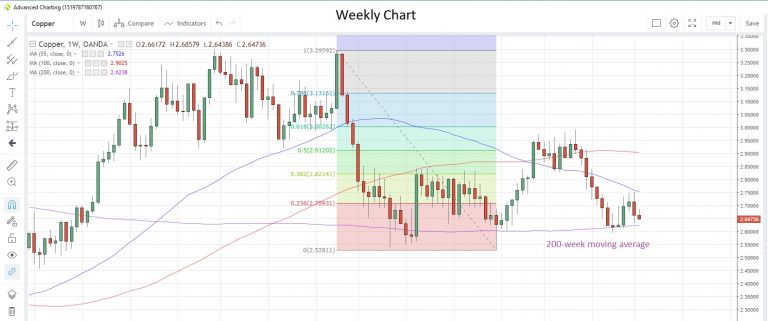
COPPER posted the biggest weekly drop since May last week, snapping a three-week winning streak, and the decline seems to be extending into this week. With the global demand outlook uncertain, copper stocks at warehouses tracked by the London Metal Exchange were at the highest since June 2018 last Friday, while China reported that its output had increased by 15% to 728,300 tons in June from a month earlier.
Speculative investors remain bearish, increasing net short positions for a second straight week in the week to July 2, latest CFTC data show. Copper is edging toward the 200-week moving average support at 2.6238, which has held on a closing basis since September last year.
Copper Weekly Chart
Energy
CRUDE OIL is struggling to maintain last month’s gains, despite the extension of production cuts into 2020 by OPEC and its allies, as the demand outlook remains uncertain. A smaller-than-expected drawdown of US stockpiles last week is also adding to supply pressures, though Middle East tensions could offer some support to prices.
Russia’s Energy Minister has calculated that the extension to the OPEC+ deal to next year would deliver about 3.5 trillion rubles ($54.6 billion) to the 2019/20 budget.
NATURAL GAS posted the biggest one-day gain since January 14 on Friday after the latest weather forecasts were released. Heatwave temperatures are expected across the US for the July 13-17 period and this prompted buying of the commodity.
Weekly gas stockpiles data to July 5 will be released on Thursday, and are expected to show an increase of 94 billion cubic meters (bcm), up from 89 bcm the previous week.
Speculative investors trimmed their net short positions for the first time in five weeks in the week to July 2, according to CFTC data. Investors have been net bearish on the commodity since February, though prices have trade in a narrow 2.90-2.45 range since then.
Agriculturals
SOYBEANS continue in consolidation mode after the May-June rally, having fallen for a second consecutive week last week. It is now one year since China imposed the last import tariffs on US soybeans, and prices since then have seen some volatility but are now just 0.14% lower than the start of July 2018. Soybean prices are currently at 8.708, hovering above the 55-week moving average at 8.6954, which has supported prices on a closing basis since early-June.
Soybeans Weekly Chart
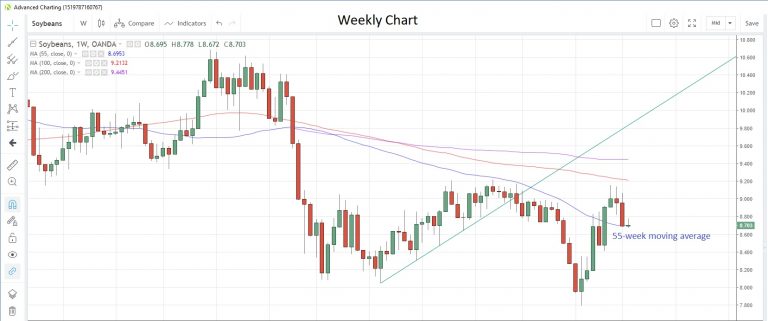
Latest US weather patterns are producing some crop-friendly rains in the growing areas, which could improve supply. Speculative accounts turned net bullish on soybeans for the first time since February, CFTC data to July 2 show.
CORN looks poised to break a four-day rising streak that took the commodity to the high for this month. Hot and dry US weather had threatened corn crops, which drove the rally but speculative investors had turned net sellers for the first time in nine weeks in the week to July 2, pulling net long positions from a 13 month high.
A US Department of Agriculture (USDA) report published Friday estimated that Brazil’s corn output could rise 25% to a record high 101 million tons in the current season.
SUGAR prices have been confined to a relatively tight range for the past two weeks with no particular trend or direction apparent. There is still a hefty global supply glut, which will likely keep a lid on prices in the near future.
To combat sugar overproduction in India, producers in Maharashtra have asked for permission from the central government to convert the sugar surplus to ethanol. Meanwhile, last month the USDA predicted that Nigeria’s sugar imports will increase by 20,000 tons in the 2019-20 season, a 1% increase from the previous one.
Speculative investors’ positioning turned net long for the first time since the week of April 23 as they remained net buyers for the fifth week in a row, according to CFTC data.
Speculative accounts were also net buyers of WHEAT for the ninth consecutive week in the latest reporting week. Net longs are now at the highest since September 2018.


