
U.S. Highlights
- There was good news in the trade negotiations between the U.S. and China this week as the President announced a postponement of tariffs and China exempted key agricultural goods (pork and soybeans) from existing tariffs.
- The European Central Bank lowered its key policy rate further into negative territory this week and announced a plan to restart asset purchases that will continue “for as long as necessary” to bring inflation back to target.
- U.S. core inflation picked up in August and retail sales beat expectations. Even so, the Fed is likely to cut rates by 25 basis points when it meets next week, likely citing global growth and trade headwinds.
Canadian Highlights
- Housing starts surpassed expectations in August, driven higher by an advance in both single and multifamily units. The uptick in new construction since spring has coincided with an improvement in underlying fundamentals.
- Household balance sheets strengthened in the second quarter, as both financial and non-financial assets increased. The household debt-to-disposable income ratio fell for a third straight quarter as income growth outpaced debt.
- Higher interest rates are taking a good bite out of household disposable incomes. However, some relief is likely in the quarters ahead as the recent fall in mortgage rates translates into lower mortgage interest payments.
U.S. – Optimism on Trade Deal Lifts Markets
Financial markets turned optimistic this week on signs of progress in trade talks between China and the U.S. On Wednesday, President Trump tweeted that “as a gesture of goodwill” the tariff hike scheduled for October 1st (moving the rate from 25% to 30% on over $200 billion in Chinese imports) would be postponed until October 15th. China responded by exempting U.S. pork and soybean exports from its 25% agricultural tariffs.
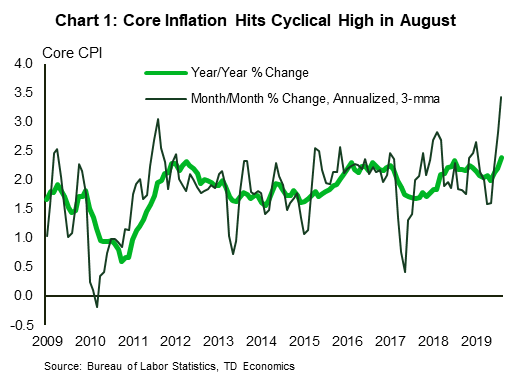
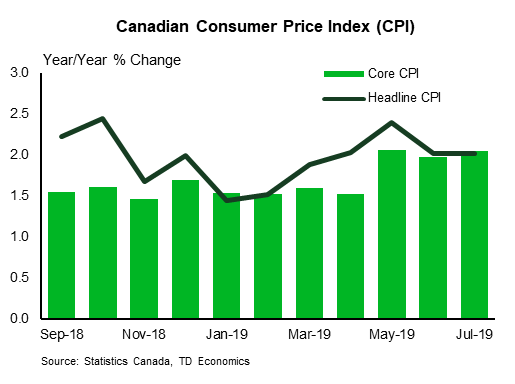
In other Presidential tweets, Trump once again advised the Fed to cut rates, this time adding “to zero or less”. The president cited “no inflation” as justification. Only a day later, the consumer price index (CPI) data for August showed a pick-up in the core rate of inflation (excluding food and energy) to 2.4% year-on-year (y/y), its highest level since the recovery began (Chart 1). On a three-month moving average basis, core prices are up 3.4% (annualized), a noticeable breakout from the past several years. As much as it is a sign that a hot economy, rising prices also reflect the impact of tariffs. Core goods prices were up 0.8% (y/y) in August, the fastest gain in over seven years.
Trump’s admonishment of the Fed came prior to the ECB’s decision on Wednesday to lower its deposit rate by 10 basis points to a new low of negative 0.5%. The ECB’s decision, however, is a reflection not of economic strength, but of weakness. Right on cue, data showed Euro area industrial production pulled back by 0.4% in July. Inflation in Europe is also lower than in the U.S., hovering close to the 1% mark. The serial disappointment on inflation led the ECB to announce a plan to leave rates unchanged “until it has seen the inflation outlook robustly converge” to its target. President Draghi, in his press conference, said that the ball is now in fiscal policy’s court and expressed hope that governments would respond with additional spending to support the economy and return inflation to target.
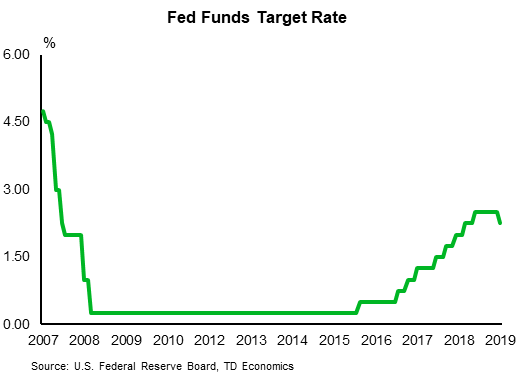
Turning back to the U.S., the President won’t have to wait long for the next interest rate decision. The Federal Open Market Committee (FOMC) meets next week and will likely deliver a 25-basis point cut. The FOMC is likely to look through the tariff-related increase in consumer prices, but with an unemployment rate at 3.7% there is little at present to motivate a full-blown cutting cycle. The meeting will come with updated economic projections. Perhaps even more than its near-term forecasts, we’re looking for the migration in the Fed’s long-term projections for the fed funds rate and the unemployment rate, which may validate at least some of the decline we’ve seen this year in bond yields and provide a sense of where policy may land in the coming months and quarters.
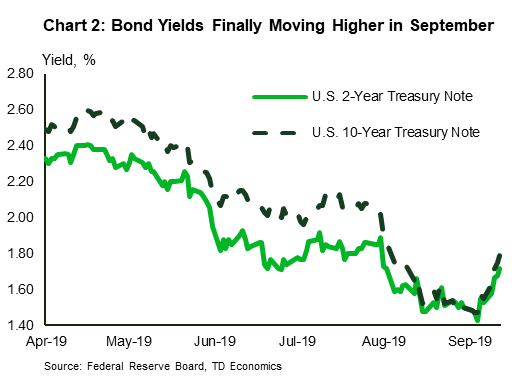
With inflation showing a bit more momentum and signs that an ever-worsening trade war may not be the most likely outcome, bond investors may be starting to reassess just how low the Fed will go. Yields have rebounded through the month of September (Chart 2) and providing the economy can avoid a recession, some further increases may still be ahead.
Canada – More Signs of a Strengthening Household Sector
With the election writ drawn up this week, news headlines over the next five weeks will be increasingly dominated by electoral promises leaving economic indicators likely to play second fiddle. Nevertheless, in an era where a single tweet can shift market sentiment from boom to gloom it’s important to keep track of the pulse of the Canadian economy as suggested by the flow of indicator data.
This week’s data showed a Canadian economy that has rebounded to a healthy pace of expansion in the middle of this year. Booming new residential construction is helping lead the way. About 227k units were started in August, mostly multifamily units. Single-detached home starts continued to stage a rebound after slumping earlier in the year. The advance was generally broad-based, with all regions experiencing an improvement except British Columbia, which saw starts pullback after several months of strength. Overall, it appears that the lull in new residential construction following the B-20 regulations at the start of 2018 is now in the rearview mirror.
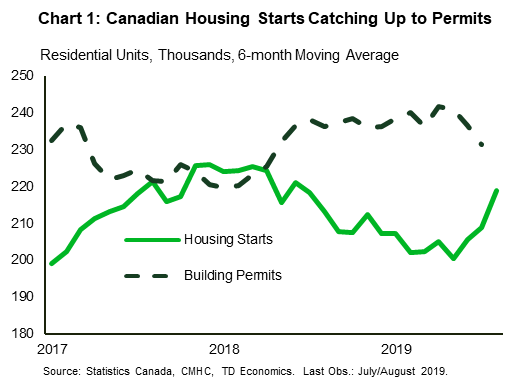
Unsurprisingly, the uptick in new construction this spring has coincided with an improvement in the fundamental drivers of housing demand. Employment and income growth have outperformed expectations, population growth has been robust, and borrowing costs have decreased. Looking at the gap between residential housing permits and new construction it appears that the recent uptick in new construction has more room to run (Chart 1). With demand conditions improving, it’s good to see housing supply picking up.
An improvement in household balance sheets in the second quarter is another sign that Canadian households are proving resilient. Household net worth rose in the second quarter, as both financial and non-financial asset values rose. Household debt also rose in the quarter. Nevertheless, the household debt-to-income ratio ticked lower to 177.1% (seasonally adjusted), the third consecutive decline as household disposable income growth outpaced the growth in debt.
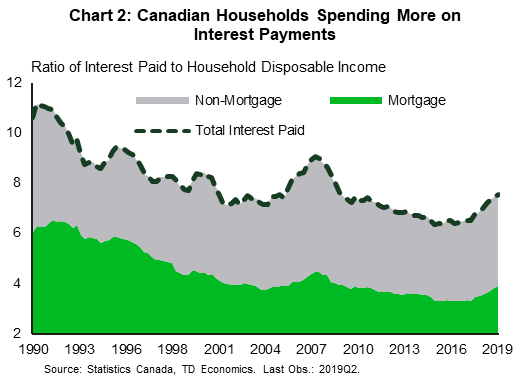
Even so, higher interest rates are taking a bite out of the disposable incomes of households. The debt service ratio climbed higher to 14.9% in the quarter, a new all-time high. Debt service includes both principal and interest payments. Disaggregating the ratio into its components reveals that the recent uptick has largely been driven by interest payments – a reflection of past increases in interest rates. Overall, mortgage and non-mortgage interest payments now comprise about 7.5% of household disposable income, the highest share since prior to the 2009 recession when interest rates were a lot higher (Chart 2).
Since a good chunk of disposable income is going to pay off past spending, households have had less income to spend on new goods and services over the last couple of years. But, the recent fallback in global bond yields has seen domestic mortgage rates decline. This will gradually translate into lower mortgage interest payments as the stock of mortgages rolls over, providing some relief for households. Overall, this should provide more support for consumer spending in the quarters ahead.
U.S: Upcoming Key Economic Releases
U.S. FOMC Rate Decision
Release Date: September 18, 2019
Previous: 2.00-2.25%
TD Forecast: 1.75-2.00%
Consensus: 1.75-2.00%
We expect the Fed to lower rates again by 25bp next week, doubling-down after its first rate cut in over a decade at the July meeting. The FOMC will likely continue to characterize the additional accommodation as a “mid-cycle adjustment” or “insurance cuts” and not the beginning of an easing cycle. However, they will not close the door to additional cuts, and we look for another 25bp cut before the year is through. The dot plot should reflect a number of FOMC voters projecting 75bp of total easing for this year, but not enough to move the median lower to that level. Presidents George and Rosengren should dissent again at the meeting.
Canada: Upcoming Key Economic Releases
Canadian Manufacturing Sales – July
Release Date: September 17, 2019
Previous: -1.2%
TD Forecast: -0.2%
Consensus: NA
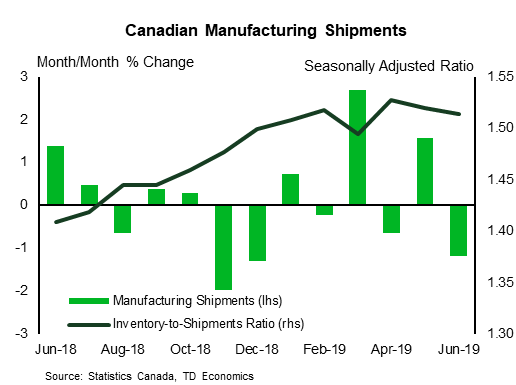
Manufacturing sales are forecast to edge lower by 0.2% m/m in July which would result in the first decline on a year-ago basis since mid-2016. Export activity was mixed for July with gains in 6 of 11 product groups but labour market data was far more downbeat, with 6k fewer manufacturing jobs and a sharp pullback in total hours worked. This alongside weaker PMI data points to another pullback in the headline series although, like June, real manufacturing sales should outperform the nominal print owing to lower factory prices.
Canadian Retail Sales – July
Release Date: September 20, 2019
Previous: 0.0%, ex-auto: 0.9%
TD Forecast: 0.9%, ex-auto: 0.6%
Consensus: NA
The Canadian consumer will make a comeback in July with retail sales forecast to rise by 0.9% m/m. Motor vehicles will provide a source of strength on a solid increase in preliminary auto sales, which should benefit from the recent recovery in the housing market and consumer sentiment. Gasoline stations sales will also provide a tailwind on higher prices, while core (ex. auto & gas) sales should see more modest gains on the heels of a 1.7% increase in June – the largest since 2016. Retail volumes should rise by roughly 0.5% owing to a sizeable increase in consumer goods prices, which will provide an anchor to Q3 household consumption after the soft performance in Q2.

Canadian CPI- August
Release Date: September 18, 2019
Previous: 0.5% m/m, 2.0% y/y, Index: 137.0
TD Forecast: -0.3% m/m, 1.7% y/y, Index: 136.5
Consensus: NA
Headline inflation is set to slip below target with a pullback from 2.0% to 1.7% y/y in August, with prices down 0.3% on the month. Lower gasoline prices will provide the main catalyst for the deceleration with a 4% decline in the price at the pump, which would contribute to a larger (0.28pp) drag from energy on a year-ago basis.This headwind is set to intensify to 0.4pp by September before base effects from the 2018Q4 collapse in oil prices bring about a rapid recovery on a year-ago basis.
Elsewhere, we look for a modest decline in food on a pullback in agricultural prices while the core component will be weighed down by an anticipated giveback in airfares following last month’s 14% increase. Previous instances of similar strength have seen outsized corrections in the following months, but the timing can be difficult to ascertain, leaving us to pencil in a partial correction. In contrast to airfares, last month’s 7% increase in travel services looks to be driven largely by seasonal factors and we should not expect any meaningful correction until Q4.
With the pullback on headline CPI driven in large part by outsized swings in two components, we do not expect the same impact on core CPI measures that a broad decline in pricing pressures would indicate. The Bank of Canada’s preferred core metrics are expected to hold at 2.0% y/y on average for August, while the ex. food & energy measure should edge lower to 2.0% from 2.1% y/y.


