US stocks ended lower as trade optimism faded. The Dow lost more than 300 points while the Nasdaq lost more than 100 points. Tensions returned after the Trump administration placed a ban on 28 Chinese companies in relation to the treatment of Muslim minorities in the country. Today, the administration said that it had placed visa restrictions on senior members of the Communist Party of China who were responsible for the poor treatment. The US has claimed that the new restrictions are not in any way related to the trade issues. Asian stocks declined too with the Nikkei and Hang Seng declining by 150 and 52 points respectively.
The price of crude oil was relatively unchanged in the Asian session. This is after the American Petroleum Institute (API) released inventories data for the past week. Numbers showed that inventories rose by more than 4.1 million barrels. This is after last week’s decline of more than 5.9 million barrels. Today, the EIA is expected to release the official inventory numbers. Data is expected to show that inventories rose by more than 1.43 million barrels. This will be lower than last week’s increase of more than 3.1 million barrels. Distillate stocks are expected to decline by more than 2.1 million barrels.
The focus will remain on the United States where the impeachment proceeding against Donald Trump is continuing. Overnight, the White House sent a letter to Congress saying that it will not participate in the inquiry. Meanwhile, Johnson & Johnson will be the stock to watch after a jury ordered it to pay $8 billion on opioid-related issues. This was another loss for the company, which has seen legal costs increase. Later, the Fed will release the minutes of the last meeting. These minutes are important because they give traders a feeling of what is going on in the minds of the policymakers.
XBR/USD
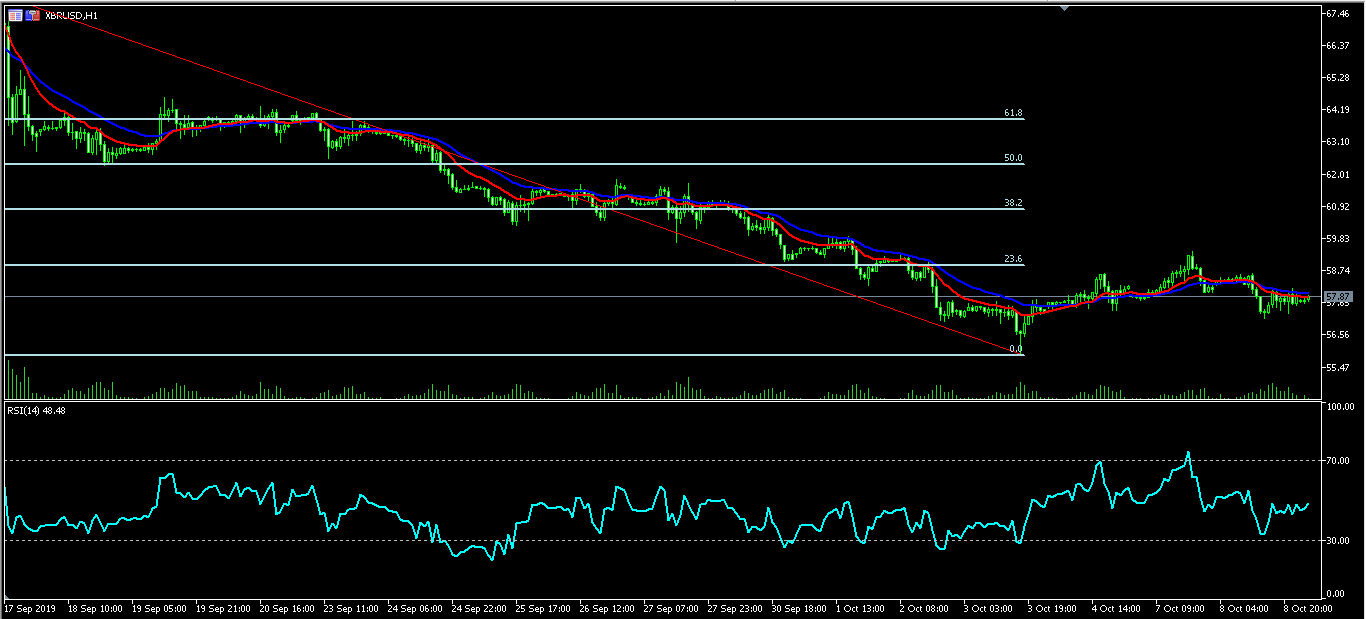
The XBR/USD pair remained unchanged at 57.76 as traders focused on inventories and the state of the economy. On the hourly chart, the price is slightly lower than the level it was when the Saudi terminal was attacked. The price is along the 28-day and 14-day moving averages while the RSI has remained at the neutral level of 50. The price is slightly below the 23.6% Fibonacci Retracement level. The pair might remain in a holding pattern ahead of the EIA data.
EUR/USD
After a sharp decline in the American session, the EUR/USD pair rose slightly in the Asian session. The pair rose from a low of 1.0940 to the current 1.0965. This price is between the 38.2% and 50% Fibonacci retracement level. The decline yesterday took the pair below the support line of the ascending triangle. It’s possible that the pair will breakout in the upward direction. This is usually what happens in most ascending triangles.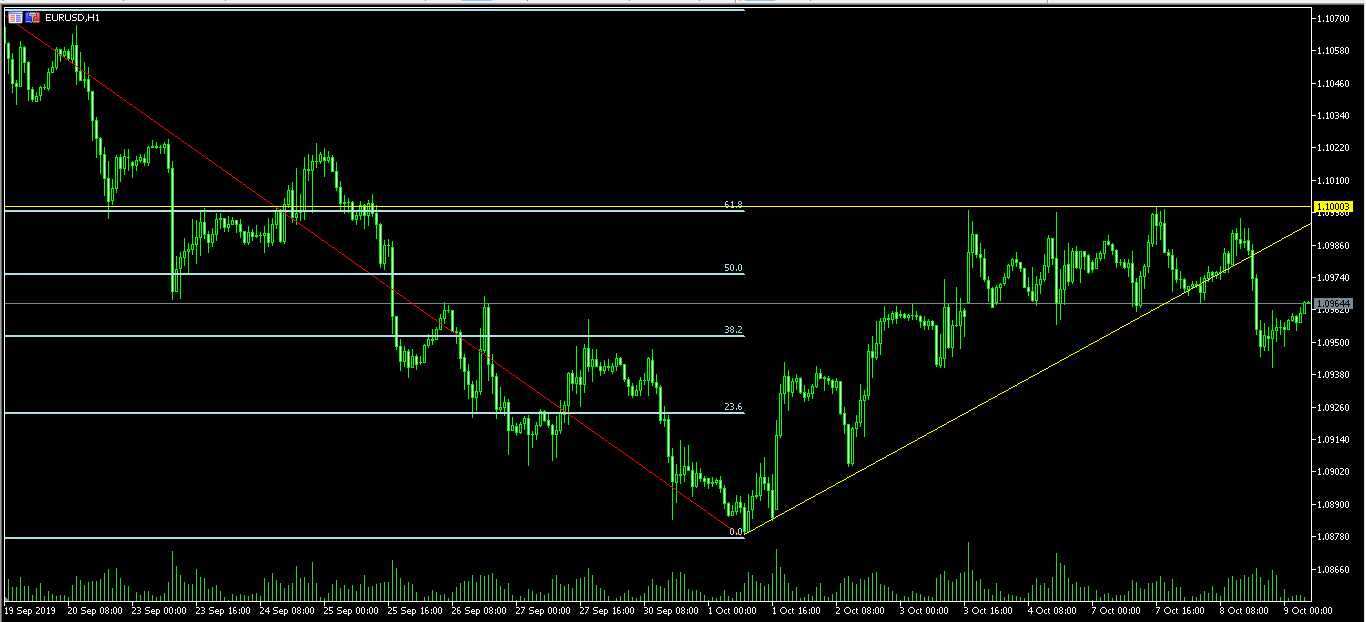
EUR/GBP
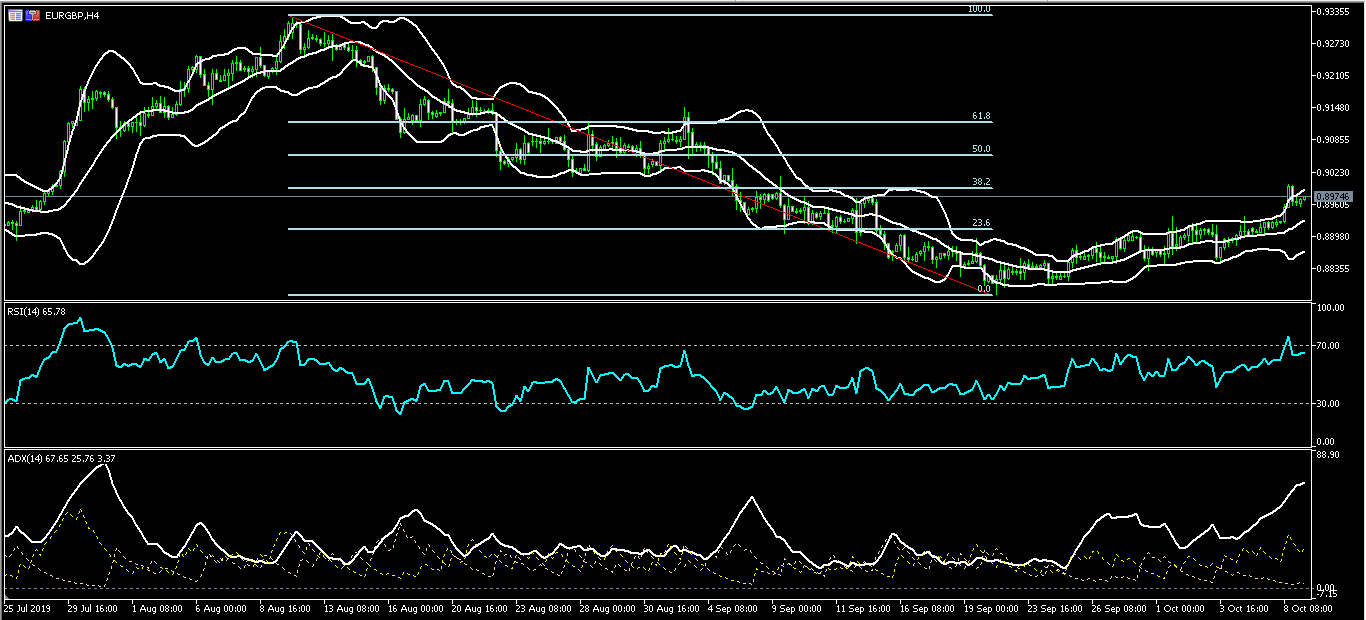
The EUR/GBP has been rising as the hopes of a Brexit deal fades. The pair is trading at 0.8973, which is along the upper line of the Bollinger Bands. The price is slightly below the 38.2% Fibonacci Retracement level while the RSI has been moving on an upward trend. The average directional index too has been climbing. It’s likely that the pair will continue the upward trend.