The price of crude oil declined after the EIA released inventories data for the previous week. The numbers showed that inventories increased by 2.219 million. This was lower than last week’s number of 7.92 million but higher than the consensus estimates of 1.649 million. Gasoline inventories increased by 1.8 million barrels while distillates declined by more than 2.4 million barrels. The price of crude oil has been choppy in recent weeks as the market focuses on several issues. Firstly, last week’s optimism on trade appears to be easing off. Secondly, US production has been rising and finally, the market is waiting for the annual OPEC meeting in Vienna.
The focus will be on Europe, which will release its inflation numbers for the month of October. Numbers are expected to show that headline consumer prices remained unchanged at 0.7% in October. On a MoM basis, the numbers are expected to remain at 0.2%. The core CPI is expected to have increased by 1.1% in October while trade surplus is expected to have increased to EUR 17.5 billion. These numbers will come a day after the region released positive GDP data for the third quarter. GDP rose by an annualised rate of 1.2%, which was better than the second quarter’s growth of 1.1%.
The market will also focus on the United States, which will release its retail sales data for October. The market expects the numbers to show that retail sales increased by 0.2% after contracting by -0.3% in September. Core retail sales are expected to increase from -0.1% to 0.4%. The export price index is expected to decline by -0.1% while the import price index is expected to decline by -0.2%. These numbers come a day after the market heard from the Fed chair. Jerome Powell said that the Fed was not inclined to slash rates again this year.
EUR/USD
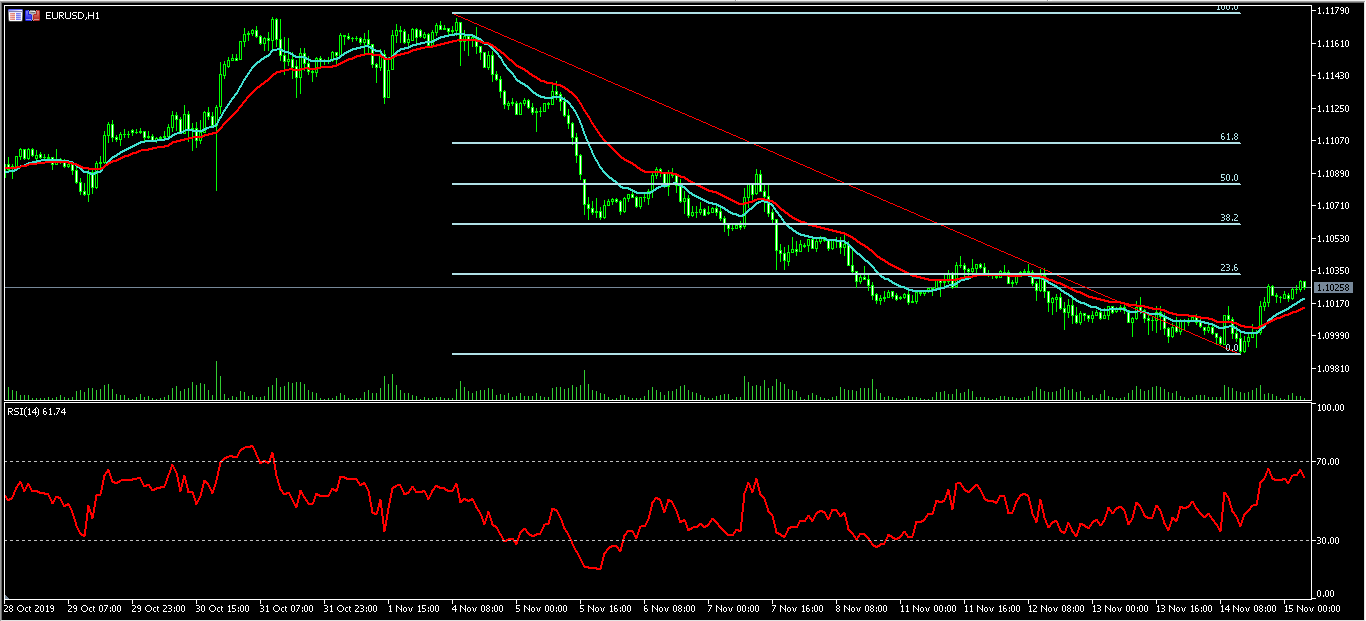
The EUR/USD pair started an upward trend yesterday when it reached a low of 1.0988. It reached a high of 1.1030, which was the highest level since Tuesday this week. On the hourly chart, the pair is trading above the 14-day and 28-day moving averages. The two averages have made a bullish crossover. The RSI has also been moving upwards and is now at 60. The pair may continue to move higher as it attempts to test the 38.2% Fibonacci Retracement level of 1.0600.
XBR/USD
The XBR/USD pair is trading at 61.89. This is lower than yesterday’s high of 62.58 and slightly higher than yesterday’s low of 61.54. On the hourly chart, the price is slightly below the middle line of the Bollinger Bands while the average true range has declined. The price is slightly above the 61.8% Fibonacci Retracement level. The pair will likely end the week slightly below or above the important resistance level of 62.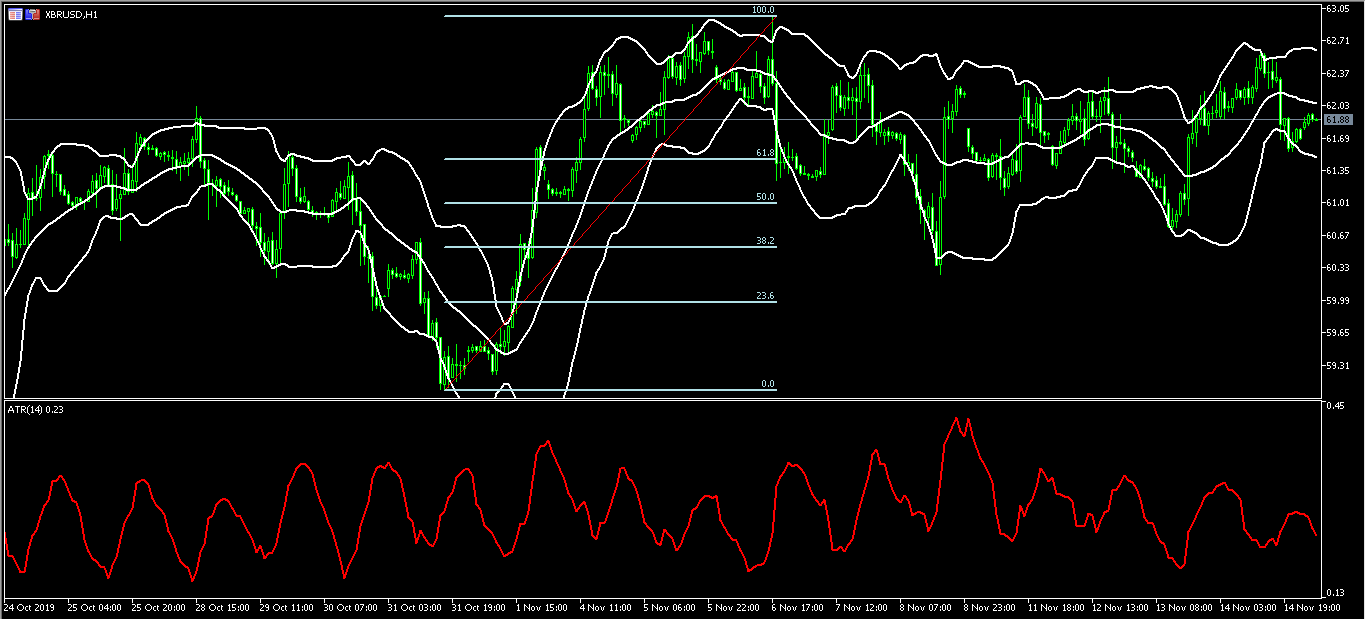
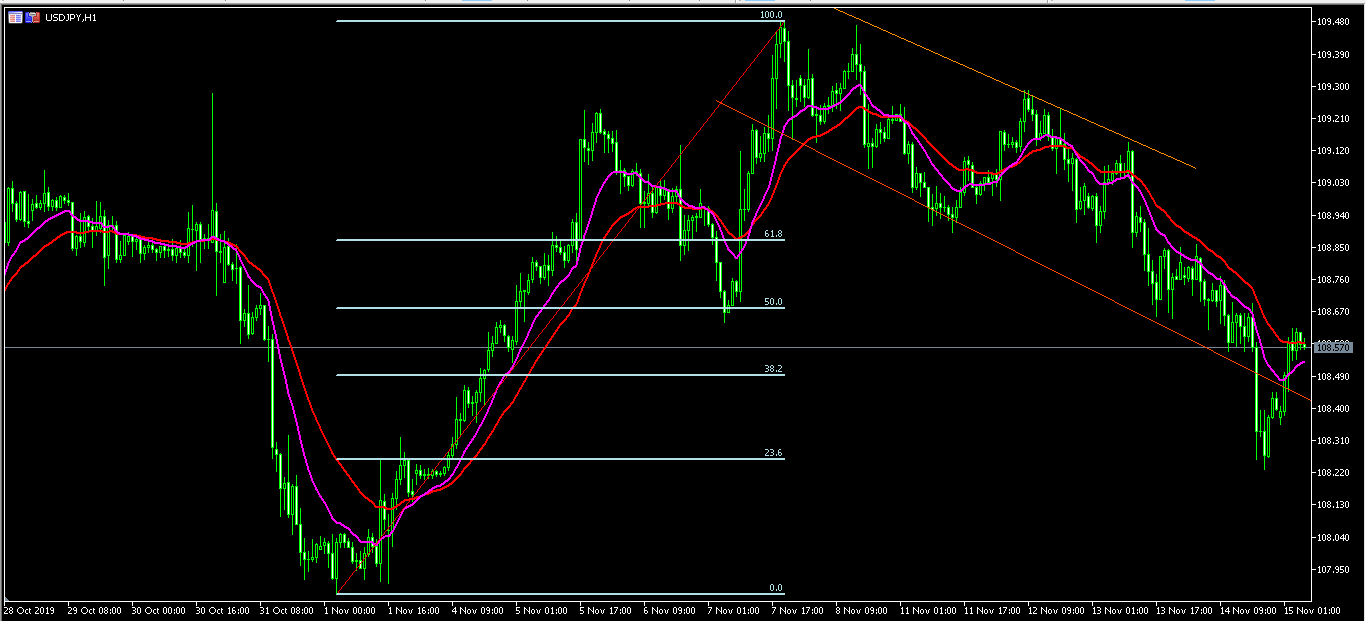
USD/JPY
The USD/JPY pair dropped sharply in the Asian session. The pair reached a low of 108.22, which is along the 23.6% Fibonacci Retracement level on the hourly chart. The pair then made some recovery and is now trading at 108.57, which is between the 38.2% and 50% Fibonacci Retracement level. The pair’s decline saw it move past the lower line of the previous channel. The price is along the 14-day moving averages and slightly higher than the 21-day moving averages. The pair may remain at the current levels ahead of the US retail sales data.