
- Rising tensions from the U.S. killing of Iranian General Soleimani had all the hallmarks of the sort of crisis that could weigh on financial markets.
- But, with both sides acknowledging no plans for further escalation, what seemed like a crisis in the immediate aftermath of Soleimani’s killing has already moved to the back burner.
- The direct effects of the Iranian crisis on the U.S. economy appeared to be rather small. However, the uncertainty that the crisis imparts could potentially be more meaningful.
- In this report, we analyze to what extent consumer spending might potentially take a more meaningful dive if a marked cycle of violence were to take hold.
- Our take: Consumer spending is actually remarkably resilient even in the midst of challenging times.
What Do Uncertain Times Mean for Consumer Spending?
What just days ago felt like a crisis has already moved to the back burner. Rising tensions from the U.S. killing of Iranian General Soleimani earlier this month had all the hallmarks of the sort of crisis that could weigh on financial markets and heap-on additional uncertainty in times that were already far from settled. Iran responded this week with non-lethal airstrikes on U.S. facilities, but President Trump has said the U.S. has no plans to escalate further and the Iranians appear to have concluded their response for now.
Financial markets have more or less settled back to where they were prior to the start of recent hostilities a week ago. Oil prices spiked on the initial news, but quickly settled down and as of this writing the price for crude oil is actually lower than it was prior to the U.S. drone strike that killed the Iranian general. However, if tensions flare again, investors instinctively turn to oil prices as a risk barometer raising questions about potential knock-on effects for the economy.
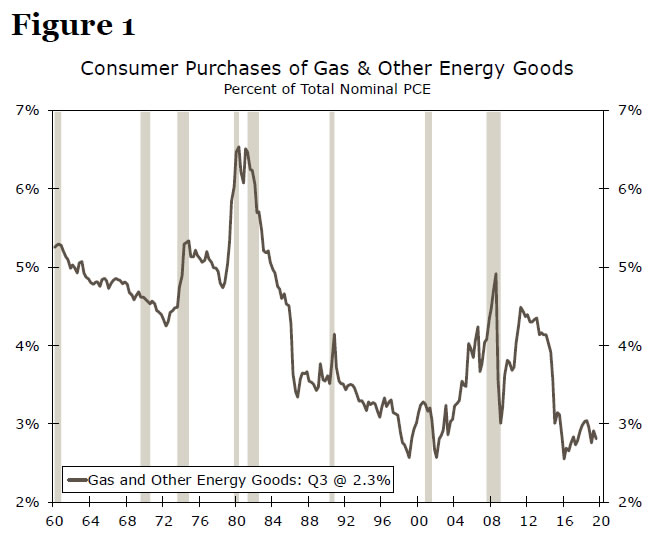
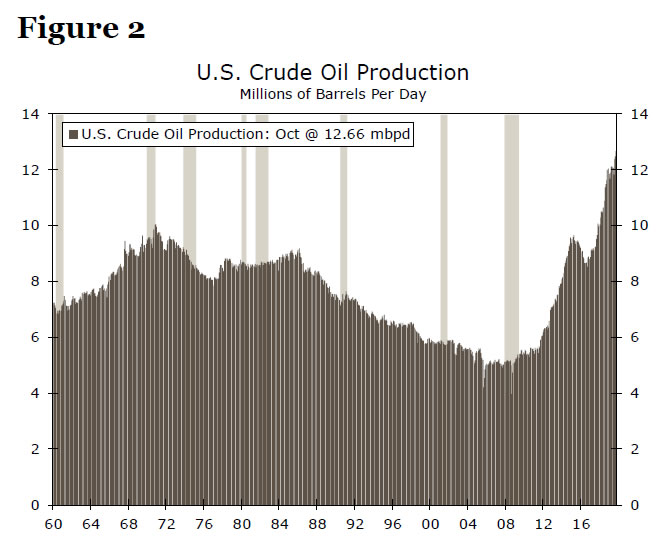
We have already written about how consumer purchases of gasoline and other energy goods today account for only about half the share of consumer spending that it did at the time of the oil price shocks in the 1970s (Figure 1). Also because American production of crude oil has increased over the past decade (Figure 2), higher oil prices could actually encourage more investment in the energy sector. What’s more, other industries are not as dependent on oil as an energy source as they were in the 1970s. So the direct effects of the Iranian crisis on the U.S. economy appear to be rather small.
However, the uncertainty that the crisis imparts could potentially be more material. To what extent might consumer spending potentially take a more meaningful dive if a marked cycle of violence were to take hold? Our review of published research on the topic and our own statistical and econometric analysis suggests consumer spending is actually remarkably resilient even in the midst of challenging times.
Spending is Mostly Services and Service Spending is Steady
Personal consumption expenditures (PCE) fall into two broad categories of goods and services but the split is not equal. Services-related spending accounts for two thirds of all spending, leaving just 33 cents of each dollar spent to pay for goods.
Services spending may not be completely impervious to uncertainty but it is certainly resilient. No matter how worried people get, they seldom take a cold shower in the dark as a way to cope. People might put off a vacation which is why recreational services tend to get cut during a downturn. This is not unlike how RV-purchases tend to crater during a recession; both categories as we shall see in a moment are holding up rather well at present. However outlays on things like housing and utilities, basic financial services and healthcare tend to underpin services outlays, which helps explain why even during recessions, services PCE seldom posts a decline and even when it does, the declines are typically small (Figure 3).
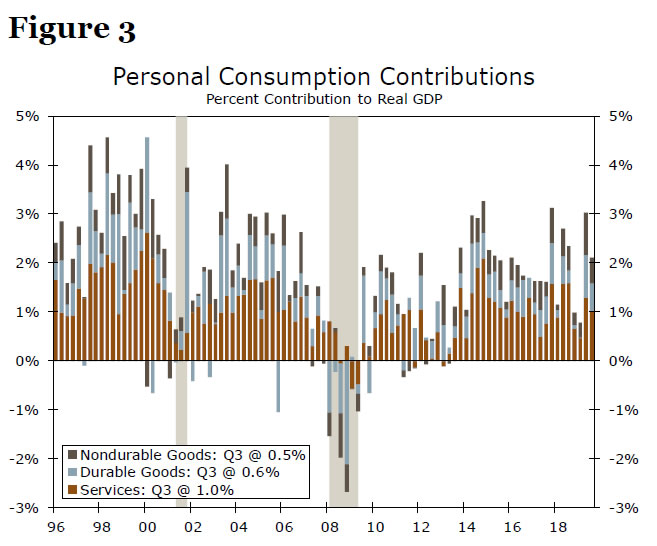
Spending on long-lasting durable goods can be more mercurial as can spending on shorter-lived consumer products like food, clothing and footwear. Figure 3 also shows how these categories nosedived during the 2008-2009 recession and were hot-and-cold around the time of the 2001 recession (durable goods eventually got a boost in that period thanks to the Keep America Rolling auto incentives from the Federal Government). 1
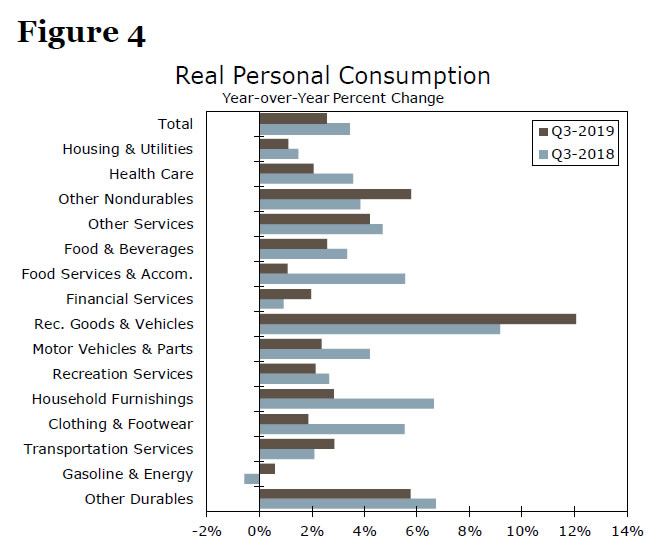
In the current cycle, despite ongoing uncertainty due to the trade war and the specter of tariffs on consumer goods, outlays in this cycle have remained fairly strong across the board (Figure 4). Those threatened tariffs ended up not going into effect in December as originally planned thanks to an 11th hour trade deal.2 Through the third quarter of 2019, all categories of consumer spending are up, to varying degrees. This chart plays particularly well in Elkhart, IN, “the RV capital of the world.” Despite all the hand-wringing during the summer and early autumn over the inverted yield curve, the trade war and the possibility of recession, recreational goods and vehicles lead the gains by category just as they did in the prior year. So uncertainty does not appear to be any kind of a problem at present.
Analysis of Prior Periods of Uncertainty
So far, we have suggested that service spending tends to be resilient to uncertainty, whereas goodsrelated spending can be more vulnerable. Another way to think about this is to break down spending into discretionary and non-discretionary categories. An added virtue of this approach is the high frequency dataset which is better to observe the precise impact of specific events.
The Bureau of Economic Analysis (BEA) offers a monthly time-series on personal spending broken out by detailed category. We divided those categories into discretionary and non-discretionary groupings and then plotted the year-over-year growth of both of these categories in Figure 5.3
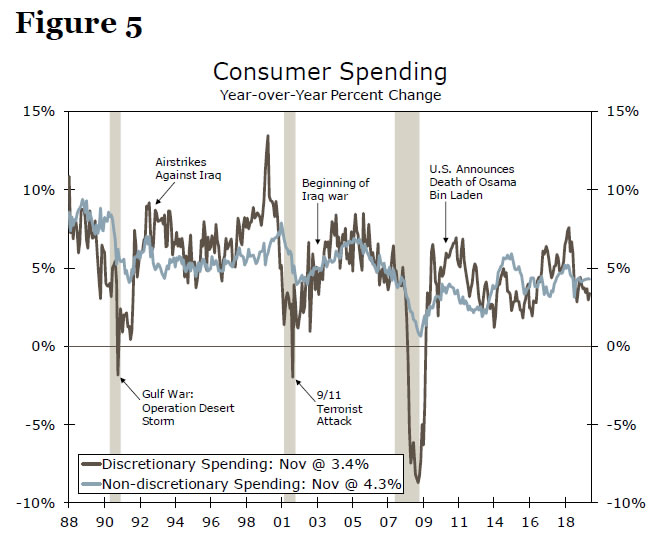
A few things are immediately evident from this exercise. Non-discretionary spending is generally steady and while consumers may pare back their pace of consumption in times of uncertainty the ‘necessary’ nature of this spending category prevents its growth from turning negative in an economic downturn. The same cannot be said for discretionary spending. Discretionary spending is more susceptible to variation, though it notably takes a recession to cause consumers to cut spending on non-essential goods and services.
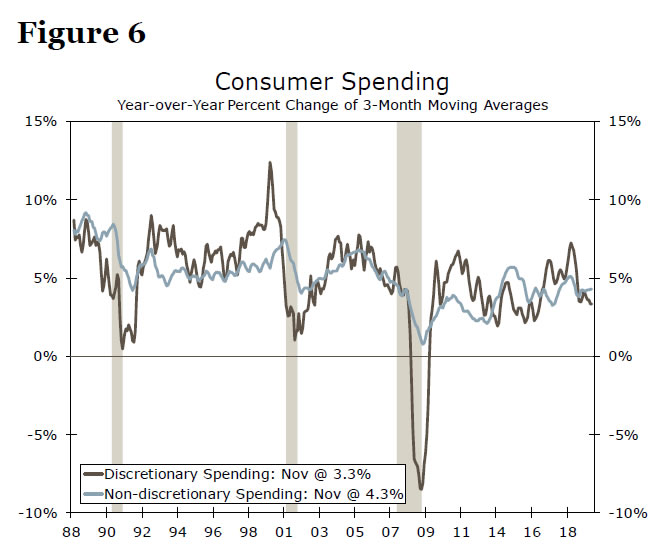
Consumers’ resilience is more evident when mapping the spending data to key events that caused elevated uncertainty. Discretionary spending plunged in January 1991—which corresponds to Operation Desert Storm—and September 2001—when the September 11 terrorist attack struck the United States. But, these retrenchments in spending are short-lived as consumers eventually get frugal fatigue exhibited by the V shape nature of the series during uncertain times. In fact, if we smooth the series by applying a three-month moving average, discretionary spending growth slows but does not turn negative at these two junctures (Figure 6). It takes the financial crisis of the past recession to cause discretionary spending to actually break below the zero line into negative territory. The bottom line from our analysis: consumers are resilient, even in uncertain times.
Appendix
To quantify uncertainty we utilize a residual approach. We estimate a model that generates a residual series, or the difference between the actual and estimated variable. The residual is also known as the error term.
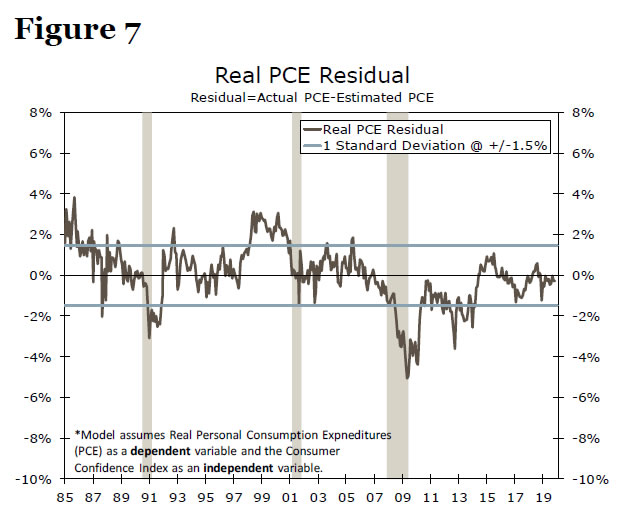
For example, we build a model with the U.S. Department of Commerce’s real personal consumption expenditures (PCE) as a dependent variable and the Conference Board’s Consumer Confidence Index as an independent variable.4 The model estimates real PCE from 1985-2019 and the residual is the difference between actual real PCE and the model’s estimated real PCE. The average of the residual is zero, meaning, on average, our model based real PCE is equal to actual real PCE over our sample period.
The residual is a measure of uncertainty. If the residual is zero, it indicates no uncertainty, because it suggests our model correctly estimated actual real PCE. A residual value above or below zero indicates uncertainty and the larger the residual the higher the uncertainty as it indicates the model is unable to accurately estimate actual real PCE.
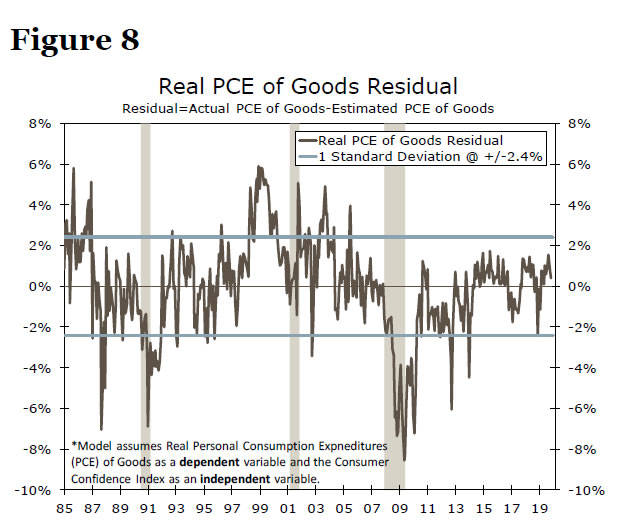
The largest uncertainty in our sample period is during the Great Recession; the real PCE residual hit the largest absolute value of -5.1 in May 2009 (Figure 7). Real PCE has showed resilience over the past several years as the residual stays within one standard deviation. But, as mentioned in our report, some segments of real spending may be more sensitive to uncertainties than others, like real PCE on goods or discretionary items. Our statistical analysis supports that view as the average uncertainty (measured by one standard deviation of the residual series) for real PCE is 1.46, which is smaller than real PCE of goods at 2.41 (Figure 8). The larger standard deviation for real PCE of goods demonstrates a higher average volatility, or degree of uncertainty, meaning the actual series responds more to confidence than the model estimate suggests. Further, real PCE of goods show higher uncertainty during the Great Recession, the residual was -8.5 in May 2009, compared to real PCE during the same period.
1 Our statistical analysis confirms our observation that real PCE of goods is more receptive to changes in uncertainty than overall real PCE. We utilized a residual approach to quantify uncertainty. For more detail regarding our statistical analysis, please see our Appendix on Page 4.
2. See, “A Phase One Trade Deal is Reached, What Does It Mean?” (December 13, 2019).
3 There is no set definition for discretionary consumer spending. We summed components of the Personal Income & Spending tables released by the U.S. Department of Commerce. Our measure includes spending in categories like; Food Services, Alcohol, Motor Vehicles, Vehicle Services, Recreational Vehicles, Recreational Services, Pets, Etc. For a complete list, please contact the authors.
4 See, “Oedipus Wrecks” (October 18, 2019), for more detail on the predictive power of consumer confidence and personal consumer spending.


