The uncertainty surrounding the Oil market continues as the OPEC plus group is indirectly sending messages of division among the members. Saudi Arabia’s energy minister said on Tuesday he saw no reason for the group to meet again in the following months as they already find it very difficult to agree upon the next steps they should take. This could be evidence that the group’s major players like Saudi Arabia and Russia may not be on good terms at the moment. The majority of market participants believe that the Saudis decision to increase production at significant levels could be an attempt to force Russia to agree to extend production cuts. Furthermore, some of OPEC’s smaller producers like Iraq stated the plans for increased Oil production could have negative effects on all the Oil producing countries stating further their disagreement and disappointment with the happenings. Iraqi officials also stated they were in talks with OPEC to prevent further Oil price deterioration. On a separate note, even though Russian oil companies stated they might increase Oil following the fallout with OPEC, Russia’s Energy Ministry will meet with the country’s oil companies in an attempt to decide on the future steps they should take and whether they will re-negotiate with the OPEC group. However, the situation in the past days has weakened the Russian rouble and sent stocks plunging. On the other hand, yesterday Oil prices came under support as some media sources from the US, stated that some of the White house funding actions to help boost the economy could be aimed at bailing out US Oil firms having a difficult time running on negative cash flows. The plan could be for the government to provide low interest loans to these firms and keep them going. WTI’s price yesterday started the session bouncing off our (S1) 30.60 level and continued higher for the rest of the session. We must note that, at some point the commodity even approached the (R1) 38.00 level but did not keep the bullish momentum to clearly test it. For the time being crude Oil remains in a sideways motion between our (S1) 30.60 support level and (R1) 38.00 resistance level. In a selling momentum, the possible levels below our noted (S1) could be the (S2) 27.70 that was last tested on the 9th of March but not breached and even lower the (S3) 24.50 line. If the commodity is to move higher and surpass our (R1), then the next stop could be the (R2) 41.70 line or even higher the (R3) 46.30 level, both last seen on the 6th of March. The RSI indicator below are chart is still running below 30, yet the sudden jump yesterday could be sending the message that the trend could change.
Financial markets perform largest single session rise in more than 10 years
Yesterday, investors were overtaken by positive news that the White House and many other governments around the world, will be taking fiscal stimulus measures to absorb and overcome the hit from the coronavirus outbreak. Market participants were satisfied to see a strong comeback after the major selloff that took place on Monday. Some of the most impressive upward moves yesterday included the S&P 500 gaining +4.94% , the DJIA gaining +4.89%, Apples stock surged by+7.2% while US Treasury yields also performed a rebound. Many believe the financial markets will continue to face adversity as many of the current issues may continue to create problems and even worsen in the following weeks. However, market participants were satisfied to see a strong comeback after the major selloff that took place on Monday. Yesterday, the US500Cash was among the top winners of the day and as noted above gained +4.94% on the session. The index initially started the session moving downwards and breached our (S1) 2820.10 level and continued lower surpassing the (S2) 2775.30. It even approached the (S3) 2720.80 line, yet it managed to rebound late in the US session surpassing all the support levels to the upside. If the upward momentum continues today the possible stops could be first the (R1) 2940, that was last seen on the 6th of March or even higher the (R2) 3008.80 line last seen on the 5th of March. In a possible strong buying momentum the Index could even reach our (R3) 3090.50 level last seen on the 4th of March. The RSI indicator below our chart is currently running on the 50 level possibly displaying some ambiguity as to the direction the Index may follow next.
Other economic highlights today and early tomorrow
Today during the European morning, many financial data from the UK will be released. We get the UK’s GDP rates, the Manufacturing Output and the Goods Trade Balance all for January. In the early US session we get the US Core CPI and CPI rates for February. A couple of hours in the American session we get the weekly EIA Oil stockpile readings. In the Asian session, we get Japan’s Corporate Goods Prices for February.
WTICash Daily chart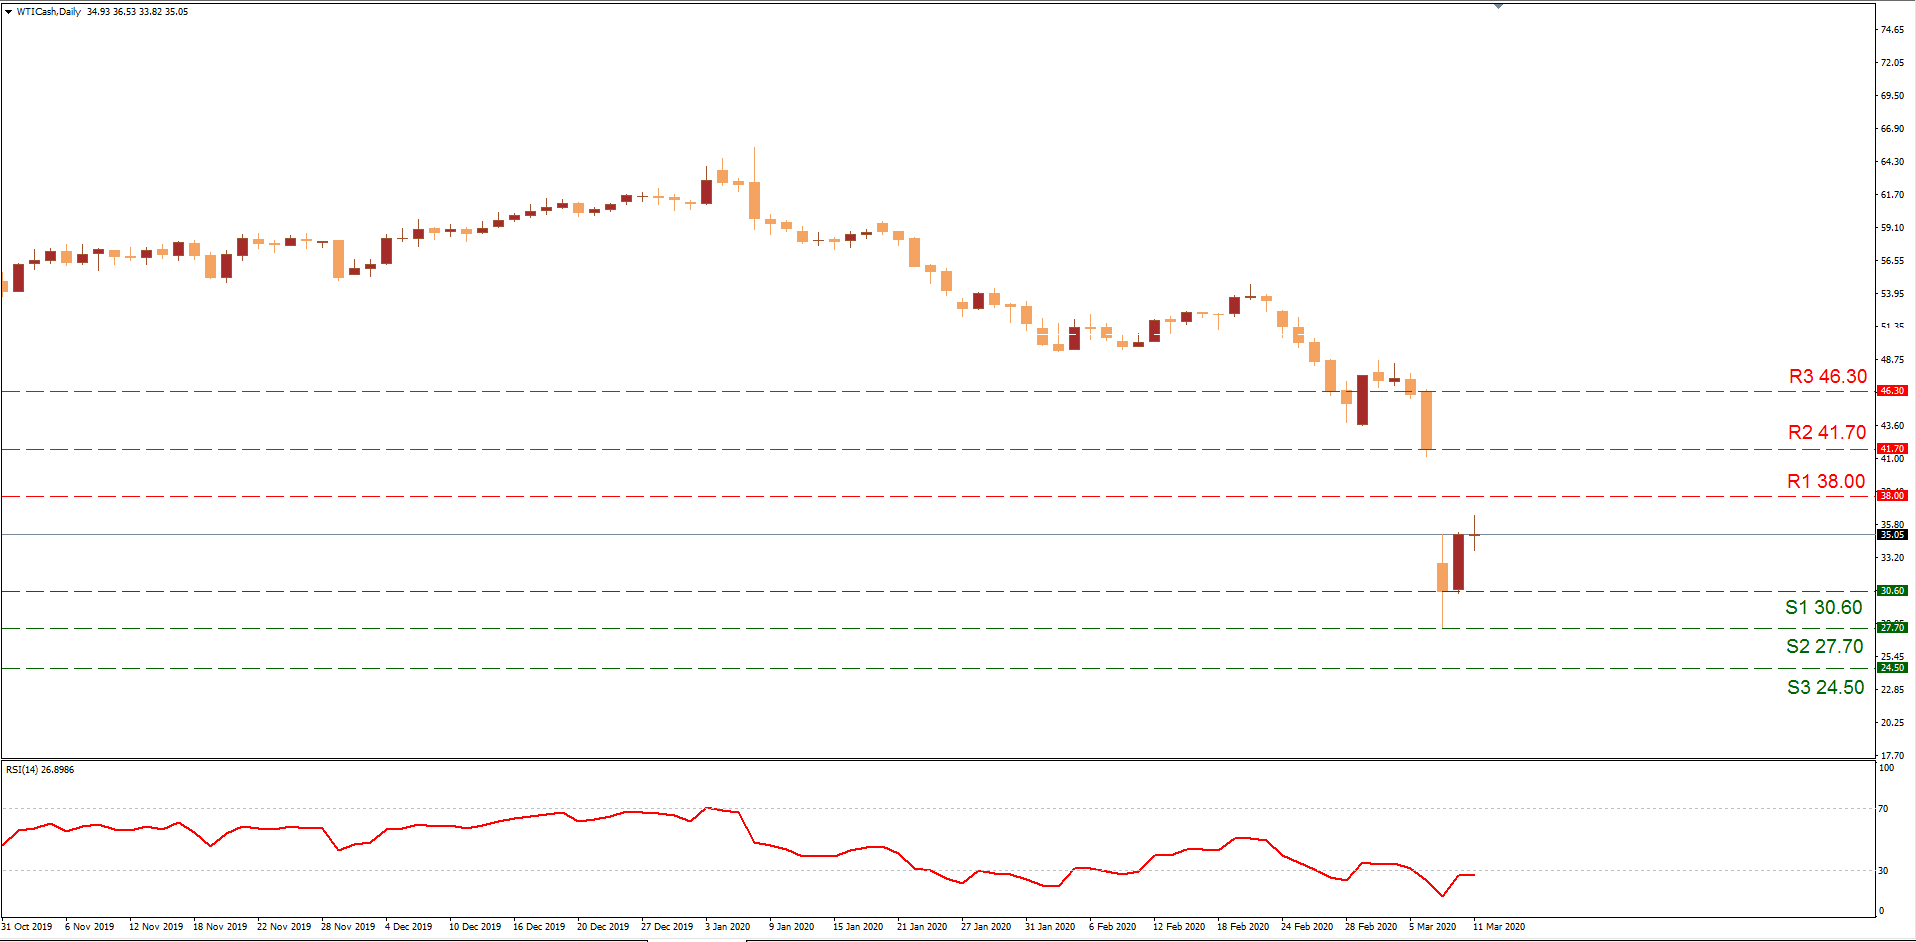
Support: 30.60 (S1), 27.70 (S2), 24.50 (S3)
Resistance: 38.00 (R1), 41.70 (R2), 46.30 (R3)
US500Cash Daily chart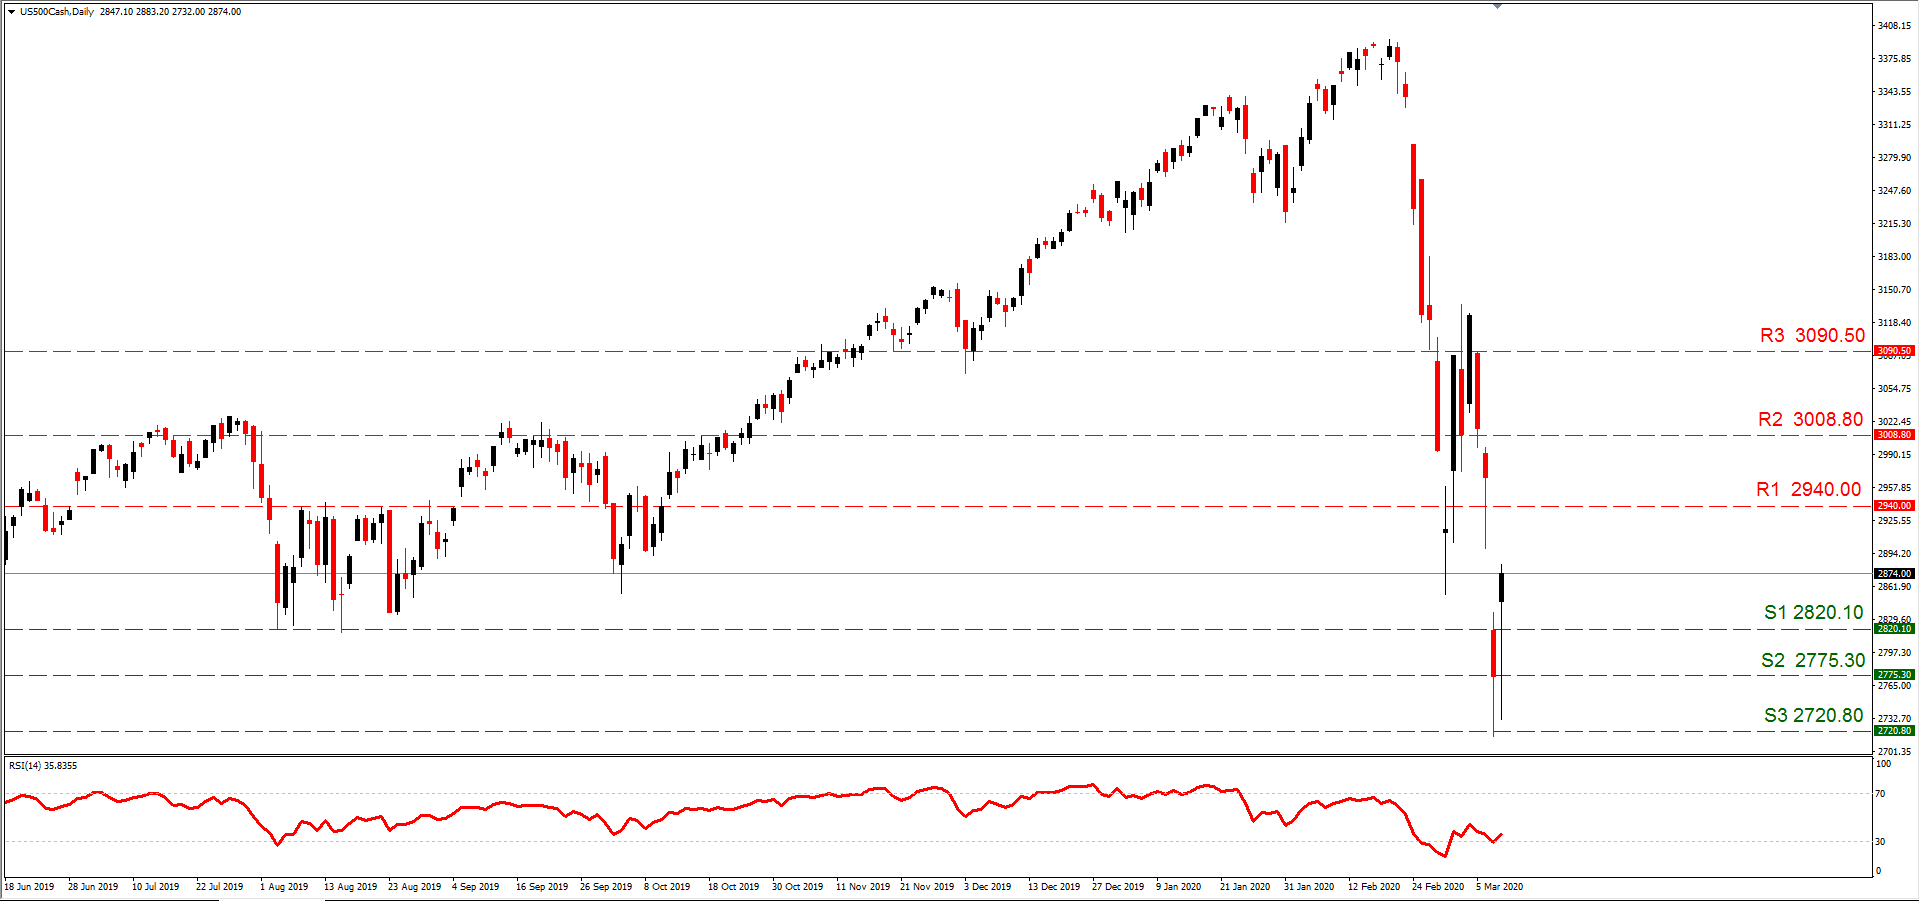
Support: 2820.10 (S1), 2775.30 (S2), 2720.80 (S3)
Resistance: 2940.00 (R1), 3008.80 (R2), 3090.50 (R3)