
U.S. Highlights
- The start of May ushered in a barrage of sour data reports. The list included a plunge in April vehicle sales and service-sector activity falling into deep contractionary territory as indicated by the ISM non-manufacturing index.
- The most-anticipated report of the week, the jobs report, showed that U.S. payrolls plunged by 20.5 million in April. The unemployment rate skyrocketed to 14.7%. This double-digit rate still undercounts some the pandemic’s impact on the labor market, given a surge in the number of Americans not counted in the labor force who currently want a job.
- In a sign that there are some vague lights at the end of the tunnel, initial jobless claims continued to trend down, coming in at 3.2 million last week – about half their late-March peak.
Canadian Highlights
- Equity markets continued to trend higher as economies started to relax restrictions. Oil prices also increased on signs of a gradual normalization in demand and an easing in inventory builds.
- Statistics Canada’s Labour Force Survey was this week’s big event. April saw another record-breaking fall in employment as Canada’s unemployment rate surged to 13%.
- Regional real estate boards showed historical drops in resale activity, but housing starts came in well above expectations.
U.S. – Pandemic Wipes Out Nearly All Job Gains Of Past Decade
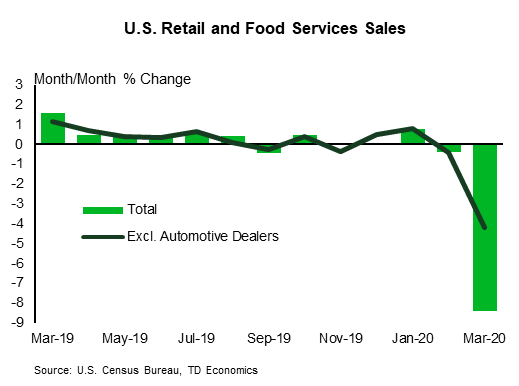
The start of May ushered in a barrage of bitter news on the data front, with the economic fallout from COVID-19 clearly on display this week. The sour data buffet included a widening of the U.S. trade deficit in March as a decline in exports outweighed that in imports, plunging vehicle sales in April (-24.5% m/m) and the service sector falling into contractionary territory, as indicated by the April ISM non-manufacturing index (-10.7 points to 41.8).
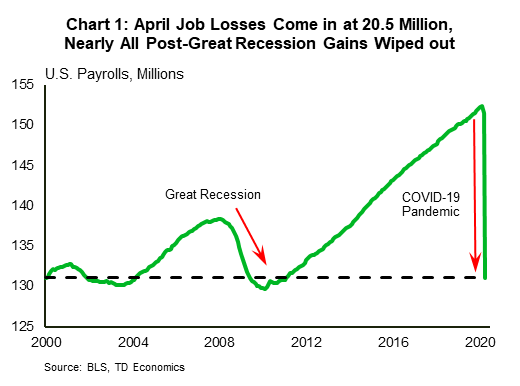
Still, the most-anticipated report of the week, by far, was the jobs report. Like much of everything these days, the April collapse in payrolls marks a new record. The U.S. economy shed a massive 20.5 million jobs last month, as COVID-19 led many businesses to close and lay off staff. Job losses were widespread on a sectoral basis. Unsurprisingly, the consumer-driven leisure and hospitality sector led the decline (-7.7 million or -47% m/m). Together with a downwardly revised March print (-870k), about 97% of all job gains made in the aftermath of the Great Recession have already been wiped out, with payrolls now back to their early-2011 level (Chart 1).
Total employment in the household survey, meanwhile, fell by 22.4 million in April. But, the size of the labor force also pulled back by 6.4 million, as the participation rate plunged 2.5 percentage points to 60.2% – the lowest level since 1973. Putting the pieces together, the number of jobless Americans rose by 15.9 million, while the unemployment rate skyrocketed to 14.7%, blowing past the 10.8% post-WWII record set in 1982. Despite the sharp departure from a jobless rate that was near the lowest level in half a century just recently, the double-digit unemployment rate still undercounts some of the pandemic’s impact on the labor market. For instance, the number of Americans not counted in the labor force who currently want a job nearly doubled to 9.9 million in April. If these people were counted as unemployed the unemployment rate would have topped 20%.
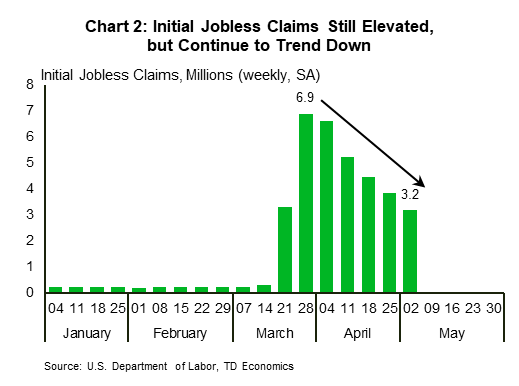
Despite all the record-setting negative data, there appear to be some vague lights at the end of the tunnel. Initial jobless claims, while still elevated, have been trending down, coming in at 3.2 million last week – about half their late-March peak (Chart 2). Some states have already eased restrictions in recent weeks and more are set to follow. As more regional economies reopen, the pressures should ease further. Since the majority of the unemployed are reported to be on temporary layoff, businesses may have an easier time restarting operations.
Still, the initial march toward normal will not be a speedy process. On the consumption side for instance, recent evidence suggests that even if businesses reopen, consumers may not feel safe to return to their old spending habits. At the same time, the hit to employment and income will linger, so a tighter grip on the purse strings is likely. In addition, speedy re-openings are also a bit of a double-edged sword, since they increase the risk of a rise in infections. All in all, the economic narrative is likely to remain ugly in the near-term. While there’s reason to be optimistic about a gradual turnaround, the way forward hinges on the path of the virus.
Canada – Unprecedented Pain in Labour Markets
This was another relatively calm week for financial markets. Like its global peers, the S&P/TSX Composite trended higher, up 2.2% on the week (as of writing). This improvement in risk sentiment continued despite another record-breaking jobs report for both the U.S. and Canada.
Oil markets also continued to rise, with the WTI benchmark up more than 20% on the week (though still more than 55% below January levels). Data from the Energy Information Administration continued to show signs of a gradual normalization in demand and an ease in the stock builds in the U.S., while Saudi Arabia’s main producer also raised its pricing for June deliveries. These signs of supply-demand rebalancing may bring some respite to oil producers and regions, but the anticipated losses to global demand in the second quarter and uncertainty relating to the speed of the economic rebound will continue to cloud the outlook.
Turning to the economic data, releases from real estate boards showed historical declines in resale activity in Toronto, Vancouver, and Calgary. Surprisingly perhaps, April saw a jump in housing starts (+11% m/m). However, this print excluded Quebec, which restricted construction last month.
This week’s main event was Statistics Canada’s Labour Force Survey release, which unfortunately (but expectedly) showed another record-breaking fall in employment – at two million net job losses. This print came in less than consensus expectations for a four million net loss, but was still enough to bring the employment rate down to a record-low 52.1% from 58.5% in March. The unemployment rate also correspondingly spiked by 5.2 ppts to 13%.
Digging into the details, the goods sector followed the services sector’s disappointing showing last month, with sharp losses in the manufacturing (-15.7%), construction (-21.1%), and natural resources (-9%) industries. All provinces have recorded cumulative job losses of more than 10% since February. However, Quebec stands out, with a cumulative 18.7% drop in employment that pushed its unemployment rate to the highest in Canada (17%). This comes after the province boasted the lowest rate in the country (4.5%) in February.
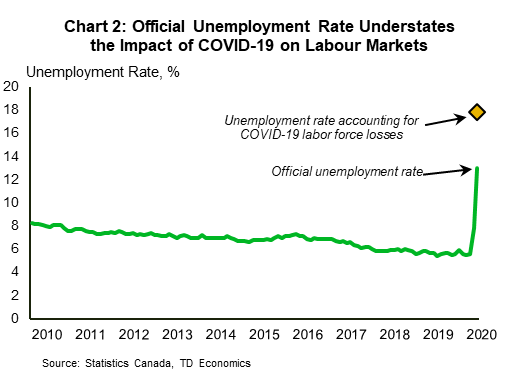
Like March’s report, the headline figures may be understating the true impact of COVID-19 on labour markets and the economy. Indeed, compared to the 11% plunge in employment, hours worked fell a more significant 14.9% (Chart 1). Importantly, Statistics Canada also noted that 1.1 million job losses related to COVID-19 were not counted in unemployment statistics as workers dropped from the labour force. Accounting for this would bring the unemployment rate up to 17.8%, according to Statistics Canada (Chart 2).
There may be some faint light at the end of the tunnel for labour markets. The survey was conducted between April 12-18, reflecting the peak of social distancing restrictions. Since then, provinces have started to partially reopen their economies. However, we are from being out of the woods. Swift government support (Canada Emergency Response Benefit, Canada Emergency Wage Subsidy, and other provincial support) will act as a temporary backstop to income and employment, but a return to pre-COVID-19 economic activity will likely be slow and mired with uncertainty.

U.S: Upcoming Key Economic Releases
U.S. Consumer Price Index-April
Release Date: May 12, 2020
Previous: -0.4% m/m, 1.5% y/y
TD Forecast: -0.7% m/m, 0.5% y/y
Consensus: -0.7% m/m, 0.4% y/y
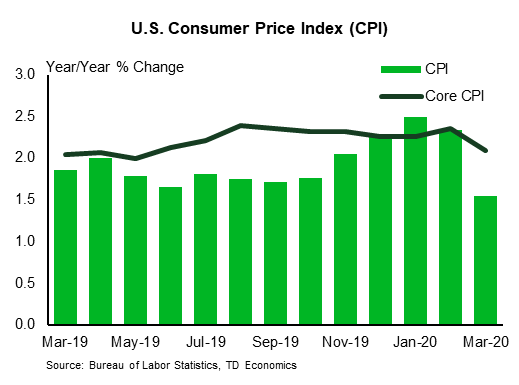
The overall CPI (forecast: -0.7% m/m) was likely pulled down by a plunge in gasoline prices, but core prices likely fell as well (we forecast: -0.2% m/m). Among core components, the most dramatic weakness will probably be reported for the travel-related parts, most notably airfares, other lodging (basically hotels) and car rental fees. We also expect a decline in apparel prices and some slowing in rents. All in, we expect the annual rates to slow to 0.5% for total CPI and to 1.7% for core.
U.S. Retail Sales – April
Release Date: May 15, 2020
Previous: -8.4% m/m, ex-auto: -4.2%
TD Forecast: -12.5% m/m, ex-auto: -7.0%
Consensus: -11.0% m/m, ex-auto: -8.0%
In general, the April data are likely to show even more weakness than the March data, as the collapse in activity stemming from shutdowns and social distancing did not start until around the middle of March. On the plus side, online consumer spending was probably boosted somewhat in late April by “recovery rebates,” and food and beverage store sales probably remained fairly strong. Overall, though, the report is likely to show another plunge in spending: We forecast down 12.5% m/m after -8.4% in March.
Canada: Upcoming Key Economic Releases
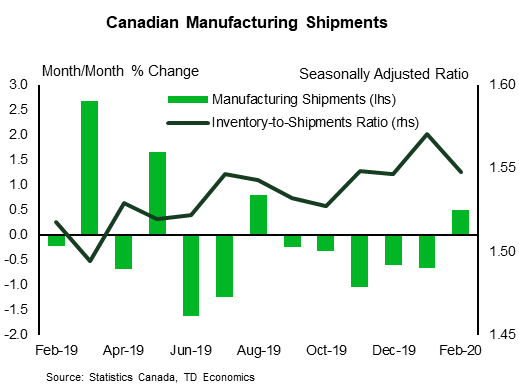
Canadian Manufacturing Sales – March
Release Date: May 14, 2020
Previous: 0.5%
TD Forecast: -6.0%
Consensus: NA
Manufacturing sales are forecast to decline by 6.0% in March, in line with the broad weakness in merchandise exports. While production was largely unaffected for the first two weeks of March, an escalation of emergency measures will weigh heavily on the monthly totals. Major automakers began to suspend production on March 18th and on March 23rd Ontario ordered all non-essential firms closed. Due in part to that timing, we look for transportation equipment to lead the decline while food products, which make up 16% of all manufacturing activity, should provide a partial offset.


