
Executive Summary
Many American industries, especially manufacturing, have become more dependent on foreign suppliers over the past few decades. But the lockdowns that many countries have employed to combat the spread of COVID-19 could lead some of these industries to rethink their supply chains. In the first report in a two-part series, we explore which U.S. industries could face the biggest adjustments if they shift from foreign vendors to domestic ones, as well as the macro effects on the U.S. economy and its major trading partners.
The aircraft & aerospace industry has registered the largest increase in its ratio of imported inputs-to-total inputs since 1997. In addition, the leather & apparel, machinery, auto & auto parts, and electrical equipment industries have all experienced large increases in their respective imported input ratios. These industries would potentially face the most significant adjustments if they reoriented their supply chains back toward domestic vendors, although the effect on the macro U.S. economy would not be very large. We also find that China would have the most to lose on an absolute basis, although Mexico and Canada would be the biggest relative losers given their extensive trade ties with the United States.
Will the Pandemic Cause Supply Chains to Move Back on Shore?
The ongoing COVID-19 pandemic will have a depressing effect on the global economy this year. As we discussed in our most recent Monthly Economic Outlook, we look for global GDP to contract nearly 4% in 2020, the sharpest slump in decades, before rebounding in 2021 under the assumption that the outbreak is brought under control and/or an effective vaccine is developed in the not-toodistant future.
But the pandemic could also have some more lasting effects on the global economy. Specifically, lockdown measures have called into question the desirability of supply chains that stretch around the world. For example, China, which is a critical link in the supply chains of many manufacturers, was essentially shut down for a month or two earlier this year. Although some businesses were starting to move operations out of China due to a number of different reasons, concern about future pandemics could accelerate the pace of relocation out of China. Could supply chains be moved from China and other countries back to the United States?
In the first of a two-part series of reports, we analyze the effect on different industries if firms reorient their supply chains to domestic vendors. Industries that have developed complex global supply chains over the past few decades may face some meaningful adjustments in coming years, if they curtail the use of their current foreign vendors in favor of domestic ones. But some domestic industries that have been negatively impacted by the embrace of foreign suppliers over the past few decades could benefit if supply chains move back onshore. We analyze this potential benefit in an upcoming second report.
Which Industries Have the Most Exposure to Foreign Suppliers?
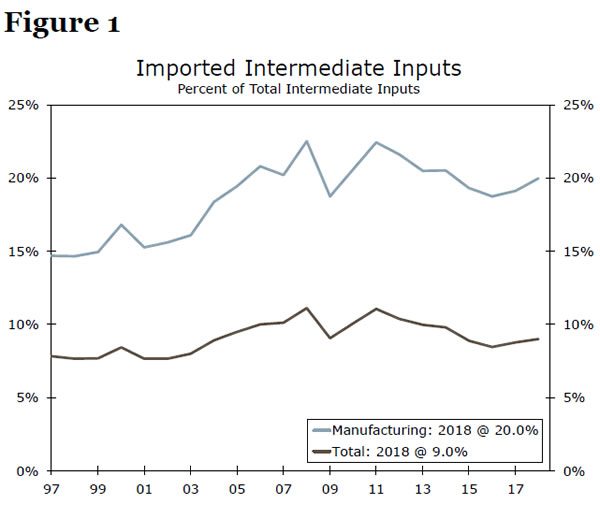
The common perception is that many industries have turned increasingly to foreign sources to supply their inputs over the past few decades. This perception is supported by the data. The inputoutput tables that are prepared by the U.S. Department of Commerce reveal that American businesses imported just 7.8% of their inputs of goods and services in 1997 (Figure 1). By 2008, that percentage had risen to more than 11%. Although the percentage of imported inputs has receded somewhat over the past decade, it remained higher in 2018 than it had been 20 years previously. But today’s percentage of only 9.0% may still seem low. However, that overall percentage includes the inputs that service industries use. Because service providers use a significant amount of other services as inputs, which tend not to be imported, the percentage of imported inputs for all American industries gets pulled down. Focusing on manufacturing industries, a clear upward trend is visible: American manufacturers imported less than 15% of their inputs in 1997 versus 20% today.
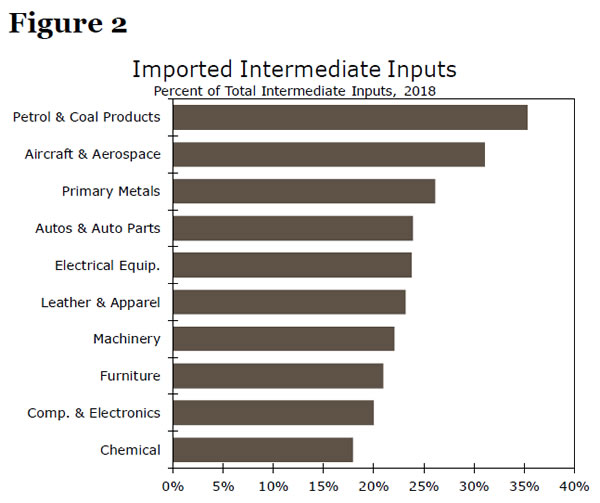
As shown above, manufactures tend to import more of their inputs than service providers. Indeed, the ten industries with the highest percentage of imported inputs in 2018 were all manufacturing industries (Figure 2). The petroleum & coal products industry leads the list with a percentage of imported inputs-to-total inputs of 35%. Of course, this is a special case because of the significant amount of crude oil that the industry imports. But the aircraft & aerospace industry imports more than 30% of its inputs. In addition, the following industries all have ratios that exceed the average for the manufacturing sector: primary metals (26%), autos & auto parts (24%), electrical equipment (24%), leather & apparel (23%), machinery (22%) and furniture (21%).
Which Industries Have Changed the Most?
It seems unlikely that industries will move their supply chains entirely back to the United States. After all, Figure 1 shows that the manufacturing sector imported roughly 15% of its inputs twenty years ago. We do not have access to data on imported inputs prior to 1997, but manufacturers undoubtedly imported some of their inputs prior to 1997. However, it is reasonable to presume that industries could cut imported inputs back to the ratios that prevailed in 1997 in an effort to reduce their dependence on foreign suppliers. Which industries have experienced the largest increase in the portion of inputs they import since 1997? These industries would seem to face the biggest adjustments if they were to revert to the imported input ratios of twenty years ago.
The aircraft & aerospace industry imported about 15% of its inputs in 1997. By 2018 that percentage had grown to more than 31%, an increase in excess of 16 percentage points over that 20-year period (Figure 3). The leather & apparel industry also notched a double-digit percentage point increase in its imported input ratio over that period. The machinery, auto & auto parts and electrical equipment industries were the other industries with the largest changes in their respective imported input ratios.
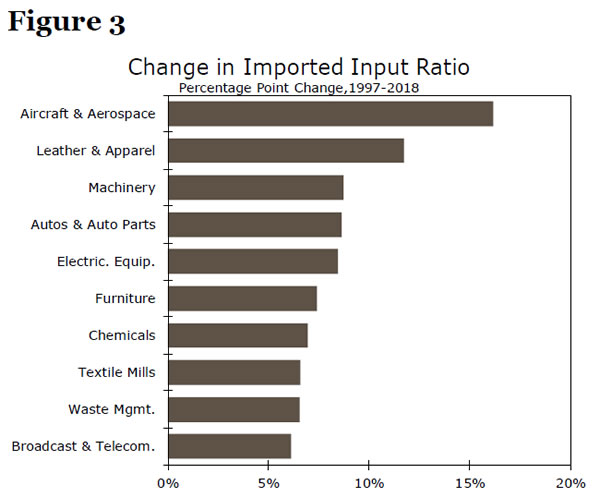
The potential re-orientation of supply chains away from foreign suppliers could entail some significant adjustments for the industries shown in Figure 3. But would there be meaningful effects on the U.S. economy? The value of U.S. goods and services inputs in 2018 totaled nearly $16 trillion, and more than $1.4 trillion of this total was imported. If a re-orientation of supply chains away from foreign vendors causes the import ratio to fall from its current value of 9.0% back to its 1997 value of 7.8% (Figure 1), then the United States would import roughly $180 billion per year less of inputs.1 This amount is equivalent to less than 1% of GDP, so it probably would not have a significant effect on the $22 trillion U.S. economy. But a re-orientation of supply chains could be a meaningful opportunity for domestic input suppliers to gain market share. We will explore which domestic industries could benefit the most from a re-orientation of supply chains in our next report.
So if the United States were to import $180 billion less of inputs each year, which foreign countries would bear the brunt of the shift in supply chains? As shown in Figure 4, we estimate that China would be the biggest absolute loser with nearly $56 billion of lost sales of inputs to American businesses, followed by Mexico ($29 billion), Japan ($13 billion), and Canada ($12 billion) However, these lost sales would represent only 2.1% of Chinese exports, or only 0.4% of Chinese GDP. In other words, a re-orientation of American supply chains likely would not produce a devastating effect on the Chinese economy. That said, the effect could be magnified if American consumers were to shift their spending patterns away from Chinese goods. As noted previously, we will postpone analysis of that topic to future research.
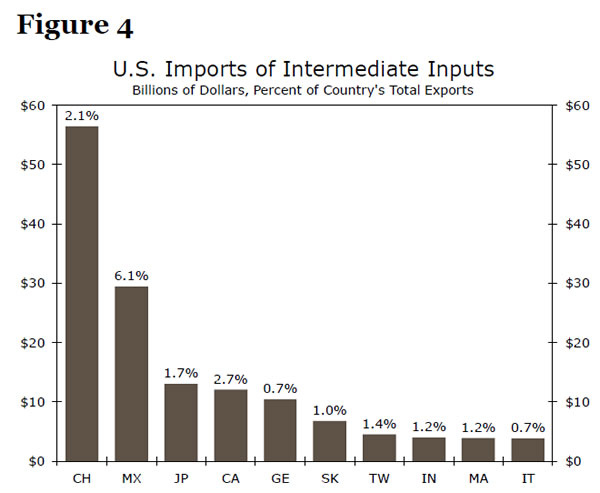
But the re-orientation of American supply chains could have a more deleterious effect on the Mexican economy. The potential loss of $29 billion worth of input sales would represent more than 6% of Mexican exports. With an export-to-GDP ratio of nearly 40%, that loss of sales would represent a hit to Mexican GDP in excess of 2%. The Canadian economy would also experience a hit that we calculate to be on the order of nearly 1% of GDP if it were to lose its $12 billion of input sales to American businesses. In short, the United States’ North American neighbors likely would experience the largest negative repercussions of a re-orientation of American supply chains.
Conclusion
The supply chains of the United States and many other major economies became increasingly internationalized over the past few decades. Although a number of factors were already leading some industries to rethink their supply chains over the past few years, the lockdowns that most countries imposed to combat the spread of COVID-19 may accelerate the re-orientation of supply chains away from foreign vendors to domestic ones.
We find that the following industries would potentially face the most significant adjustments from supply chain re-orientation: aircraft & aerospace, primary metals, autos & auto parts, electrical equipment, leather & apparel, machinery, and furniture. But the effect on the macro U.S. economy likely would not be very large. We will explore which domestic industries could benefit the most from a re-orientation of supply chains in our next report.
1 American businesses import foreign-produced inputs because they presumably are less expensive than their domestically-produced equivalents. A re-orientation of supply chains back toward American suppliers could raise the cost of inputs, which would reduce the benefits of re-orientation.


