U.S. Review
Rising COVID-19 Cases Put a Damper on Re-openings
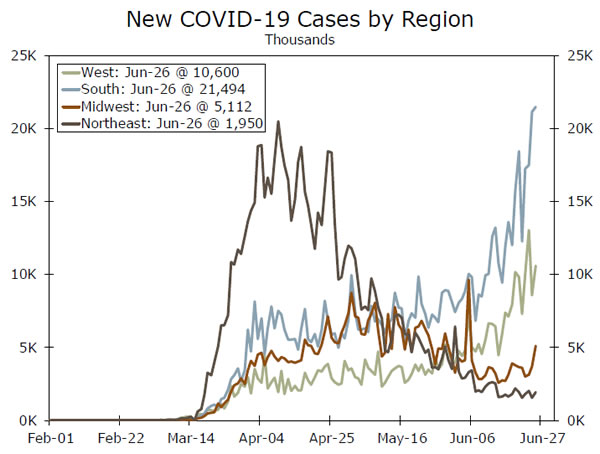
- The rising number of COVID-19 infections gained momentum this week, with most of the rise occurring in the South and West. The rise in infections is larger than can be explained by increased testing alone and is slowing re-openings.
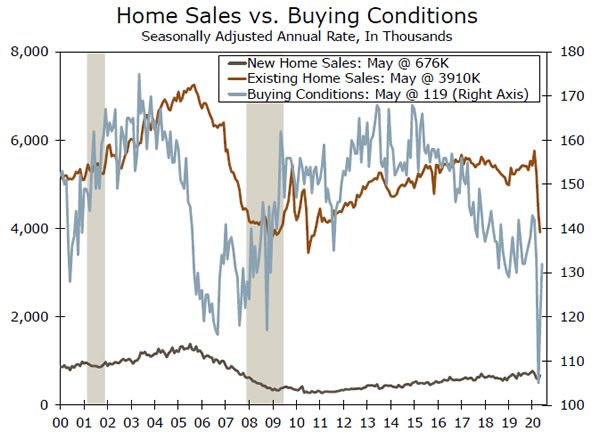
- Home sales continue to show a surprising degree of resilience. New home sales rose 16.6% in May and mortgage applications for the purchase of a home are up 18% year-to-year.
- Factory orders rebounded in May. Manufacturers appear to have solid momentum headed into the summer. Demand for light vehicles has been surprisingly robust.
Rises COVID-19 Cases Offset Better Economic News
The rising number of COVID-19 infections was the big economic story this week, offsetting continuing reports of a rebound in economic activity. The bulk of the increase in COVID-19 infections has been in the South and West, with California, Arizona, Texas, Florida, Georgia and the Carolinas accounting for the bulk of the increase. This list includes the nation’s three largest states and many of the nation’s fastest growing states.
Some increase in COVID-19 cases was expected as the economy reopened and testing continued to ramp up. The rise in infections, however, has been greater than can be explained by testing alone (see Topic of the Week). Moreover, infections were expected to slow as temperatures and humidity ramped up this summer. Unfortunately, what is not known about the virus remains a mammoth risk to the economic outlook. Not only have infections ramped up, but they have done so in states with warmer and, in the case of the South, a more humid environment. Many states and metro areas have either paused or partially reversed their staged re-openings, which will weigh on economic growth this summer.
This week’s economic news was mostly positive but most reports came in at-or-below expectations. The improvement in weekly unemployment claims continued but the rate of improvement slowed and the prior week’s numbers were revised higher. Continuing unemployment claims show more modest but consistent improvement, suggesting businesses have continued to recall laid-off and furloughed workers. There was enough improvement in unemployment claims between mid-May and mid-June to produce another large gain in nonfarm payrolls.
The housing data also remain positive. New home sales rose 16.6% in May to a 676,000-unit pace. While the increase was a bit more than expected, the prior month’s data were revised lower, leaving the trend over the past three months close to the initial estimates. Builders are upbeat, however, with most reporting strong prospective buyer traffic. Existing home sales tumbled 9.7% in May. Existing homes are tallied when the transaction is completed at closing and lag purchase contracts, or pending sales, by one-totwo months. The May data reflect the March and April period, when the economy was largely shut down. One area that was particularly impacted was sales of condos and co-ops, which fell to the lowest level since sales have been tallied. Condo and co-op sales are heavily concentrated in the greater New York City area, South Florida and a handful of markets out West, where shutdowns were more comprehensive.
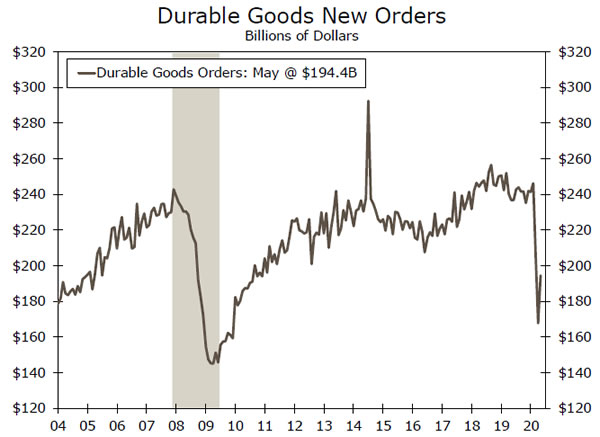
Advance orders for durable goods jumped 15.8% in May, which was better than expected. While orders were revised marginally lower for the prior month, May’s rebound was helped by a big jump in orders for cars and light trucks. Assembly plants began to come back online in May and re-opened more fully in June. Orders excluding the volatile transportation sector rose 4.0% and nondefense capital goods orders rose 2.3%, both were roughly twice what was expected. Moreover, shipments of nondefense capital goods excluding aircrafts rose 1.8% in May, showing much more resilience than had been expected.
U.S. Outlook
Consumer Confidence • Tuesday
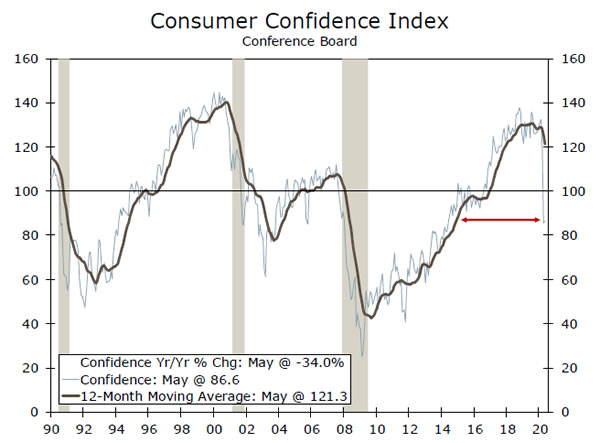
Consumer confidence has held up reasonably well considering the U.S. continues to combat a global pandemic. Confidence measured by the Conference Board was down just 46 points in May from its February pre-COVID peak, and at 86.6, confidence is only as low as it was in 2014. For some context, confidence slid a total of 86.6 points back in the 2008 recession to a record low 25.3. In the 2001 recession, confidence fell a similar 81.1 points over 31 long months and had some false-pops along the way down. The sharp down-turn in March and April confidence was consistent with large swaths of the economy temporarily closed and consumers being confined to their homes. In May, many stay-at-home orders began to be lifted, and confidence likely brightened, preventing a further drop. We expect confidence rose a bit in June as states re-opening plans got underway. But, there remains risk of further declines in coming months, particularly amid increasing positive case counts.
Previous: 86.6 Wells Fargo: 91.6 Consensus: 90.0
Trade Balance • Thursday
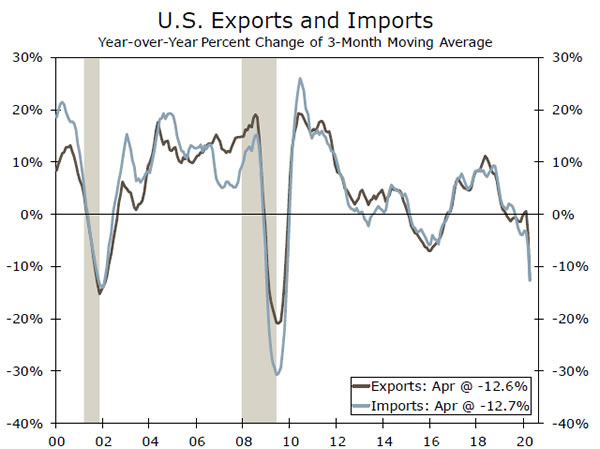
International trade has been pummeled by COVID-19. Domestic lockdowns led many factories and businesses to close or operate at limited capacity, limiting demand for imports, while restrictions overseas have similarly limited export demand. Exports have fallen faster than imports, however, causing the trade deficit to widen sharply since February, and we expect a similar outturn in May.
The advance trade figures showed a sharp widening in the May goods deficit, largely attributable to a plunge in net exports in the industrial supplies component, which includes oil. In terms of services, travel and transport represent a sizeable share of trade, at about 36% of exports and nearly 80% of imports. With travel advisories and restrictions still in place for a majority of May, both services exports and imports likely remained weak. Net exports may still make a positive contribution to Q2 growth, though it will be completely washed by large declines in consumption and investment.
Previous: -$49.4B Wells Fargo: -$53.0B Consensus: -$52.5B
Employment • Thursday
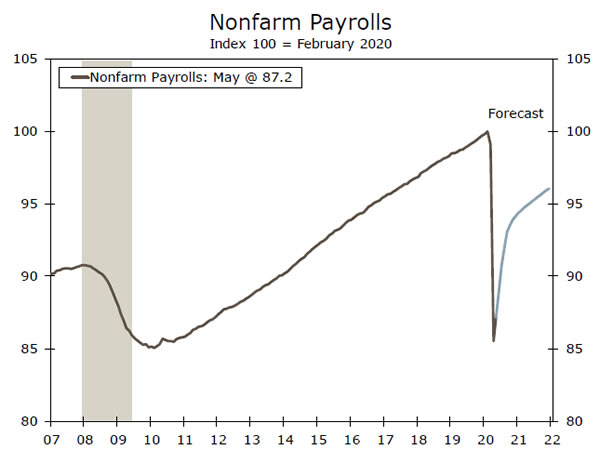
The U.S. economy shed over 20 million jobs since its February pre-COVID peak. The surprise 2.5 million increase in May nonfarm payrolls, however, suggested the pick-up in employment materialized earlier than expected. The rebound in the labor market likely continued in June and we look for employers to have added 3.3 million jobs. While this would mark a continued improvement, nonfarm payrolls would still be well below their February peak. The recovery will take some time, and it will likely be a few years before the level of payrolls gets back to new highs. Continuing claims for unemployment suggest 19.5 million people were still collecting unemployment insurance as of June 13. Further, initial claims continue to trend lower, but remain remarkably high at 1.5 million claims as of June 20. We expect the bottom in the labor market was reached in April and continue to look for a gradual recovery, though if the confirmed positive test rate continues to ramp-up nationally, there could be some downside risk to our forecast.
Previous: 2.5M Wells Fargo: 3.3M Consensus: 3.0M
Global Review
Hope Springs, But Will it be Eternal?
- The news from Europe was encouraging this week, with PMI surveys for the Eurozone and United Kingdom rebounding, particularly for the service sector. The prospects of a faster Eurozone recovery are perhaps improving given aggressive monetary easing and hopes for a more coordinated regional fiscal response. In the U.K., Brexit uncertainties may remain a headwind for the speed of economic recovery.
- Mexico’s central bank cut rates 50 bps to 5.00%, saying growth risks moved sharply to the downside while inflation risks were somewhat more balanced. We expect further easing from the Bank of Mexico in the months ahead.
Hopeful Signs From Europe
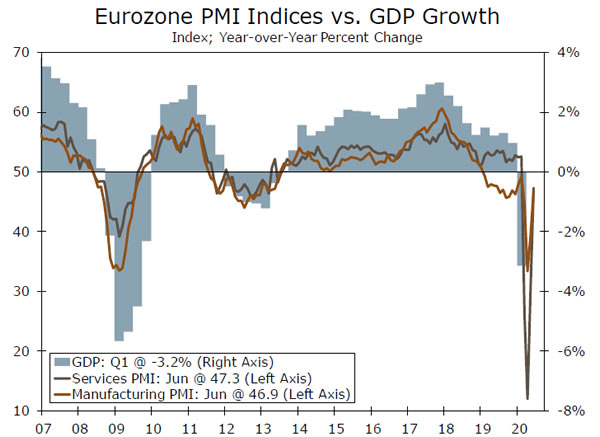
News from the Eurozone this week offered encouragement on two fronts– first, the bottom for economic activity may already be in and, second, the recovery in the Eurozone economy may occur quicker than previously expected. As COVID-19 lockdown measures continue to be lifted, activity has rebounded to some extent. For June the Eurozone manufacturing PMI rose more than expected, to 46.9 from 39.4. The rise in the services PMI was even more impressive, to 47.3 from 30.5. PMI surveys for the major Eurozone countries improved, though more so for France than for Germany.
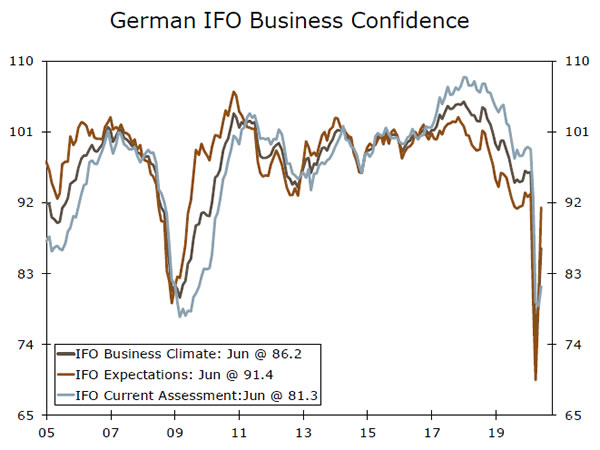
That said, the outlook for the German economy also appears to be moving in the right direction. In a separate report, Germany’s June IFO business confidence index rose to 86.2, the second straight increase. What was notable about the report however was that not only did the expectations component improve but so too did the assessment of current conditions, the first time the latter has shown any improvement since January. The median forecast is currently for Eurozone Q2 GDP to fall 12.2% quarter-over-quarter. However, considering favorable data, aggressive monetary easing and progress towards further fiscal stimulus, we see potential for a smaller economic decline in Q2 and a faster rebound in Q3.
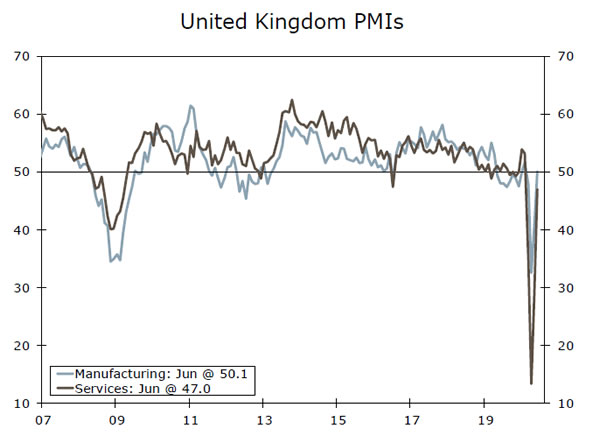
The news from the United Kingdom was just as encouraging, as the June manufacturing PMI edged back into expansion territory at 50.1, and the services PMI also rose sharply to 47.0 from 29.0 in May. While improving survey data in May and June could be consistent with a smaller fall in U.K. Q2 GDP than previously expected, we note those figures come after a dramatic 20.4% month-over-month GDP decline that has already been reported for April. Additionally, it’s not entirely clear based on policymakers’ recent comments how proactive the Bank of England will be in maintaining aggressively accommodative monetary policy. Ongoing Brexit uncertainties could also be a restraint. Hence while the good June news might suggest a smaller decline in U.K. GDP in Q2, it is less clear to us if it points to a faster bounce back in the economy over the second half of this year.
Bank of Mexico Eases as Economic Slump Continues
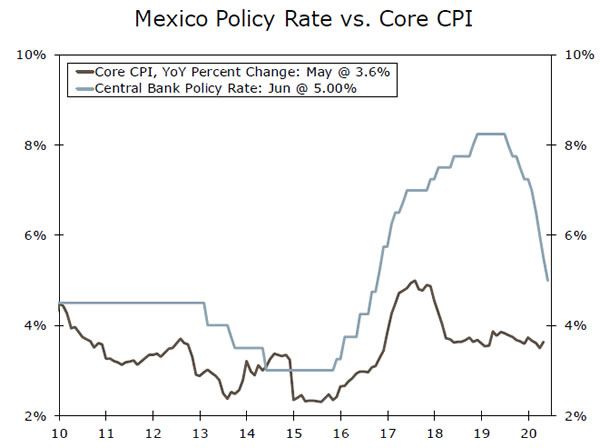
The Bank of Mexico cut its overnight rate 50 basis points to 5.00% at this week’s meeting, bringing the cumulative reduction in its policy rate to 325 basis points since the middle of 2019. With the Mexican economy still in deep decline, we maintain the view that further monetary easing will likely be forthcoming. Indeed, this week’s release of the April economic activity index, a monthly indicator of activity that correlates very closely with the quarterly GDP figures, showed Mexican economic activity slumped 17.3% month-over-month and some 19.9% year-over-year. Given the monthly decline, the level of economic activity in April is around 18% below its Q1 average, setting the Mexican economy up for a huge decline in GDP in the second quarter. We forecast Mexican GDP to fall by 8.3% in 2020, though the risks are perhaps tilted towards and even larger decline.
Global Outlook
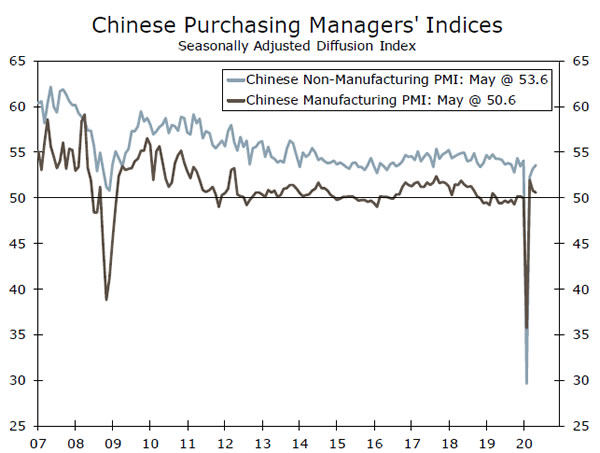
China PMIs • Tuesday
The second quarter rounds out next week with the manufacturing and service sector PMI releases for June. Following a February plunge, China’s economy has recovered strongly in subsequent months, which is reflected in PMI indices for manufacturing and services that have remained above the breakeven 50 level for the past three months. For June, there will be some interest in whether a renewed COVID-19 outbreak in China has had any impact on economic activity or the outlook.
For the manufacturing sector, the consensus forecast is for the PMI index to ease to 50.5, though importantly that would remain above the key 50 level. The new COVID-19 outbreak might have some impact on the service sector, although the services PMI is expected to edge up to a still reasonably healthy level of 53.7. Overall, confidence surveys through Q2 appear consistent with a solid economic rebound after the slump in Q1 GDP.
Previous: 50.6 & 53.6 Consensus: 50.5 & 53.7 (Manufacturing & Services)
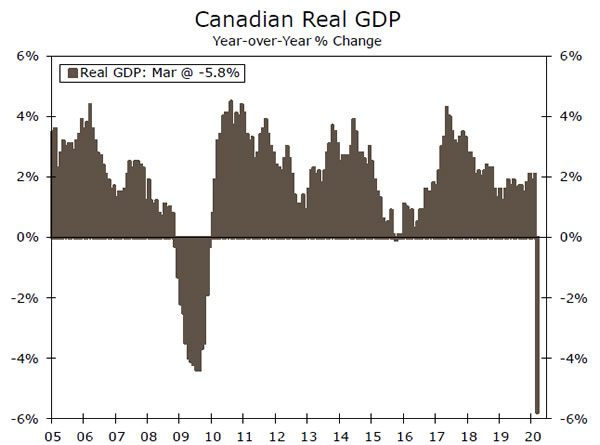
Canada GDP • Tuesday
Canada’s April GDP is due next week, with other activity indicators suggesting another sharp monthly fall. April retail sales fell 26.4% month-over-month and manufacturing sales dropped 28.5%, while employment fell by almost 2 million in April. Given these readings, April GDP is expected to decline 11.5% month-over-month, with some risk of a larger decline. The projected decline in April would see the level of GDP 15% below its Q1 average, setting the economy up for a historically large fall in Q2. The good news, if you could call it that, is that April could mark the low point for the economy. May employment showed a perceptible increase and Statistics Canada’s early estimates indicate a sizable jump in May retail sales. In recent months, the statistical agency has offered early GDP estimates, so any figures for May GDP will be watched with interest. Still despite signs of recovery, the depth of the earlier 2020 decline means a large fall in full year 2020 GDP is virtually inevitable.
Previous: -7.2% Consensus: -11.5% (month-over-month)
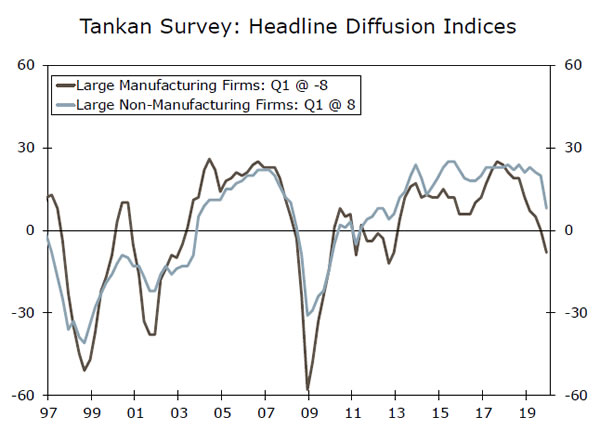
Japan Tankan Survey • Wednesday
Japan’s Q2 Tankan survey is released next week, a closely followed and timely indicator of Japan’s economic performance. The economy has struggled since late 2019 in the wake of the consumption tax increase, with two consecutive quarterly GDP declines. The consumer has been weak in recent months, with large falls in spending in March and April followed by a barely perceptible improvement in early retail indicators for May. Overall, the Tankan survey should confirm another sequential decline in economic activity is likely for Q2 and that the pace of the downturn intensified. The large manufacturers’ diffusion index is expected to drop 22 points to -30, while the large non-manufacturers’ index should fall 28 points to -20. While sizeable declines, those readings would still not be as weak as during the global financial crisis. They would, however, be consistent with our forecast for Q2 GDP to fall 5% quarter-over-quarter.
Previous: -8; 8 Consensus: -30; -20 (Large Mfg; Large Non-Mfg Indices)
Point of View
Interest Rate Watch
Low Rates Aid Case for Stimulus
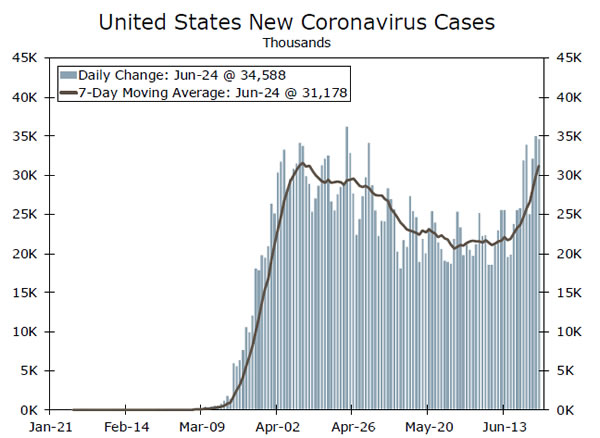
In the past few weeks, COVID-19 new case growth in the United States has picked up significantly (top chart). As new cases have ramped up, some people have begun to grow concerned that accelerating total cases will dent the budding economic recovery, either due to policy-driven restrictions on activity or voluntary behavioral changes in response to the health risks posed by the virus.
If faster case growth does lead to a weaker recovery, the case for additional fiscal stimulus is likely to grow. But, with the federal budget deficit already likely to be a historic 16% of GDP this year, one might wonder whether more fiscal stimulus is even possible. What policies would be needed is a question for a different column, but whether the federal government can borrow more is a separate question.
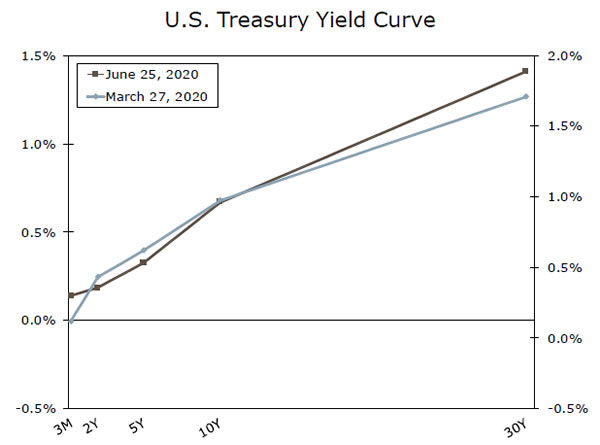
Since the CARES Act was passed on March 27, Treasury yields have barely budged, with the 10Y yield sitting almost exactly where it was three months ago (middle chart). These historically low yields come even though the Treasury has issued a net $2.3 trillion of new securities over that period. To put that number into context, consider that roughly 12% of the entire national debt held by the public has been issued in the last 90 days.
Of course, this is not to say that this pattern is sustainable indefinitely. But if yields were much higher today than they were when the sizable stimulus packages were passed in March and April, these higher debt servicing costs would make another big round of fiscal stimulus more difficult to support.
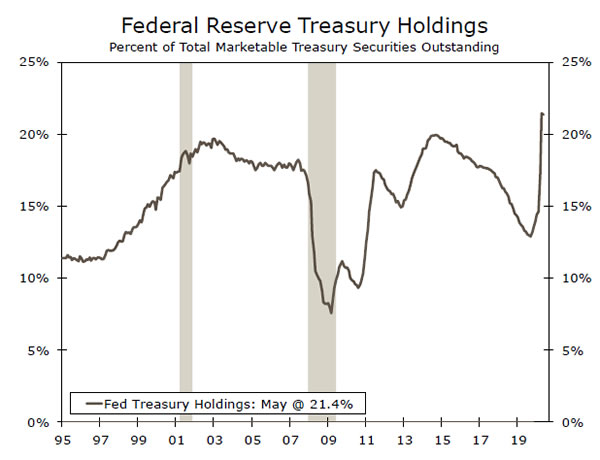
As a final point, it is hard to make the case that yields are this low due solely to the Federal Reserve’s aggressive Treasury purchases. Yes, the Fed’s Treasury holdings have ballooned over the past few months. But due in part to the aggressive pace of debt issuance, the Fed’s holdings of Treasuries as a share of the overall market were just 21.4% at the end of May (bottom chart). This is only about three percentage points higher than it was 15 years prior during the more “normal” summer of 2005. Roughly four in every five dollars invested in the U.S. Treasury market is held by someone other than the Fed, and those investors continue to buy despite very low rates.
Credit Market Insights
Bright Spot: Millennial’s Moving In?
As we wrote in our most recent housing chartbook, the housing sector appears to be a bright spot in the fledging economic recovery. While the housing market has not weathered the coronavirus crisis entirely unscathed, new home sales and home construction have proved resilient, particularly compared to some other sectors of the economy. There are a couple reasons for this. For one, job losses thus far have been concentrated among younger, hourly workers, who are more likely to be renters. Also, Millennials are aging into their home buying years, providing a strong demographic tailwind for housing demand. This is not only an important trend for the housing sector, but the broader economy, as a lack of wealth can have deleterious effects on household formation. A recent analysis by the Center for Household Financial Stability at the Federal Reserve Bank of St. Louis found that Millennials have 34% less wealth than what would be expected based on the experience of prior generations. Much of this disparity can be explained through homeownership. For households headed by individuals under 35 the homeownership rate was 43% in 2005, but only 31% in 2015. Part of this is due to the Great Recession, which delayed the traditional transfer of housing and wealth more broadly from older cohorts to younger generations. Many baby boomers stayed in their homes longer to recover the equity lost from the home price collapse, while many Millennials accumulated debt in the form of student loans or other types of consumer credit.
Topic of the Week
A Better Way to Examine the Case Growth
The jump in case counts of COVID-19 particularly over the past week have unsettled financial markets and reintroduced questions about the shape of the recovery. As we weigh the impact of the recent spike in cases and that the total number of cases in the United States is on track to surpass 2.5 million, is there a better way to think about the growing number of cases? Rather than simply keep a running tally, one approach is to just count new cases. That is what we have plotted in the top chart. The recent uptrend in new daily cases has reversed several weeks of momentum and raised doubts about whether or not we are successfully flattening the curve. In addition to questions of personal safety, elected leaders and health officials now face renewed pressure on the trade-off between a safe re-opening and economic growth.
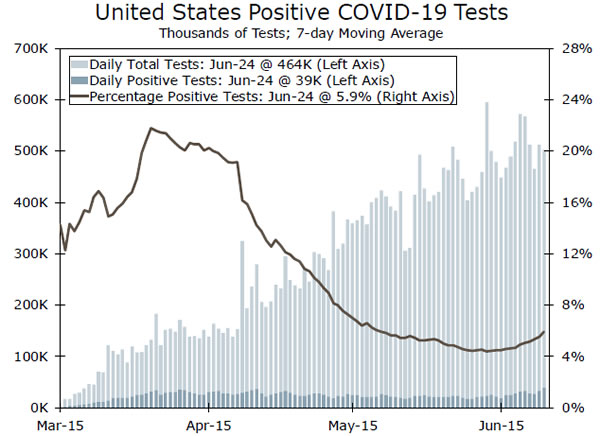
Increased Testing Doesn’t Fully Explain the Rise
Amid increased testing, another way to think about case growth is to consider the positive test rate. Helpfully, The Atlantic’s, COVID Tracking Project has been keeping tabs on this since mid-March, as depicted in the bottom chart. The lighter shaded bars indicate the overall number of daily tests being conducted. Here we can see that over half a million American’s are being tested every day, or about twice as many as were being tested in early May and an order of magnitude more than during the outset of this pandemic back in March. The darker bars indicate the number of positive tests. This figure is on the rise as well and should not be dismissed. Still, the increase here is only incremental compared with the new daily cases. The line represents the percentage of positive tests.
The fact that we are currently looking at a rate of 5.9% does represent an increase from the low of 4.4% we reached on June 9. But it is also true that the percentage of positive tests is down by about half from where it was at this time last month and only about a quarter of where it was in mid-April. Still localized outbreaks in a handful of states are seeing sharp increases in the positive case rate, which is more worrying.
On balance the rise in positive cases is a problem, but not as big a problem as the soaring number of cases would otherwise suggest.