
U.S. Highlights
- Real GDP fell by an historic 9.6% in the second quarter (32.9% annualized), led by declines in spending on services as the economy locked down in March and April.
- The fall was deep but short. Spending rebounded in both May and June. Consumer spending rose 5.2% in June, with all major categories seeing improvement.
- Income supports go a long way in explaining the resurgence in consumer spending. The expiry of extended UI benefits at the end of July puts this at risk and represents a clear and present danger to the economic recovery.
Canadian Highlights
- This week’s GDP report showed that the Canadian economy officially returned to growth in May, expanding by 4.5%, with another 5% tentative gain forecasted in June.
- Gradual easing of restrictions continues to bring a welcome relief to many business owners across the country. As a result, the CFIB business barometer improved for the fourth consecutive month in July, rising to 61.3.
- While the worst of the pandemic appears to be behind us, there is still a long and risky recovery ahead. The operating environment for many Canadian firms remains tough, and the CFIB estimates that one in seven businesses could close as a result of the pandemic.
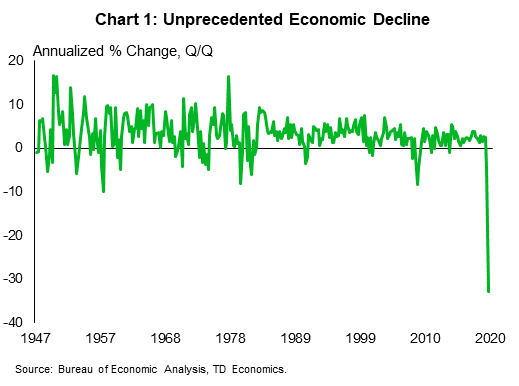
U.S. – Historical Decline in GDP As Virus Struck in Q2
It was an historic week in economic data as the Bureau of Economic Analysis confirmed the largest pullback in economic activity in the history of the quarterly series (data going back to 1947). Real GDP fell by 9.5% in the second quarter (or, as it often reported, 32.9% annualized).
This was a unique economic decline. Falling consumer spending on services made up nearly 70% of the drop in GDP in the quarter. Typically in recessions, services spending is relatively unscathed. Amazingly perhaps in a health crisis, spending on healthcare made up nearly a third of the overall decline in GDP. The pullback reflects the exceptional circumstances brought on by the virus and the sudden lockdown of the economy in the final weeks of March, including non-essential medical procedures. The pace of decline was fastest in April, the first month of the second quarter. Spending rebounded in May and June as the economy re-opened.
Indeed, June income and spending data, also released this week, showed consumer spending growing by 5.2% in the month (non-annualized), with all categories seeing gains. Spending increases were led by goods categories, especially durables, which rose 8.8%. As of June, goods spending was nearly 5% higher than its pre-crisis level, with durable goods spending 9.5% above its February level. Services spending, however, still has a way to go, down close to 12% from its pre-pandemic level.
The strength of the spending rebound is attributable to the income supports provided by the federal government. As a result of one-time support checks and expanded unemployment insurance, real disposable personal income (DPI) grew by 9.6% in the quarter (non-annualized), despite the fall in GDP. Importantly however, income showed the opposite pattern of spending, with strong growth in April when one-time support checks went out, followed by declines in May and June.
This speaks to the importance of fiscal supports in maintaining the economic recovery. Negotiations in Washington on the next wave of support are ongoing but stalled this week. This as extended unemployment benefits expired on July 31st. As a result of the expiry, income will fall further in August for the close to 30 million people currently receiving this life line. Without additional supports, spending will retrace the improvement seen in May and June and set the recovery back.
In fact, warning signals that the economic recovery is tapering off in July continued to build in other indicators this week. Weekly jobless claims rose in the week ending July 25 for a second straight week. There is an important caveat to this data – it is seasonally adjusted to reflect typical July patterns, which may be less accurate in the current environment. Unadjusted, claims fell in the week. However, even here, the improvement appears to have stalled at a level still consistent with a deep economic contraction. The rise in COVID cases and slowdown in economic progress has not gone unnoticed. Consumer confidence pulled back in July, falling six points to 92.6, moving it further away from its peak of 132.6 in February..

Canada – GDP Shows First Signs of Recovery
Equity markets were choppy this week amid Q2 GDP data showing the devastating impact that the pandemic had on the economies across the globe, as well as news of rising infections and tightening restrictions in some countries. This also weighed on energy prices, with the benchmark WTI oil price back below $40/barrel. Despite this, the S&P/TSX index looked set to end the week higher at the time of writing.
COVID-19 case counts have also ticked higher in several Canadian provinces in July, however, infections and hospitalizations have so far remained manageable, keeping regional reopening plans largely on track. Indeed, this week the populous Toronto and Peel regions in Ontario got the green light to move to Stage 3 of the reopening process.
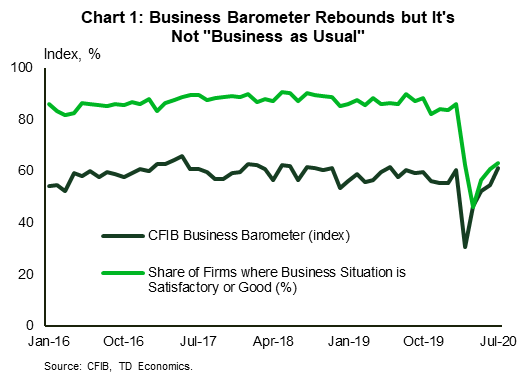
With the economic engine being gradually switched back on, many timely economic indicators have been signaling a rebound in activity, bringing a welcome relief to many business owners. The CFIB business barometer, a measure of small business expectations and confidence, improved for the fourth consecutive month. The index rose to 61.3 in July – the best reading in over a year.
While this is an encouraging sign, it needs to be interpreted with caution. Other index components suggest that business environment remains far from normal. For example, only 63% of respondents have said that business conditions are good or satisfactory, down from an average of nearly 90% prior to the pandemic (Chart 1). Furthermore, a sizeable portion of businesses were no longer responding to the survey, suggesting they may have closed, potentially biasing the July figures upward.
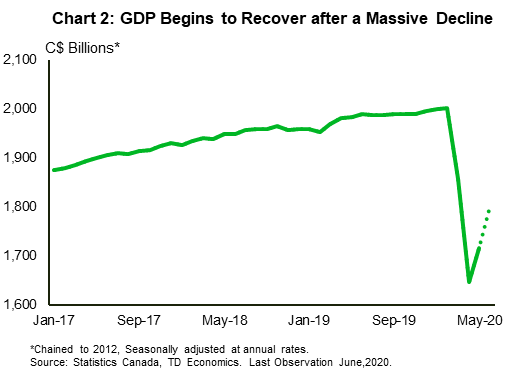
Still, the worst of the pandemic hit is now behind us. This week’s GDP report showed that the Canadian economy officially returned to growth in May, expanding by 4.5%, with another 5% gain forecasted by Statistics Canada for June (Chart 2). These robust advances still leave economic activity in June 10.4% below February’s reading, pointing to a long and risky recovery still ahead. Evidence from other countries shows that the risk of a second wave is real. Complicating the outlook, many emergency support measures will begin to roll off this fall.
A separate CFIB report also echoed this, estimating that 158,000 (or one-in-seven) of small businesses were at risk of closing due to COVID-19. Not surprisingly, the figure is significantly higher for businesses operating in hospitality and arts & recreation industries, where nearly a third could close. Regionally, the highest proportion of businesses at risk were in Alberta (at nearly 20%), followed by Ontario and Saskatchewan (at 16% each).
Without a doubt, even with recent improvement, the operating environment for many Canadian firms remains tough due to heightened global macroeconomic uncertainty, low energy prices, remaining restrictions, and the potential for a renewed pullback in economic activity if cases continue to rise. This is why, as we note in our recent report, the evolution of business activity indicators has been less robust that those of households. This tells us that as companies navigate these risks, the economic recovery is unlikely to be even, with many sectors feeling the pain for some time.
U.S: Upcoming Key Economic Releases
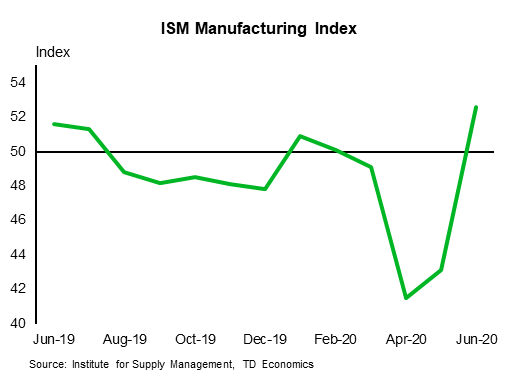
U.S. ISM Manufacturing Index – July
Release Date: August 3, 2020
Previous: 52.6
TD Forecast: 54.0
Consensus: 53.6
Regional surveys point to another rise in the manufacturing ISM index, even with the second wave of COVID cases; a rise has been signaled by the already released regional surveys. The report will likely mainly reflect data for the first half of the month. Meanwhile, upward momentum is being threatened by the second COVID wave. Timely indicators for the economy broadly have been showing a fading of upward momentum.
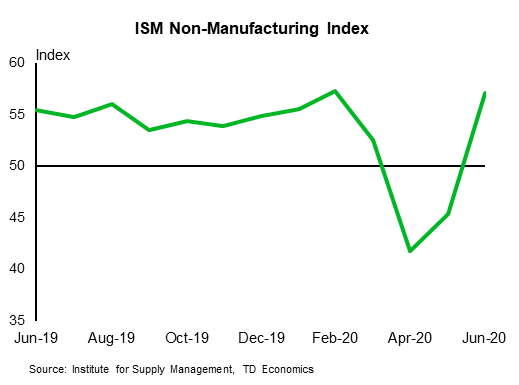
U.S. ISM Non-Manufacturing Index – July
Release Date: August 5, 2020
Previous: 57.1
TD Forecast: 54.5
Consensus: 55.0
Fallout from the second COVID wave has probably been greater for services firms than manufacturing firms, and we expect the non-manufacturing ISM index to be down this week even as we expect the manufacturing index to be up. Markit’s services PMI was up in early July, but it was still low relative to the non-manufacturing ISM index. (It rose to 49.6 in the flash report from 47.9 in June.)
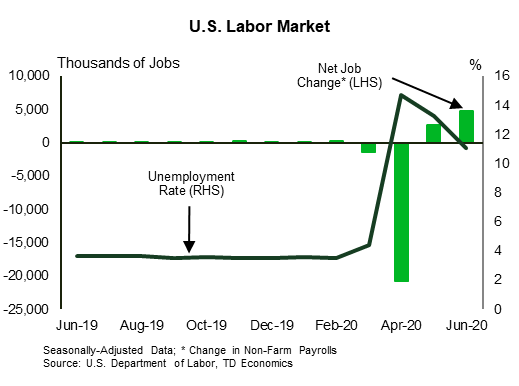
U.S. Employment – July
Release Date: August 7, 2020
Previous: nfp 4.8mn; unemployment rate 11.1%;
TD Forecast: nfp 0.5mn; unemployment rate 11.1%;
Consensus: nfp 1.5mn, unemployment rate 10.5%;
The second-consecutive surge in retail sales is likely to be mirrored in the broader consumer spending series, although more recent high-frequency data suggest slowing, starting in late June (TD: +5.5%). The slowing is likely due to a fading of support from stimulus payments as well as fallout from rising COVID cases. Income likely fell in June, even with employment up strongly (TD: -0.8%). PCE inflation likely picked up on a m/m basis, but not by enough to offset recent weakening; the 12-month change in core prices probably held at 1.0%, which is down from 1.7% in Q1.
Canada: Upcoming Key Economic Releases
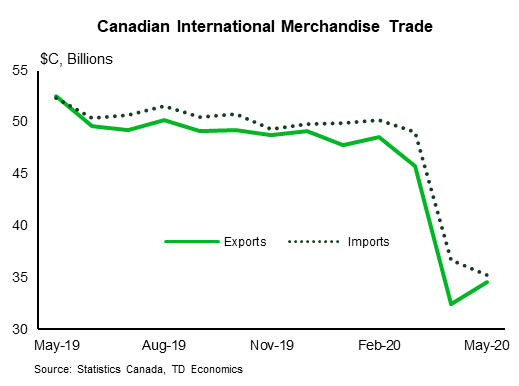
Canadian International Merchandise Trade – June
Release Date: August 5, 2020
Previous: -$0.68bn
TD Forecast: $1.0bn
Consensus: NA
The international trade balance should push into positive territory in June with TD looking for a $1.0bn surplus, as a sharp increase in export activity will be partially offset by higher imports. Motor vehicles exports should lead the advance on a return to normal production levels while a significant increase in crude oil prices should bolster nominal energy exports. Non-energy exports (excluding motor vehicles) should see more modest gains, consistent with the steady improvement in global manufacturing conditions. Stronger imports should offset much of the export growth, with motor vehicles and parts expected to make a large contribution, although softer import growth is a risk that would add to the trade surplus.
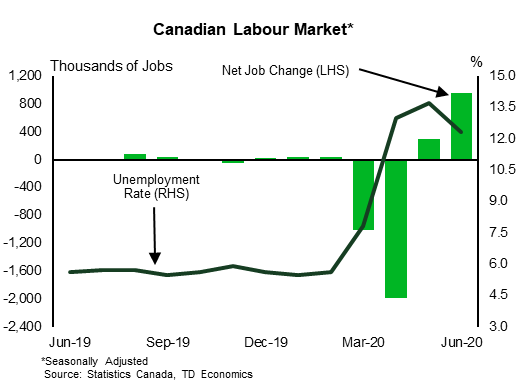
Canadian Employment – July
Release Date: August 7, 2020
Previous: 952k, unemployment rate: 12.3%
TD Forecast: 350k, unemployment rate: 11.5%
Consensus: NA
The pace of hiring is set to slow in July with TD forecasting job growth of 350k, down from 953k in June. This reflects a moderation in the rollback of emergency measures and if realized would leave the unemployment rate at 11.5%. Mobility trends and other high-frequency indicators have continued to improve through the month, albeit at a more modest pace than June, and CERB claims have continued to trend lower. Like June, we expect the hardest-hit industries across the service sector (retail, accommodation, food services) to lead job creation while Ontario and Quebec should outperform on a regional basis. Hours worked will be closely watched in addition to the headline print for insight into economic activity for July.


