U.S. Highlights
- Despite a surge in COVID-19 cases in July, economic data remained broadly positive. Vehicles sales rose 11.3% to a better-than-expected 14.5 million (SAAR). The ISM indices also ticked up on the month and beat expectations.
- Importantly, the employment report confirmed that the jobs recovery continued in July, albeit at a slower pace. The U.S. added a better-than-expected 1.8 million jobs, while the unemployment rate fell to 10.2% from 11.1% in June.
- A downward trend in new infections in very recent days marks another positive development. Hopes are also high for a new stimulus package. But, it is unclear if an agreement regarding the stimulus can be achieved in short order.
Canadian Highlights
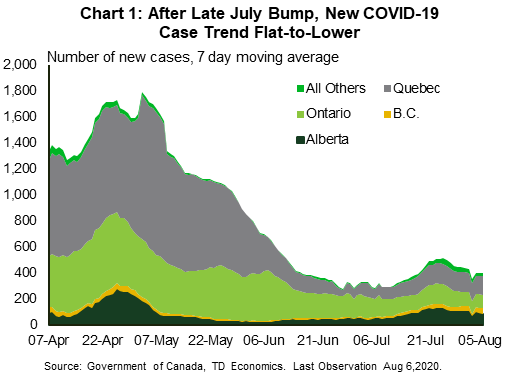
- The pace of new COVID-19 infections eased this week, led by Ontario and Alberta. Equity markets enjoyed strong gains early in the week, buoyed by rising gold prices.
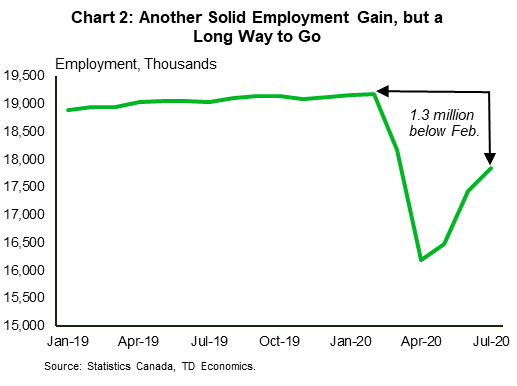
- Economic data painted a solid picture of ongoing recovery. Canada added 419k net jobs in July, bringing the unemployment rate down 1.4 points, to 10.9%. International trade also continued to recover in June, supported by the auto sector.
- Regional real estate boards reported eye-popping sales growth in July (22% to 46% y/y gains among the larger boards). Notably, despite the strength, the effective lack of a spring market means cumulative sales remain below historic norms.
U.S. – Jobs Recovery Continued in July, Albeit at Slower Pace
After last week’s dismal (though expected) GDP print, this week’s data had a comparatively more positive feel to it. The data indicate that the recovery was still chugging along at the start of the third quarter, although momentum has slowed.
Auto sales continued to improve for the third consecutive month in July, rising by 11.3% to a better-than-expected 14.5 million (SAAR) units. In similar fashion, the ISM indices made gains on the month and came in better than expected. The manufacturing index rose 1.6 points to 54.2 in July, with broad-based gains across subcomponents. Its non-manufacturing counterpart did not exhibit the same breadth of gains, but the headline still ticked up one point to 58.1, thanks to a sizable pickup in new orders. While the ISM indices are signaling an expansion at the fastest pace since early 2019, it is important to recall that both sectors are coming out of a very low activity period.
When it comes to gauging the overall health of the labor market, the monthly employment report takes the cake. The July report showed that the recovery in jobs continued last month, albeit at a slower pace (Chart 1). The economy added 1.8 million jobs, beating market expectations. Gains were concentrated in leisure & hospitality, government and retail trade. This brought the three-month tally to 9.3 million, which means that a little over 40% of the jobs lost in the March-April period have been recovered.
The unemployment rate, meanwhile, improved further in July, falling to 10.2% from 11.1% in June, as the number of unemployed persons fell by 1.4 million. The theme of more Americans being called back to work remained evident in July as the number of people on temporary layoff fell 1.3 million to 9.2 million, while the number of those on permanent layoff was virtually unchanged at 2.9 million.
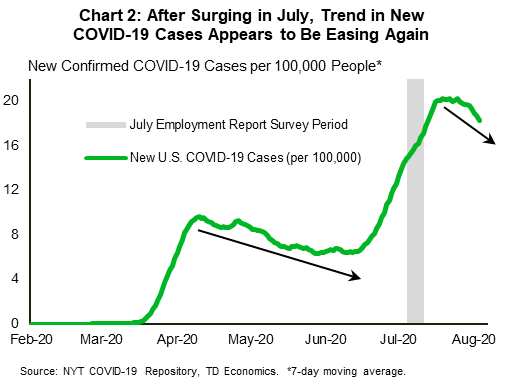
With new COVID-19 infections surging last month, several states hit the pause button on reopening – a major factor behind slowing momentum. With the spread of the virus still elevated, near-term risks appear tilted to the downside. The recent expiration of the $600-per-week enhanced unemployment benefits, which helped buoy retail spending in recent months, is another potential thorn on the side of the recovery.
Despite everything, there are indications that this latest health-induced hurdle too shall pass in time. For instance, over the last several days, infections appear to be slowing again on a trend basis (Chart 2). If sustained, this downward trajectory will eventually help grease the wheels of the reopening process.
At the same time, a new stimulus package that’s being negotiated in Washington is expected to lend another hand to the recovery. Hopes are high for stimulus on several fronts (enhanced unemployment benefits, stimulus checks, aid to small business and state and local governments, along with rent, mortgage and food assistance). But, given large outstanding differences in Congress, it is unclear if an agreement can be achieved in short order. Timing is of the essence to avoid further financial stress and to support the confidence channel.

Canada – Of Curves and Mountains
The shortened week brought a solid gain for Canadian equity indices despite some softness at the time of writing. Markets were helped by a climb in the price of gold. Even headlines late in the Thursday session, later confirmed, that President Trump would place 10% tariffs on certain aluminum products did not appear to shake investors. There was encouraging news this week on the battle against COVID-19. The Canadian infection curve has established a better trend than seen late last month. New case counts were back down into double digits in both Ontario and Alberta for much of the week, an encouraging development, even if a clear downtrend has yet to be re-established (Chart 1).
The infection curve may look quite different from the spring, but the shock of the pandemic means that the economy still has a metaphorical mountain to climb back to ‘normal’. This week brought more examples. July saw another expectation-breaking jobs report, with 419k net positions added (consensus: +390k) and the unemployment rate dropping 1.4 points to 10.9%. That may have put the economy over the halfway line, but there is still a long way back up, with 1.3 million pre-crisis jobs yet to be recovered (Chart 2). Ongoing re-openings mean that we can probably expect a decent report next month, but getting back to pre-pandemic levels is likely to be a drawn-out process – remember that a ‘U’ or ‘swoosh’ shaped recovery will feel like a V until it doesn’t (i.e. an initial, partial bounce was always to be expected). Many sectors will not be able to return to normal operations any time soon.
It was a similar story for international trade. Both goods exports and imports shot higher in June, with nearly all categories showing improvement. The biggest contributor, however, was autos, as production continued to normalize on both sides of the border. But again, the scale of the shock cannot be understated. Despite a massive 17% monthly climb in goods exports, the level of exports is still 18% below February levels. We’re a long way from normal, and that’s before considering trade in services, where restrictions are likely to weigh on activity for some time.
In a very Canadian fashion, one sector has delivered an outsized recovery: housing. It will be a bit longer until we get a complete picture for July, but what we’ve seen so far is eye-popping. The Toronto Regional Real Estate Board reported a near-30% y/y increase in sales, or roughly 50% month-on-month (accounting for seasonal variation). Similarly, Greater Vancouver reported a 22% y/y gain in sales, and Montreal, a 46% gain. At this stage, it seems like two factors are at play. First, a shifting of the spring market, which was made effectively non-existent thanks to COVID-19, into the summer months. It is notable that despite huge recoveries in June and July, cumulative sales so far this year are still below typical levels, suggesting further catch-up activity may be coming.
The second factor is the reality of the uneven impact of COVID-19 on households. Last month, employment was at about 93% of pre-pandemic levels, but this masks a split between income levels. For low-income Canadians, the figure was 85.4%, while among other paid employees, it was 97.4%. The bottom line is that the economic impact of the pandemic has been uneven along almost any metric you can mention, and the recovery is shaping up the same way.
U.S: Upcoming Key Economic Releases
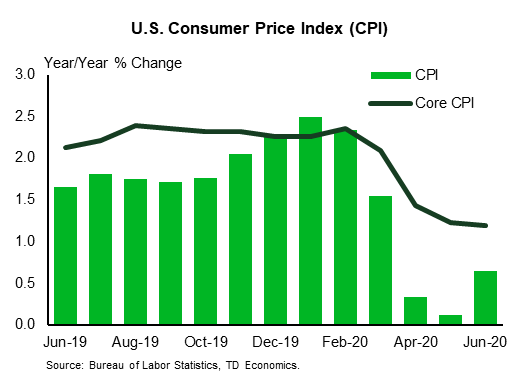
U.S. Consumer Price Index– July*
Release Date: August 12, 2020
Previous: 0.6% m/m, 0.6% y/y
TD Forecast: 0.4% m/m, 0.8% y/y
Consensus: 0.3% m/m, 0.7% y/y
The CPI likely rose strongly, and not just due to gasoline. We forecast a 0.3% m/m rise in core prices, above the 0.1% averaged over the past year. As in June, when core prices rose 0.235%, we expect unwinding of some of the March-May plunge in travel-related prices (such as airfares and hotel rates) to outweigh slowing in rents. That said, the slowing in rents is probably more indicative of the trend in the year ahead. We expect the 12-month change in core prices to remain low at 1.2% in the July report. That is down from 2.4% in February (pre-COVID). The 12-month change in the overall index probably rose to a still-low 0.8% from 0.6% in June; it was 2.3% in February.
U.S. Retail Sales– July*
Release Date: August 14, 2020
Previous: 7.5% m/m, ex-auto: 7.3%
TD Forecast: 2.2% m/m, ex-auto: 1.5%
Consensus: 1.8% m/m, ex-auto: 1.3%
Retail sales likely slowed in July after huge gains in May and June, but they were probably still up solidly, even with the second COVID wave. A sizable gain in autos has been signaled by the units data, while gasoline spending was probably boosted by higher volumes as well as prices. We expect more slowing in the data for bars and restaurants and the control series. The level of spending will likely be up sharply from the Q2 average, helping put real GDP on track for a fairly strong gain in Q3 after the huge plunge in Q2.

Canada: Upcoming Key Economic Releases
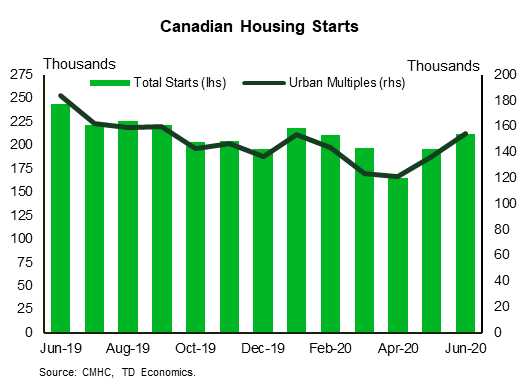
Canadian Housing Starts – July*
Release Date: August 10, 2020
Previous: 212k
TD Forecast: 205k
Consensus: NA
Housing starts are forecast to slow to a 205k pace in July on a slight pullback in the more volatile multi-unit component. Multi-unit starts have risen 27% in the last two months and currently sit at their highest level since September. We think these gains are unlikely to be sustained into July, especially in light of softening pre-sale transactions across the GTA and uncertainty over the immigration outlook. A modest pullback to 205k would still leave starts trending above the 6m average of 200k.
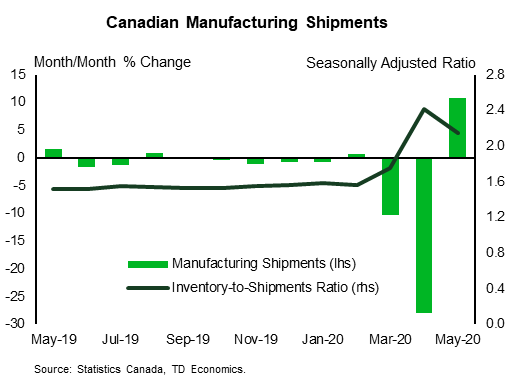
Canadian Manufacturing Sales – June*
Release Date: August 14, 2020
Previous: 10.7%
TD Forecast: 17.1%
Consensus: NA
TD looks for manufacturing sales to build on recent strength with a 17.1% m/m increase in total shipments, slightly above StatCan estimates for 16.8%. Normalized auto production will provide the main source of strength after Canadian plants resumed operations in late May; monthly production figures recovered to February levels in June which itself could contribute around 10% to headline growth. Elsewhere, refinery shipments will benefit from a combination of higher gasoline prices and more summer driving, while broad strength in US industrial production hints at gains elsewhere. Higher factory prices should see volumes post a slightly softer increase but one that would still signal an acceleration in economic activity from June..