
U.S. Review
Bringing Down the Hammer
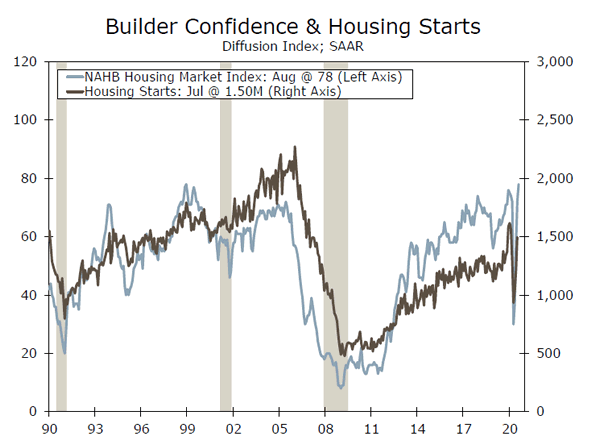
- Despite indications of lost momentum elsewhere, residential construction activity is picking up steam. A key survey shows confidence among homebuilders in August tied an all-time high set in 1998 and housing starts figures released this week handily exceeded expectations.
- Existing home sales rose 24.7% in July as the annualized pace of sales rose above 5.8 million.
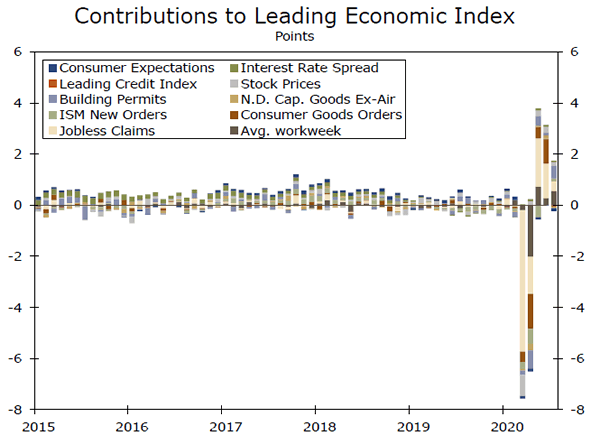
- The leading economic index increased in July, but for the second straight month it did so at a slower pace.
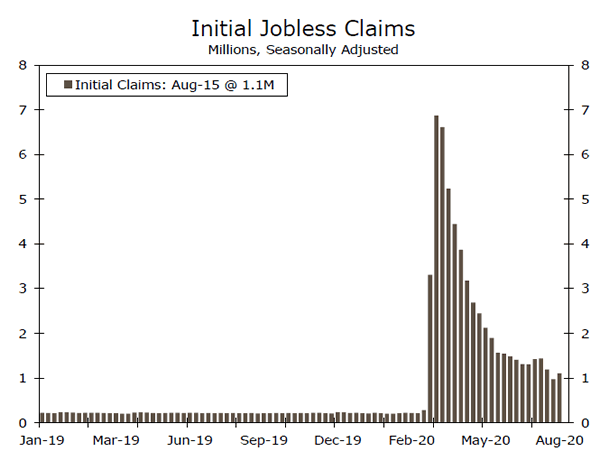
- The number of people filing for unemployment insurance crested back up over a million in the first week of August.
Claims Rise Amid Slipping Momentum in Rebound
The trend in the economic data in recent weeks has been that the initial post-lockdown snapback in activity has given way to a less robust pace of recovery. The loss of momentum was largely evident in the economic data this week as well, although there were a few positive surprises.
One area that was emblematic of the momentum loss was jobless claims, which increased after declining on trend for several weeks. Regular state-level continuing claims actually fell during the first week of August, but claims for the Pandemic Unemployment Assistance program rose. After failed deal negotiations on Capitol Hill, executive actions from the Whites House provided $300 in extra weekly benefits starting in September, down from $600 at the end of July, but states need to apply to FEMA and reconfigure payment processes. While payments will be retroactive, only a handful of states have been approved and the delay in payments will weigh on spending given the lofty ranks of the unemployed.
The leading economic index (LEI) rose 1.4% in July, which was larger than the 1.1% that had been expected. The fact that this increase comes after June’s figures were revised higher makes the outperformance all the more impressive. While this marks the third consecutive monthly increase, it also marks the second month in a row in which the size of the increase was smaller; on brand for a recovery that is losing steam.
The two biggest contributors to the LEI’s better-than-expected outturn in July were the average work and building permits. As factories reopened and people returned to work after the shutdowns, hours continued to rise off a low base; so the gain here was largely expected.
The jump in building permits, was stronger than expected. This is often one of the last of the LEI components to be collected. This week, the report on housing starts and building permits for July hit the wire on Tuesday, just two days prior to the LEI.
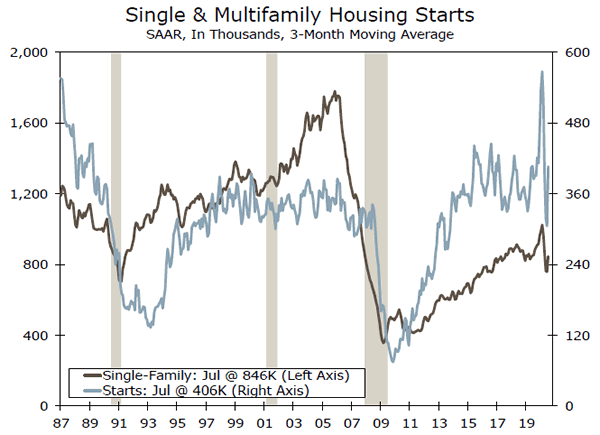
Surprise Surge in Multi-family Lifts Housing Starts
According to the most optimistic forecast of 62 economic shops polled by Bloomberg, the best we could expect out of housing starts amid a pandemic was a monthly increase of 11.3%. When the actual number printed, housing starts blew past that – in fact, precisely doubling it. Overall starts jumped 22.6%, with single-family starts rising a solid 8.2% and multifamily starts surging ahead 58.4%.
The big jump in multifamily starts explains the miss. This series is quite volatile from month to month. The vast majority of multifamily starts are for apartments, which have seen vacancy rates increase in recent months and have seen rents ease up a bit. The weakness in highly visible markets like New York may be weighing on forecasts for the sector. Our take is that demand for apartments outside these mega-metro areas has actually remained fairly strong and rents have held up much better. In fact, as renters migrate from large, densely-populated, high-cost metro areas that could spark demand and construction activity in lower cost, more spread-out cities.
U.S. Outlook
New Home Sales • Tuesday
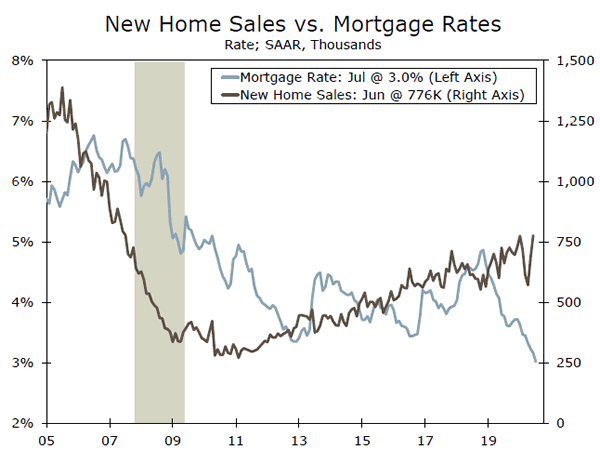
Housing has largely been resilient to the economic disorder created by the coronavirus. Sales slipped during the initial lockdowns, due to the inability to show homes, but have since bounced back. The resiliency of the housing market may seem inconsistent with high unemployment. Massive job losses have indeed led to a rise in late or missed rent and mortgage payments—something we continue to monitor. But, job losses have been concentrated in lower-paid industries and in many cases industries where workers tend to be younger and more likely to be renters rather than buyers. Demand for homes is thus being bolstered by a shift in demographics. Many millennials who were on the cusp of homeownership have likely accelerated their timeline to take advantage of record-low mortgage rates and meet an increased desire for more living space. There are thus some favorable fundamentals supporting the housing market and we expect the housing rebound continued into July.
Previous: 776K Wells Fargo: 799K Consensus: 775K (SAAR)
Durable Goods Orders • Wednesday
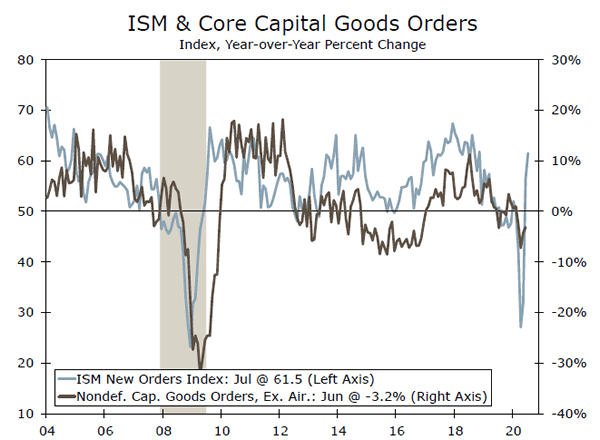
Durable goods orders likely continued to rebound in July, but with millions of workers still out of work and businesses conserving cash, a complete recovery remains a ways off. The new orders component of the ISM manufacturing index rose to 61.5 in July, comfortably above the 50-mark designating expansion. While the ISM is a diffusion index and thus a measure of the breadth rather than the degree of change in activity, the July new orders index suggests activity picked-up compared to June, and bodes well for durable goods orders Auto manufacturing has been a bright spot lately as auto sales have regained more than half of their virus-related drop. Auto manufacturing likely continued to rebound in July. Shipments of nondefense capital goods will provide our first taste of how equipment spending is set to fare in Q3. Equipment spending fell at nearly a 40% annualized rate in Q2, but momentum at the end of the quarter sets Q3 up for a sizeable rebound in terms of its growth rate.
Previous: 7.6% Wells Fargo: 3.7% Consensus: 4.0% (Month-over-Month)
Personal Income & Spending • Friday
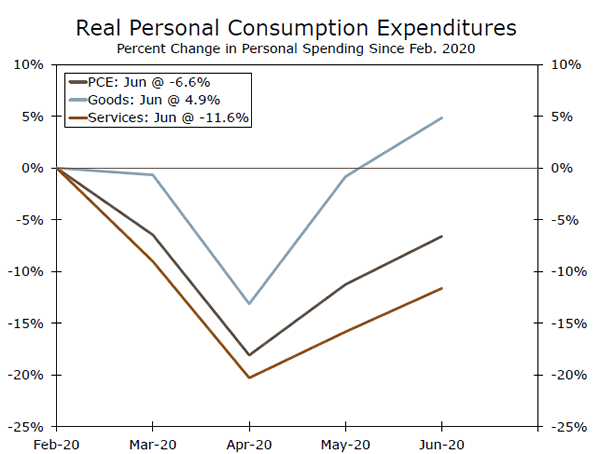
The headline reading for personal income has masked some pretty big swings under the surface in recent months, particularly in wages and salaries and unemployment benefits. July will likely be no different—but it does mark the final month of the $600/week supplemental jobless benefits. By our estimates, the additional $300/week implemented by President Trump will, at the earliest, hit unemployment checks in the final week of August and likely only last about four weeks. Furthermore, the stand-still between Congress and the White House over additional stimulus points to a looming income cliff for consumers. In terms of spending, July retail sales data point to a continued rebound. Retail sales are now above their pre-virus level, but the retail data miss services consumption, which accounts for the bulk of personal spending. Retail sales and personal spending thus may diverge in the months ahead as services will likely hold back the broader recovery in spending.
Previous: -1.1%; 5.6% Wells Fargo: -0.2%; 1.5% Consensus: -0.5%; 1.5% (Month-over-Month, Inc.; Spend.)
Global Review
How Quickly Will Japan’s Economy Bounce Back?
- COVID-19 has wrought a far lower human toll on Japan than in most of Europe or the United States. Japan has a total of close to nine deaths per million people, in comparison to 530 per million in the United States or 587 per million in Italy.
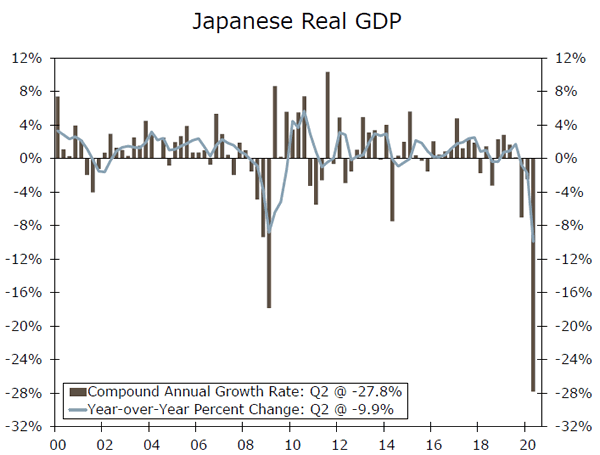
- Despite a less severe lockdown, the Japanese economy has taken a nosedive like many of its developed market peers. Data on Q2 real GDP growth in Japan was released this week and showed a 27.8% annualized contraction.
- Europe’s August PMI surveys were mixed. The U.K. PMIs firmed further, including the strongest reading for the services PMI since 2013. In contrast the Eurozone services PMI softened, but remained (just) in growth territory.
How Quickly Will Japan’s Economy Bounce Back?
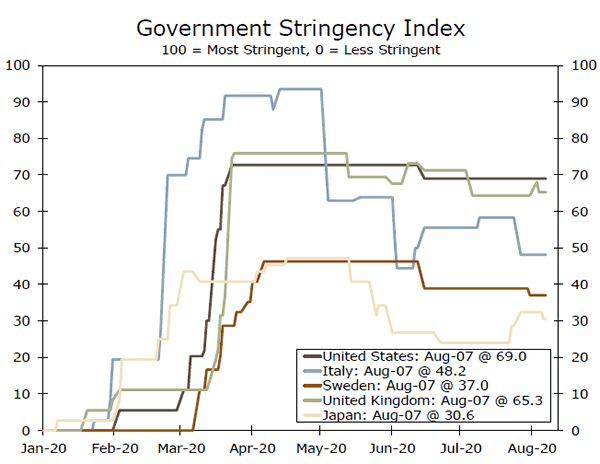
COVID-19 has wrought a far lower human toll on Japan than in most of Europe or the United States. Japan has a total of close to nine deaths per million people, in comparison to 530 per million in the United States or 587 per million in Italy. With a less serious public health situation, policymakers in Japan have generally adopted less stringent limitations on mobility and private activity (top chart).
Despite a less severe lockdown, the Japanese economy has taken a nosedive like many of its developed market peers. Data on Q2 real GDP growth in Japan was released this week and showed a 27.8% annualized contraction (see chart on front page). Although the quarterly declines in real GDP in Japan in the first half of 2020 were not as big as they were in the United States or the Eurozone, this comes with a caveat: the H1-2020 contraction in Japan comes on the heels of a 7% annualized contraction in Q4-2019 due to an increase in the country’s consumption tax. On a year-over-year basis, real GDP was down 9.9% in Q2-2020, a bit more than the 9.5% contraction in the United States, but still less than the 15.0% collapse in the Eurozone.
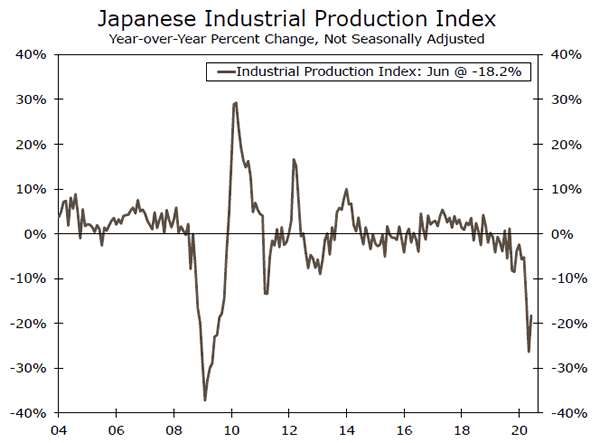
Japanese economic data with a monthly frequency suggest a rebound began to take hold towards the end of the second quarter. Retail sales surged 13.1% in June and are now “only” down 1.2% year-over-year (for comparison, U.S. retail sales increased 2.3% year-over-year in June). Japanese industrial output rose in the month of June for the first time since January, and if May marks the bottom in factory sector output the year-over-year decline would actually be less severe than it was at the bottom of the Great Recession (middle chart). Nonetheless, industrial activity still appears to have some way to go before fully recouping its COVID-induced declines.
On the labor market front, employment was down just 1% in June, a far cry from the 8.6% contraction in the United States over the same period. That said, PMI readings for the manufacturing and service sectors were both in the mid-40s in July, and the job-toapplicant ratio fell in June for the sixth consecutive month, a sign that workers looking for jobs may be facing increased competition amid a weakening labor market. For further reading on the Japanese economic outlook, see our recent special report.
Mixed Fortunes for Europe’s Economies
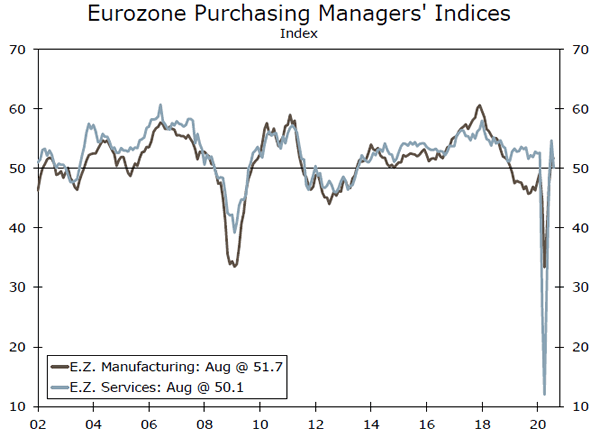
Europe’s August PMI surveys showed a contrasting performance on either side of the English channel. The pace of Eurozone recovery stumbled slightly, as the manufacturing PMI was broadly steady at 51.7 but the services PMI fell to 50.1, and employment indices remained in contraction territory. New COVID cases have rebounded across the Eurozone and mild restrictions have been reimposed in some countries for places like restaurants, bars and discos. In the United Kingdom the August PMI surveys were more upbeat. The manufacturing PMI rose to 55.3, but it was the rise in the services PMI that was particularly impressive with the reading of 60.1 being the highest level since 2013. Employment indices were below 50, consistent with ongoing job declines.
Global Outlook
Mexico Eco. Activity Index • Wednesday
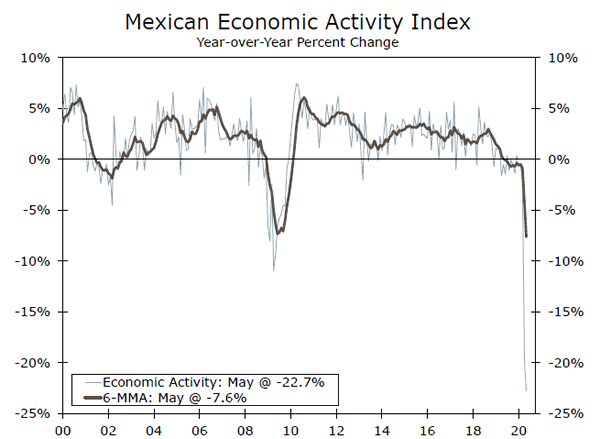
It appears that economic activity in Mexico bottomed in May. Output collapsed a historic 22.7% year-over-year in May based off of a widely followed economic activity index. The June data released thus far have been better, and this should be reflected in some improvement in the June economic activity index reading to be released next Wednesday. Industrial production in June rose 17.9%, the first monthly increase since January, and vehicle exports in June were the highest since March. On the consumer front, retail sales in June increased 7.8% (month-over-month).
That said, this improvement is off of an extremely low base, and the Mexican economy likely remains in a rough place. Mexico’s economy was struggling even before COVID, and the country’s relatively weak fiscal policy response to the economic crisis will likely limit the country’s rebound in H2-2020. New COVID cases and deaths appear to have plateaued, but still remain stubbornly high.
Previous: -22.7% Consensus: -13.10% (Year-over-Year)
Bank of Korea Meeting • Thursday
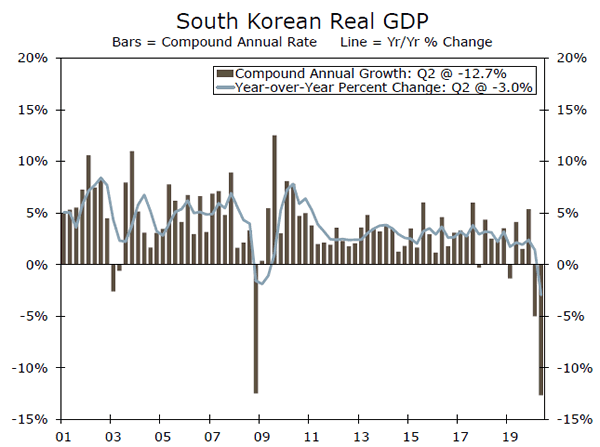
At its meeting next week, policymakers at the Bank of Korea will be faced with the (relatively) enviable position of discussing monetary policy in the context of an economy that was not completely imploding in the second quarter. Real GDP “only” contracted at a 12.7% annualized rate in the second quarter. Perhaps even more remarkable, private consumption actually grew in the quarter, likely one of the few developed market economies about which that can be said. Admittedly this came on the heels of a sizable contraction in Q1, and consumption was still down 4.1% year-over-year, but overall the South Korean economy has held up reasonably well. Controlling the virus’ spread, as well as ample fiscal capacity and a willingness to use it, have been key ingredients in the South Korean recipe for limiting the economic damage. A weak external sector, however, exhibits how important controlling the virus is on a global basis: exports were down 13.6% year-over-year in Q2.
Previous: 0.50% Consensus: 0.50% (7-Day Repo Rate)
Canada Q2 GDP • Friday
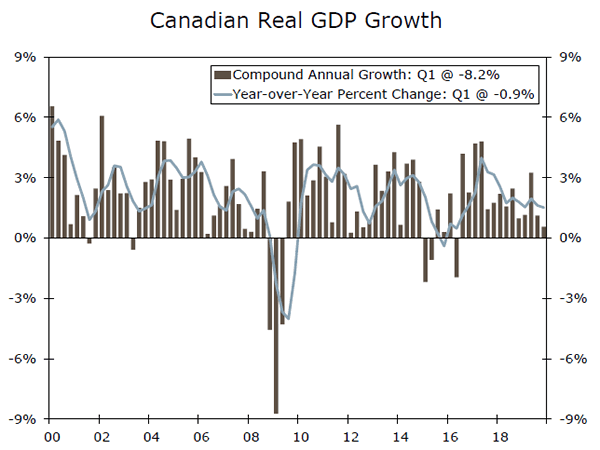
When Q2 real GDP data for Canada are released next week, they will likely confirm what has already been shown in the United States, Europe and elsewhere: Q2-2020 was one of the weakest periods of economic activity in living memory. Specifically for Canada, the data have born a striking resemblance to the U.S. GDP data: a 5%-10% annualized contraction in Q1, followed by a historic 35%-40% annualized contraction in Q2. If the Bloomberg consensus proves correct, the 9.4% year-over-year decline in Canadian real GDP would be almost exactly the same as the 9.5% year-over-year decline in the United States.
As we look toward Q3, keep an eye on the Canadian labor market. Canada has recovered about 55% of the jobs lost in March and April, but a pickup in part-time employment overstates some of the strength. Full-time employment has only recovered about 40% of the jobs lost in March and April.
Previous: -8.2% Wells Fargo: -40.0% Consensus: 38.9% (Quarter-over-Quarter, Annualized)
Point of View
Interest Rate Watch
Fed Tools: The New vs. Tried and True
Fed officials deemed monetary policy to be in a good place at the FOMC’s July meeting, as evidenced by no policy changes and no dissents. But with the pandemic causing a high degree of uncertainty over the outlook, the meeting minutes showed several officials suggested more stimulus could help speed the recovery and drive inflation up to target. What might that look like?
Yield curve control (YCC), where the central bank would state a target for Treasury rates and buy whatever amount needed to keep them there, was one tool being looked at. But officials did not seem eager to undergo such a strategy anytime soon.
Long-term yields are already quite low, reducing the need to adopt a new strategy at the moment. In addition, many officials were concerned that YCC could cause the balance sheet to balloon since the Fed would be committing to specific yields, rather than a dollar amount of asset purchases like with quantitative easing (QE). How to communicate an exit of such a program without causing a dislocation in the market could also be difficult.
While it may take more time or different circumstances for the FOMC to warm up to YCC, the committee seems more likely fall back on forward guidance. Forward guidance was used over the past cycle, so the committee already has experience with it. It is also “free” in the sense that the FOMC is not putting itself on the hook to buy assets in a given amount (QE) or if yields breach a certain level (YCC).
Informally, Fed officials have already used forward guidance to signal policy will be accommodative for some time (e.g., Powell’s comment in June that “we’re not even thinking about thinking about raising rates”). Under formal forward guidance, the FOMC would pledge to keep the fed funds rate unchanged until a specific time (calendar-based) and/or outcome tied to inflation, the labor market or both (threshold-based).
While the FOMC discussed additional ways in which it could support the recovery, officials believe it can’t go it alone; “strong fiscal policy support would be necessary to encourage expeditious improvement.”
Credit Market Insights
Mortgage Refi Costs Set to Rise
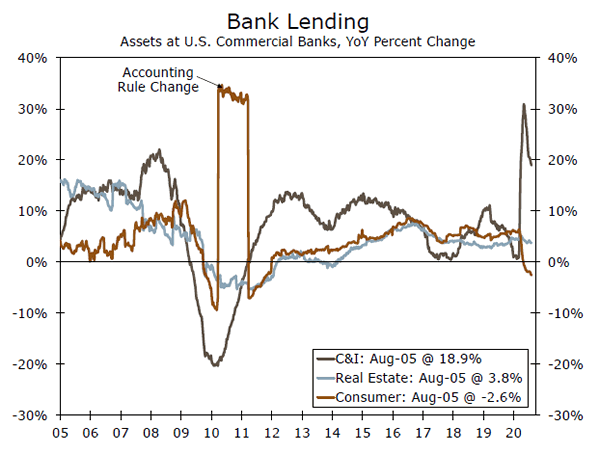
Mortgage refinancing is set to become more expensive. The FHFA recently announced a new price adjustment (0.5% of the total loan amount) will come into effect for all refinance transactions starting in September. This comes against a backdrop of record low mortgage rates, which fell below 3% for the first time in mid-July. Rates have ticked higher in recent weeks but remain low (the 30 year fix averaged 3.13% during the week of August 14th). Applications for refinancing spiked in early March, and while activity has since cooled down, applications are still up over 38% over the past year. The FHFA has stated that the new fee is due to increased economic and market uncertainty. A wider spread between mortgage rates and government bond yields, however, may also be playing a role. Mortgage rates tend to track 10-year Treasury yields, and the former has not fallen quite as fast as the latter, leading to wider lender margins. The FHFA, which oversees Fannie Mae and Freddie Mac, may view expanding lender margins as an opportunity to build the capital reserves of the GSEs as they move towards an exit from conservatorship. Still, the move seems to be in conflict with the Fed’s mission to support household finances by keeping interest rates low. Mortgage refinancing plays a key role in the transmission of monetary policy (by getting more cash in the hands of homeowners to boost consumer spending). In short, higher refinancing costs could offset the positive economic effects of low mortgage rates.
Topic of the Week
Will Back-to-School Shopping Be Strong?
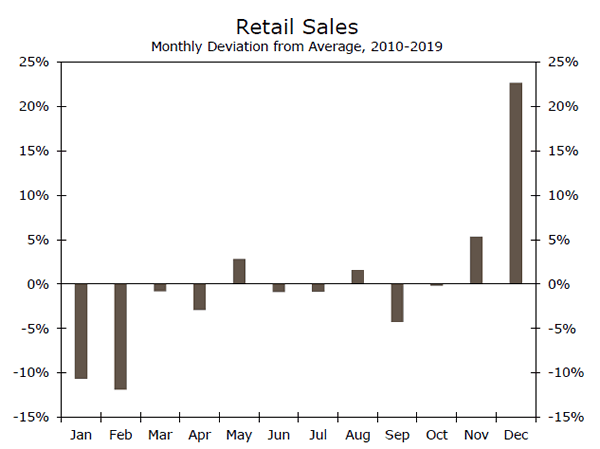
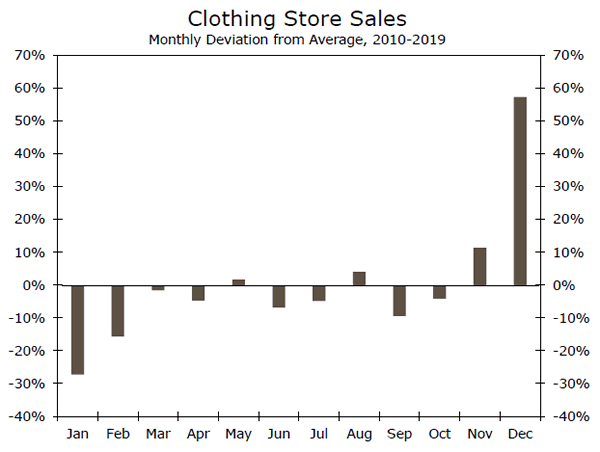
August is usually a strong month for retailers due to backto- school shopping. Retail sales (excluding autos, auto parts and gasoline) in August were 1.6% higher than the average month during the 10 years that spanned 2010 through 2019 (top chart). Of course, the holiday season dominates the retail calendar. Retail sales in November were typically more than 5% stronger than the average month, and sales in December stood 23% higher. Retail spending subsequently slumped in January and February as the holiday frenzy subsided. That said, back-to-school spending means that August is usually a good month for retailers. As shown in the bottom chart, sales at clothing & clothing accessory stores in August were 4% higher than the average month during the 2010-2019 period.
But many students will not be heading back to school this year, at least not in a physical sense, due to the pandemic. Do students really need new clothes and other types of school supplies if they will be learning at home via online instruction rather than in the classroom? Could August be a bust for many retailers this year?
The National Retail Federation (NRF) thinks not. Indeed, the NRF believes that this could be a record year for backto- school shopping. The NRF’s annual back-to-school survey shows that parents of K-12 students plan to spend an average of $789.49 per family, up from the record of $696.70 they said they would spend last year. The average amount that parents of college-age students plan to spend shot up from $976.78 last year to $1,059.20 this year. Why are families planning to spend record amounts this year in the face of a severe economic slump?
Many parents reason that they will need to upgrade their electronic resources if their children will be online this year. The NRF’s survey found that laptops, speakers and headphones, and other types of computer accessories are high on parents’ shopping lists, and online retailers are expected to do well relative to their brick-and-mortar counterparts. We will find out how strong the back-toschool season was when the Commerce Department releases retail sales data for August on September 16.


