
U.S. Highlights
- Federal Reserve Chair Powell unveiled a change in the Fed’s monetary policy strategy, announcing that it will target an inflation rate “that averages 2% over time” (instead of a strict 2% goal), and that it will be concerned with shortfalls of employment from its maximum level (rather than deviations). Taken together, these mean a bias to keeping rates on hold well after economic recovery sets in.
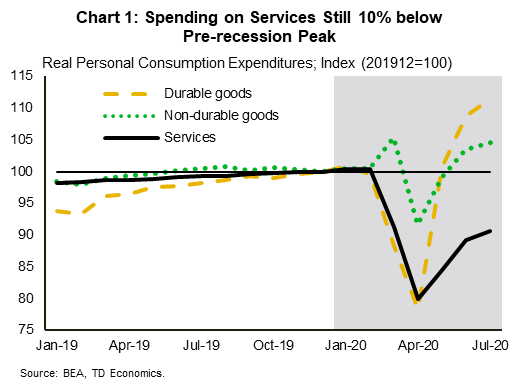
- Personal income and spending data this week showed continued, albeit slowing progress in recovering from the pandemic-induced shock earlier this year. Real personal spending rose 1.6% in July down from 5.7% in June. Total spending is still 4.9% below its pre-recession peak, with the deficit entirely due to spending on services.
Canadian Highlights
- Canadian real GDP contracted at a nightmarish 38.7% annualized pace in the second quarter. However, the decline was driven by March/April weakness, and the picture has since improved. To this point, monthly GDP rose 6.5% m/m in June.
- While third quarter growth should be strong, momentum is easing. Statcan’s nowcast points to a slower 3% monthly gain in July GDP. And, the CFIB business barometer index dipped by a few points in August.
- Markets were more focused on the annual meeting of central bankers that would normally be in Jackson Hole. BoC Governor Macklem spoke at the symposium, but his speech left markets with little to help infer the future stance of monetary policy.
U.S. – Federal Reserve Flips the Script, Targets Average Inflation
It’s not easy being a central banker. The job of the Federal Reserve – to keep the economy and inflation on an even keel with just its power over the monetary printing press – has been made a lot more difficult by the unprecedented global pandemic. While lower interest rates certainly help, as evidenced by the strong rebound in activity in the auto and housing market, there is still a large hole to fill in other areas of spending less sensitive to interest rates. Things like food services and accommodation, healthcare, and recreation services, which together make up 90% of the deficit in spending relative to January of this year, will not return to normal as long as the virus threat remains. Until they do, employment will remain impaired.
It’s not just the health crisis that has complicated the Federal Reserve’s task of achieving maximum employment and price stability (which it interprets as an inflation rate close to 2%). Its traditional policy lever – the fed funds rate – is consistently impaired by the effective lower bound. Once it cuts to near-zero, it must turn to less traditional tools such as large scale asset purchases. At the same time, the relationships between economic variables that it relied on to achieve its mandate appears to have weakened. A hot labor market does not seem to put upward pressure on inflation the way it seemed to in the past.
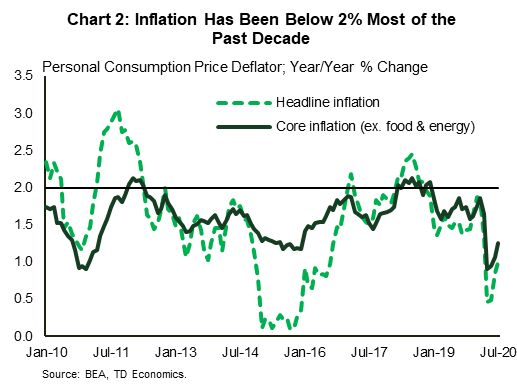
Faced with challenges to achieving its goals, the Federal Reserve has decided a chance of tack is necessary. Nothing too revolutionary of course, but a recognition that it should be more concerned with employment undershooting its goal than outperforming it. At the same time, having consistently over-predicted the future path of inflation over the past decade, it has come to the view that it should be less concerned about overshooting its 2% objective. So, rather than targeting a forecast of 2% inflation, it will target a rate that includes the recent past – an average inflation target. In other words, if inflation has underperformed, due, for example, to a period of economic weakness, it will not immediately tighten policy even if inflation pushes higher than 2%.
It’s worth unpacking the theory behind this last change. The thinking is that controlling future inflation depends on influencing people’s expectations for it. In order to get inflation up to its (now average) target it has to convince people that its ok being a little behind the curve when it starts to show up. It remains to be seen how effective this can be. Communication will be challenging. People don’t especially like inflation and there will be pressure to tighten policy when the actual rate moves above 2%. The Fed has also not said how much history it is averaging over or how high it will allow inflation to overshoot, simply that it will tolerate it “moderately above 2%.” Will it tighten policy if inflation is at 2.5% or is 3% the more relevant threshold? At the same time, other influences besides expectations may keep downward pressure on price growth. Just because it wants inflation to move above 2% doesn’t mean it will. Just ask the Bank of Japan.
Still, the reaction in markets to the statement has been positive so far. Stock markets rallied on the news. This makes some sense. Taken at face value, the fed funds rate are likely to remain lower for even longer.
Canada – Ugly With A “K”
The marquee data event of the week was undoubtedly the release of second quarter GDP. Like its neighbor to the south, Canada’s report was a near wall-to-wall horror show, with GDP contracting at a nightmarish 38.7% annualized rate. Every expenditure category contracted at a record pace, although household consumption of services (down 51.8% annualized), accounted for nearly 50% of the headline decline. Elsewhere, business investment in structures and machinery and equipment fell 56.7% while residential spending plunged 47.6% – plagued by an April shutdown in Quebec’s construction industry and a massive quarterly decline in home sales. Exports (-55.6%) and imports were also down heavily (64.1%).
Despite the ugly report, markets were hardly fazed. In fact, the S&P TSX was on track to end the week higher – boosted by the financial sector – and the dollar only slightly dipped in the wake of the data (although is also on track to end the week higher). Why did markets hardly bat an eye? The GDP data is backwards looking and largely reflects huge contractions in activity during March/April. As such, markets were well prepared for the likelihood of a terrible headline figure. They were also more focused on the annual meeting of central bankers at the symposium usually held in Jackson Hole, Wyoming. Governor Macklem spoke on Thursday at the symposium, but left his comments confined to how central bankers can better communicate with the public they serve, with nothing to help infer the future stance of policy.
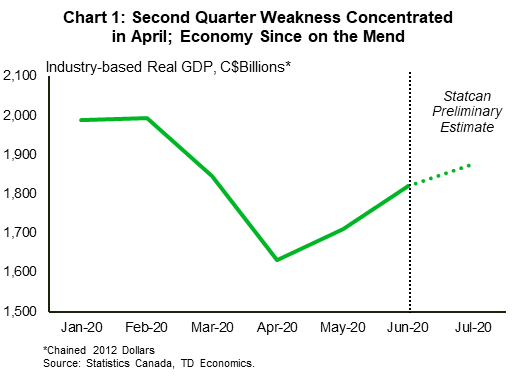
Moreover, the picture has turned brighter since April (Chart 1), with monthly, industry-based GDP already climbing in May and, rising a further 6.5% m/m in June. What’s more, Statcan’s nowcast points to a solid 3% gain in July. Taken together, this string of positive data indicates that Canada’s economy has recovered a fair chunk of output lost during March/April. And, improving growth at the end of the second quarter sets the table for massive gain in third quarter GDP. Indeed, taking Statcan’s July nowcast and assuming trend-like gains in August and September would set up industry-based GDP for a more than 40% annualized third quarter gain.
While third quarter growth will almost assuredly be extremely strong, it can’t grow that way forever and momentum is predictably slowing. We got a glimpse of this during the week with the release of the CFIB small business barometer. Small business confidence slipped by a few points in August, coming in at 59.2. This is below the long-term average. The report also signaled that, despite gains made since April, a full recovery will take some time. For instance, the net proportion of businesses reporting their current business situation as “good” improved but remained well below pre-pandemic (February) levels. The same held true for net hiring intentions (Chart 2). These results are consistent with our view for a prolonged recovery for Canada’s economy. And, this recovery is likely to be uneven, raising the risk that it could be “K-shaped”, where some industries take much longer escape the doldrums. We had stark evidence of that this week, with the number of Canadian airline passengers down 94% from February to June.

U.S: Upcoming Key Economic Releases
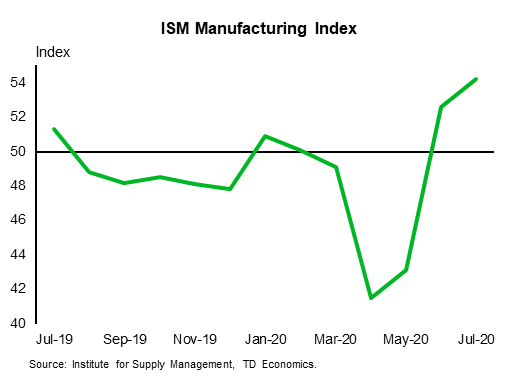
U.S. ISM Manufacturing Index – August
Release Date: September 1, 3, 2020
Previous: Mfg 54.2; Services 58.1
TD Forecast: Mfg 54.6; Services 56.8
Consensus: Mfg 54.5; Services 57.0
Other manufacturing surveys already released for August point to another fairly healthy reading for the manufacturing ISM index. That said, we suspect momentum will fade as fiscal support wanes. Conversely, the ISM services index likely remained fairly high in August, but not as high as the surprisingly strong 58.1 July reading—which was up from 57.1, despite the second COVID wave. The Markit services index was up in the preliminary report for August, but the 54.8 level was still well below the ISM index.
The PCE price index likely rose sharply in July, and not just due to gasoline prices. Core prices were likely boosted by an unwinding of some of the earlier plunge in travel-related prices. That said, the net result of recent swings appears to be significant slowing. We estimate core prices were up 1.2% y/y in July, up from 0.9% in June but still down from 1.9% in February (pre-COVID).
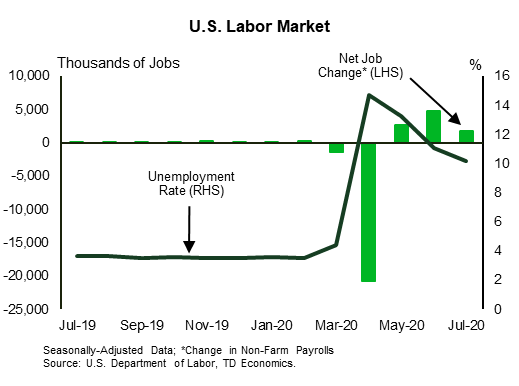
U.S. Employment – August
Release Date: September 4, 2020
Previous: non-farm payrolls (nfp) 1.8mn; unemployment rate 10.2%; average hourly earnings (ahe) 0.2% m/m, 4.8% y/y
TD Forecast: nfp 1.0mn; unemployment rate 10.0%; ahe 0.0% m/m, 4.4% y/y
Consensus: nfp 1.5mn, unemployment rate 9.8%; ahe 0.0% m/m, 4.5% y/y
Payrolls probably rose strongly by pre-COVID standards, but with the pace slowing again. Our forecast implies a decline of 11.9 million since February, down from 22.2mn through April but still consistent with a huge net increase in slack. The forecast allows for about a 240k rise in temporary census workers. The unemployment rate likely remained historically high. Average hourly earnings likely continued to show a net pickup due to mix shifts—with more net weakening in low-wage than high-wage jobs boosting the average level; our 4.4% forecast for the 12-month change compares with around 3% trend through February.
Canada: Upcoming Key Economic Releases
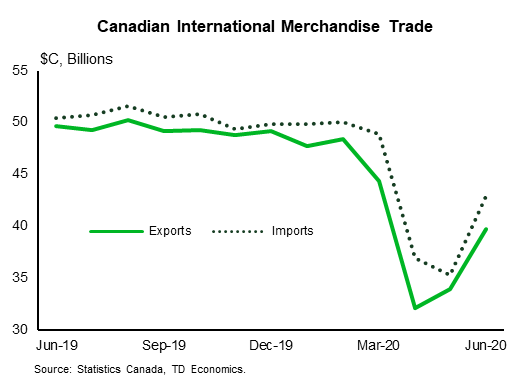
Canadian International Merchandise Trade – July
Release Date: September 3, 2020
Previous: -$3.2bn
TD Forecast: -$2.0bn
Consensus: NA
TD looks for the international goods trade deficit to narrow to $2.0bn in July, helped by another sizeable increase in motor vehicle exports. Auto production (nsa) returned to pre-COVID levels in June and held roughly stable through the next month, despite seasonal headwinds that have seen July production fall by 35% on average over the last 5 years. Forestry products should provide another source of strength while stable PADD II imports suggest little change in real energy exports. Export strength will be partially offset by a more moderate rise for imports following the 22% surge last month.
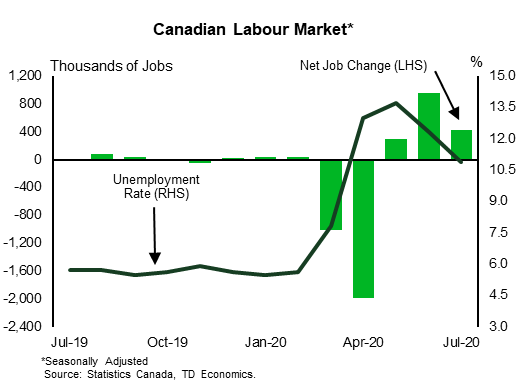
Canadian Employment – August
Release Date: September 4, 2020
Previous: 418k, unemployment rate: 10.9%
TD Forecast: 225k, unemployment rate: 10.2%
Consensus: NA
The labour market recovery is set to moderate further with another 225k workers rehired in August, down from 418k and 953k in June and July. This reflects a pause, or plateau, in re-opening plans after emergency measure rollbacks bolstered the performance in the early stage of the recovery. Nonetheless, Google mobility data has continued to show more time spent at workplaces and less time spent at residential locations through August. Emergency benefit statistics also point to lower usage of these programs, with 447k CERB applications during the reference week, down ~10% from the July LFS. Recent changes to the CEWS will also benefit the labour market, with a larger share of employers who qualify for wage subsidies. Should job growth slow to a 225k pace as expected, it will pull the unemployment rate to 10.2%, assuming some further recovery in labour force participation, and leave total employment 5.8% below pre-COVID levels.


