
U.S. Highlights
- After reaching new highs early in the week, financial markets tumbled, driven by a broad sell-off in technology stocks. The S&P 500 is on track to end the week about 3% below last week’s close.
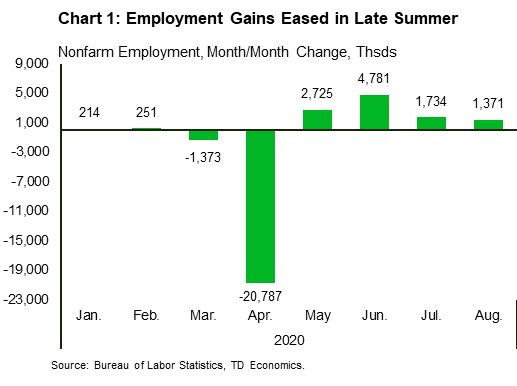
- The labor market recovery continued as the economy generated 1.4 million jobs in August, and the unemployment rate fell to 8.4%. However, the pace of the recovery has slowed from previous months, a theme that is echoed in other economic data.
- In speeches throughout the week, Fed officials warned about the fragility of the current recovery. They emphasized the importance of additional government help in supporting the recovery going forward.
Canadian Highlights
- August was a hot month in some of Canada’s already-sizzling housing markets. Data from Toronto and Vancouver real estate boards revealed large year-over-year gains in both sales and prices.
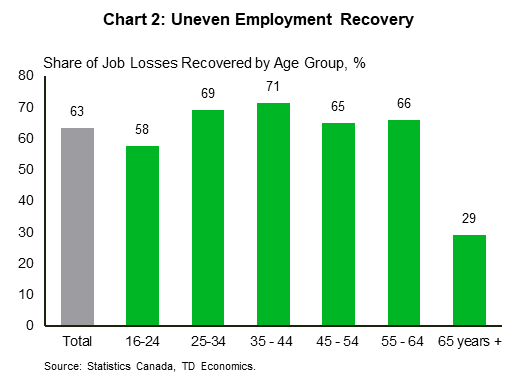
- There was a bit less heat in the labour market. The employment recovery continued in August, but at a slower pace. Employment rose by 246k on the month, considerably less than gains seen in prior months. So far nearly two-thirds of the jobs lost in March and April have been recovered.
- Elsewhere, we are also seeing activity level off. Following three months of gains, new vehicle sales in August were roughly flat vs. July. With the bulk of “re-opening” now behind us, spending growth also eased.
U.S. – Labor Market Mending Continues, but Risks Are Mounting
This was a volatile week for U.S. financial markets. Fresh highs early on were followed by a sharp drop, driven by a broad decline in technology stocks and signs of slowing economic momentum. As of writing, the S&P 500 is on track to end the week about 3% below last week’s close.
On the economic front, the main highlight was the release of the August employment data. As largely expected, the American economy continued to churn out jobs last month, albeit at a slower rate than in June and July (Chart 1). Indeed, August saw a total of 1.4 million net new jobs added, down from 1.7 million in July. Overall, nonfarm employment is about 7.6% below where it was in February. The unemployment rate also continued to trend lower, falling to 8.4% in August. While it has come down significantly since the apex of the crisis, it remains high by historical standards.
As unemployment fell, purchases of new vehicles jumped up 3.9% month/month in August (from 12.4% in July), to 15.2 million units. Meanwhile, the recovery in international trade progressed further in July, as exports rose by 8.1% (from 9.6% in June), and imports grew by 10.9% (from 4.6% in June).
In contrast, other data was consistent with a slowdown in momentum. The number of people receiving unemployment benefits – or continuing claims – has ticked up to 29.2 million in all programs in the week ended August 15th. Unlike initial claims, continuing claims have yet to show any meaningful and sustained improvement. Similarly, the latest Fed Beige Book (covering the period up to August 24th) noted that hiring volatility is becoming a recurring issue, particularly in services industries. The report highlighted that as demand remains subdued, temporary furloughs are increasingly being turned into permanent layoffs. That was born out in the August jobs data, where despite a drop in overall unemployment, the number of people “permanently” unemployed (i.e. out of work, but not on a temporary layoff) rose to 7.4 million, outnumbering the temporarily unemployed (6.2 million) for the first time in months.
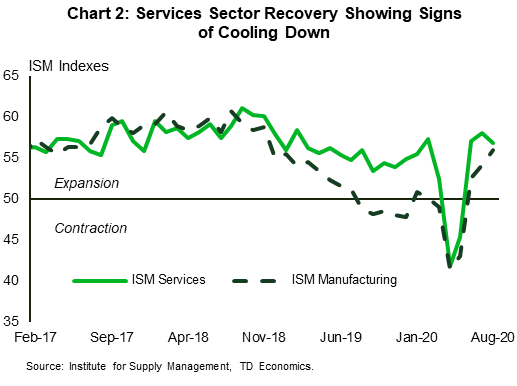
Service industries also lost some momentum in August. The ISM Services Index declined by 1.2 points to 56.9, signaling that the pace at which the services sector is expanding is slowing (Chart 2). By contrast, the ISM Manufacturing Index recorded a surprise 1.8-point gain to 56.0. Despite the top-line increase, the details reveal an uneven recovery thus far, with many businesses still holding back on investment and hiring due to elevated uncertainty.
Given the still very high level of unemployment, the moratorium on residential evictions until the end of 2020 issued by the Center for Disease Control and Prevention (CDC) was a welcome development (it applies to individuals earning less than $99,000 per year). With pandemic-related uncertainty remaining elevated, near-term risks to the economy still appear tilted to the downside. As such, continued government support will be essential in limiting financial stress to households and businesses. This was emphasized by Fed officials in speeches throughout the week, noting that additional support will be key in determining the pace of the recovery. Considering stalled negotiations around the next stimulus package in Washington, consumption growth is at risk of tapering off in the coming months. It is going to be a long and bumpy road back to economic normalcy.
Canada – The Recovery Starts Showing The “Swoosh”
Following a strong performance in August, equity markets hit a speed bump in the first week of September. A selloff in tech stocks on Thursday has hit both the S&P 500 and TSX, and even the solid employment numbers on both sides of the border failed to revive the sentiment on Friday.
It wasn’t just the temperature or equity markets; August was also a hot month in some of Canada’s already-sizzling housing markets. Data from Toronto and Vancouver real estate boards showed that sales in Toronto were up a whopping 40% y/y and were up by 20% in Vancouver. Total sales over the last eight months are now on par with their eight year average (Chart 1). Driven by brisk demand, home prices have also caught on fire. The home price index, a ‘like for like’ measure, was up 11% y/y in Toronto, and was 5.3% higher in Vancouver. Detached houses were in high demand in both cities as households looked for more space, with many adults and kids still working and learning remotely. In Toronto, the average price for detached homes was up 20% from a year ago, and was 6.6% higher in Vancouver.
The shutdown of the housing market during the typically busy spring season has altered seasonal buying patterns, shifting activity from spring into summer, and led to a considerable accumulation of pent-up demand. Furthermore, sales continue to be buoyed by low interest rates, and relatively low job losses within the higher-wage industries. Still, the current pace of activity appears unsustainable and is likely to return back to earth in the coming months once pent-up demand is exhausted and mortgage deferral measures wind down. Deferrals were largely up to six months in length, and so many will expire in September-October. In the same vein, the Office of the Superintendent of Financial Institutions (OSFI) announced on Monday that it will begin phasing out a change in its regulations that allowed the financial institutions to treat deferred loans as performing (reducing the potential hit to their capital ratios).
Elsewhere, we are already seeing the boost from pent-up demand easing. Following three months of gains, new vehicle sales in August were roughly flat vs. July, and still some 9% below their year-ago levels. Ditto for higher frequency spending trends more broadly. With the bulk of “re-opening” now behind us, spending growth begun to level off in August following an uptrend earlier in summer (report). That said, as we have discussed in this week’s report, there remain important regional differences in the pace of consumer spending and the broader recovery.
The labor market recovery continued in August even if at a slower pace. Employment rose by 246k on the month, roughly in line with consensus but considerably less than in prior months. So far nearly two-thirds of the job lost in March and April have been recovered (Chart 2). All in all, while much of the recovery to-date likely felt like a V, we are likely entering the “swoosh” phase, meaning that regaining the final third of job losses could be the longest stretch in the road to recovery. The disinflationary pressures could persist even longer, suggesting that, similar to the Fed, the Bank of Canada will likely be building even more patience into its future policy framework (see report).

U.S: Upcoming Key Economic Releases
U.S. Consumer Price Index– August
Release Date: September 11, 2020
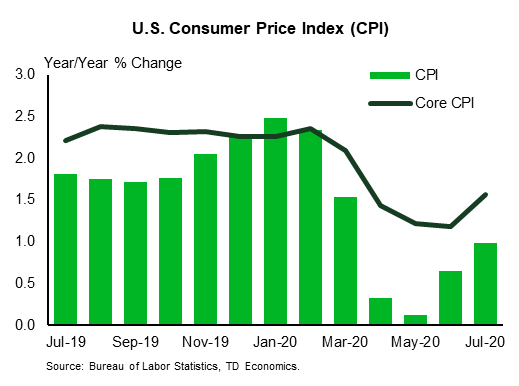
Previous: 0.6% m/m, 1.0% y/y; core 0.6% m/m, 1.6% y/y
TD Forecast: 0.3% m/m, 1.3% y/y; core 0.3% m/m, 1.6% y/y
Consensus: 0.3% m/m, 1.2% y/y; core 0.2% m/m, 1.6% y/y
The core CPI probably rose fairly strongly again (+0.3%), led by a COVID-related surge in used vehicle prices. It rose strongly in June and July as well, but that followed a plunge. Through the COVID-related volatility, we believe the trend has weakened, led by rents. We estimate core prices remained at 1.6% y/y in August. That is up from 1.2% in June but down from 2.4% in February. We forecast total CPI to advance 0.3% m/m and 1.3% y/y.
Canada: Upcoming Key Economic Releases
Bank of Canada Rate Decision*
Release Date: September 9, 2020
Previous: 0.25%
TD Forecast: 0.25%
Consensus: 0.25%
The September Bank of Canada meeting should be a relatively quiet affair, with no scope for the overnight rate to move from 0.25%, which will leave the focus on changes to tone of the policy statement and other policy tools. The statement make note of how growth has outperformed expectations from the July MPR but it is not all goods news, with inflation sitting near 0% and the expiration/transition away from government support programs (mortgage deferrals, CERB) looming. The stronger growth backdrop should allow the BoC to hold off on additional support measures like Yield Curve Control for now, although the declining usage of the Bank’s credit easing programs could lead to adjustments on that front. Forward-looking language should remain unchanged from the July statement, with a commitment to leave rates at the ELB until slack is absorbed.

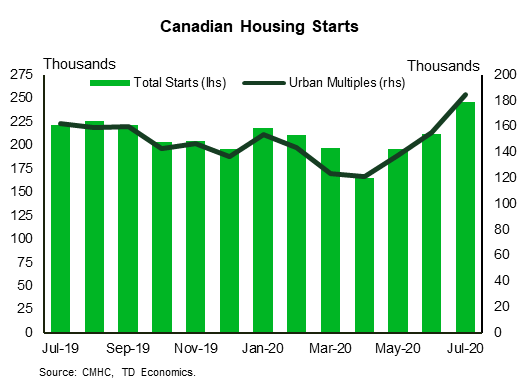
Canadian Housing Starts– August*
Release Date: September 9, 2020
Previous: 245.6k
TD Forecast: 228k
Consensus: 222k
TD looks for housing starts to slow to a 228k annualized pace in August. This is down from 246k in July but still well above the 6m trend of 204k. Multi-unit construction reached a record high last month as developers broke ground on 184k units, and permit issuance hints at some giveback with 13% fewer permits issued for multi-unit projects in July. Single family starts should fare better, with the current pace of development sitting near the pre-COVID trends.


