
U.S. Review
Jobs Rebound Continues, But Signs of Moderation Ahead
- Employers added jobs for the fourth consecutive month in August, bringing the total number of jobs recovered from the virus-related low to 10.5 million. Although the labor market continued to improve, the pace of job growth is moderating.
- The one million private jobs added is down from an average of about 2.4 million the prior three months. Further, there are still nearly 30 million workers collecting unemployment insurance.
- The rebound in the labor market should continue, but we do not expect employment to reach its pre-virus position for quite some time.
Jobs Rebound Continues, But Signs of Moderation Ahead
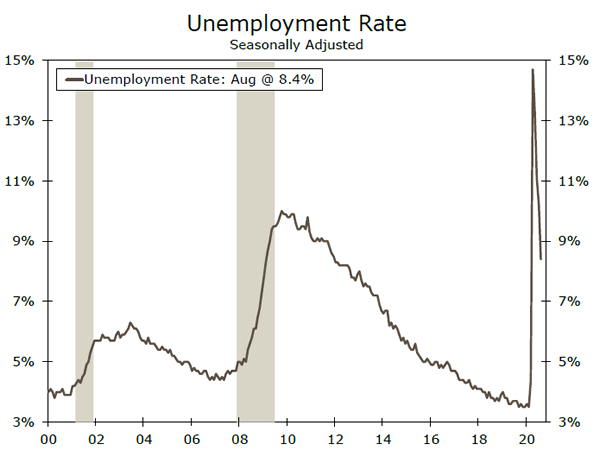
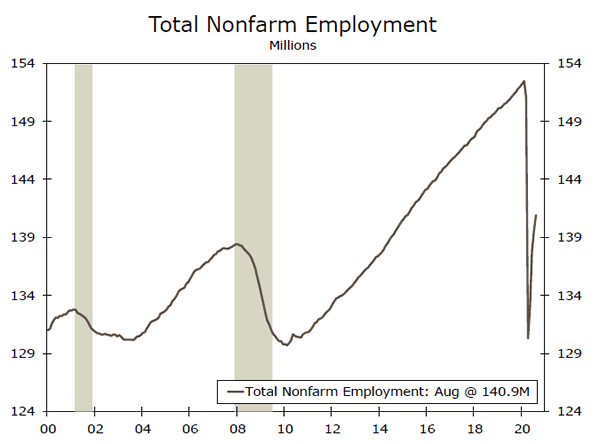
Employers added a net 1.37 million jobs in August, marking the fourth consecutive month of job gains. The headline was flattered by the 238K temporary workers hired for the 2020 Census, which showed up in government payrolls. Private payrolls advanced closer to one million, down from an average 2.4 million the past three months. What grasped analysts attention, however, was the sizeable drop in the unemployment rate, which slipped back to single-digit territory at 8.4%, thanks to the huge jump in the household measure of employment (+3.76 million jobs).
The job gain in August brought the total number of jobs recovered from the virus-related low to 10.6 million. Still, payrolls remain about 7.6% off, or 11.5 million jobs short, of their pre-virus February peak. Although the labor market continued to improve, the pace of job growth seems to be moderating.
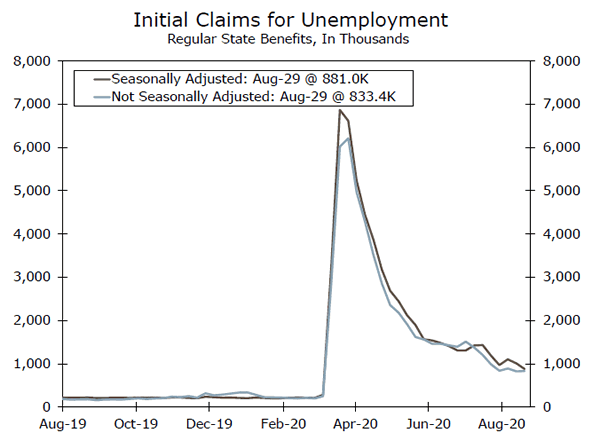
More-recent high-frequency data from Homebase point to slower job growth ahead with the measure of employees working flat lining in recent weeks. Further, there is still a staggeringly high level of workers collecting unemployment insurance. Through the middle of August, more than 13 million American’s were collecting regular state benefits. The number of recipients for all programs, including the PUA rose by 2.2 million to 29.2 million the week ending August 15. A change in methodology led to the 130K decline in the number of initial filers last week, and there were still a further 881K workers who filed an initial claim for benefits. Although claims continue to move in the right direction, the pace of decline is slowing and the still-elevated level of claimants points to a labor market that continues to experience a significant degree of disruption. The modest downward trend is, however, one sign that the labor market’s recovery has at least not gone into reverse.
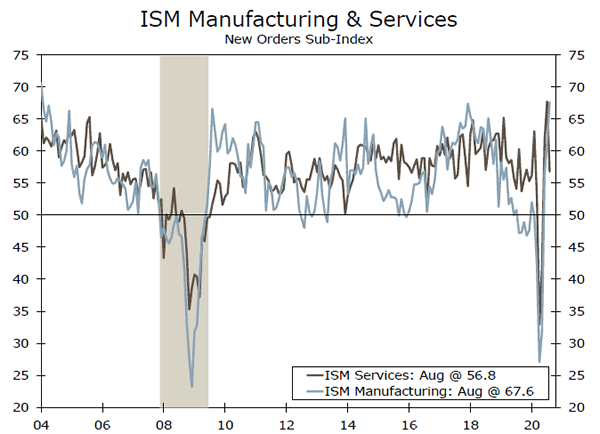
Survey evidence also suggests continued churn in the labor market. The employment components of the Institute for Supply Management (ISM) services and manufacturing indices continued to point to a mere slowing in the pace of layoff rather than outright hiring in August. Despite being a bit backward looking at this point, the need to further pare back employment, even if at a slower rate as seen in the August surveys highlights that overall demand remains weak and businesses are perhaps not fully convinced that the current recovery is sustainable.
In the near term, the manufacturing sector’s prospects continue to look good relative to many parts of the service sector, which remains constrained by its reliance on in-person interaction. The ongoing need to social distance has shifted spending away from in-person services toward goods, as exhibited by recent movements in the new orders component of the ISM indices. But looking ahead, as the pandemic drags on, lingering softness in sales and an uncertain global outlook will weigh on capital spending, so manufacturers—even those tied most tightly to goods—are hardly in the clear.
All told, we expect the pace of job growth will slow in coming months, but the labor market should continue to recover as activity picks up in the broader economy.
U.S. Outlook
Jobless Claims • Thursday
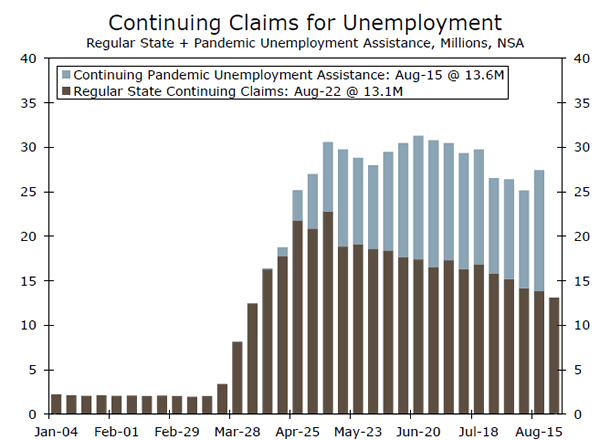
Although initial jobless claims remain abnormally high, continuing claims continue to steadily drift lower. Even still, the number of individuals making continuing claims for state unemployment benefits was more than six times higher in mid-August than it was in mid-February. The extra $600 per week in unemployment benefits provided by the Pandemic Unemployment Assistance program expired at the end of July, which reduces stimulus in two different ways. Some workers who do not qualify for state level benefits but did qualify for PUA are now receiving no benefits, and those who qualified for both are only receiving their regular state claims.
Since the extra benefit expired at the end of July, the decline in claims has been fairly comparable to the declines that were seen over the preceding couple months. This offers some evidence that, at least for those receiving state level claims, the labor supply disincentive may not have bene as big as feared by some analysts.
Previous: 881K
CPI • Friday
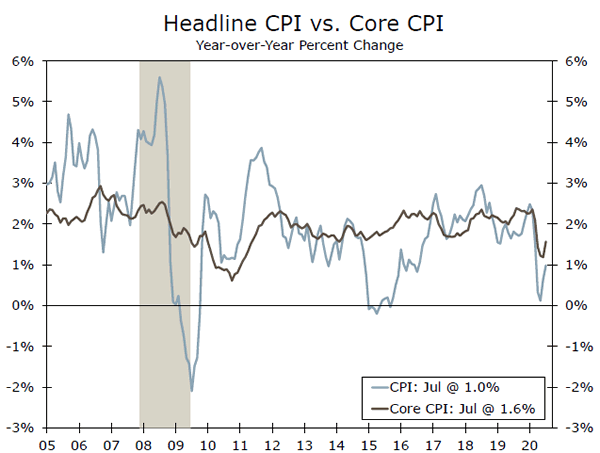
Inflation in the United States has slowed during the pandemic, with the headline CPI up just 1.0% year-over-year in July. Excluding food and energy, core inflation was 1.6%. To some extent, the huge shifts in consumption patterns brought on by COVID-19 have created measurement challenges in the inflation data, as “experienced” inflation is likely running higher than measured inflation. Many of the areas that have seen slower inflation or outright deflation have been sectors that have also experienced declining consumption as a result of the pandemic. Gas prices are down 20% year-over-year, air fares are down nearly 24%, and lodging away from home prices are down 13% year-over-year.
That said, underlying disinflationary pressures are still present. Inflation for food consumed at home has begun to ease, and shelter prices have also decelerated. We expect core CPI to remain below 2% though 2021.
Previous: 0.6% Wells Fargo: 0.3%
Consensus: 0.3% (Month-over-Month)
Monthly Treasury Statement • Friday
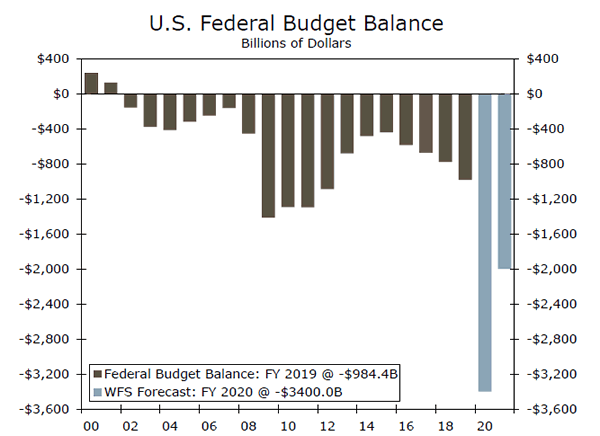
Data released next week will show how big the federal budget deficit was in August, the second to last month of FY 2020. The budget deficit has begun to normalize from the astronomical levels reached during the first few months of the pandemic. Most of the economic support measures in the CARES Act, such as the direct households checks and extra $600 per week in unemployment benefits, have run their course, and the recovering labor market have put tax collections on the road to recovery.
Of course, the economy is still in rough shape, and a return to pre-pandemic budget deficit levels is unlikely anytime soon. The federal budget deficit in FY 2019 was $984 billion, and we look for a FY 2021 budget deficit of $2 trillion. Critically, this forecast assumes the economic recovery continues and no additional stimulus bill is passed. If one does materialize, our budget deficit forecast will likely be headed higher.
Previous: -$63.0B
Global Review
Q2 GDP Data Continues to Underwhelm
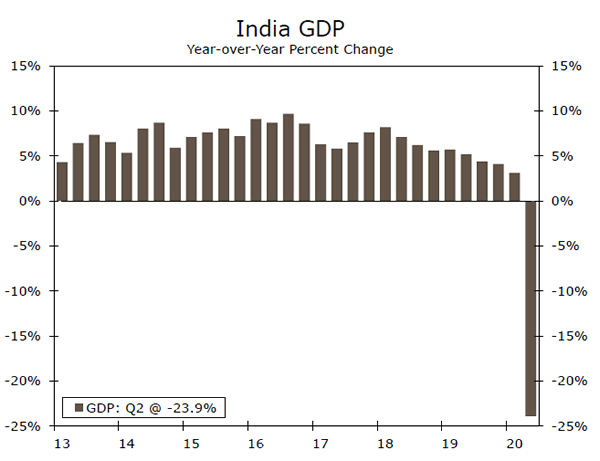
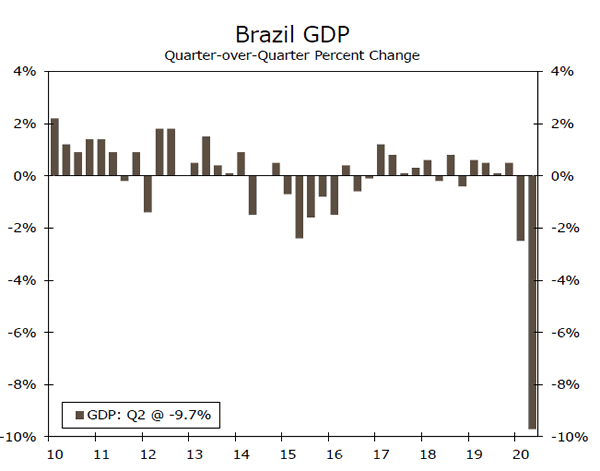
- While expectations for Q2 GDP were dismal, data this week continued to demonstrate how severe the COVID-19 impact has been on economic activity. In India, the economy contracted significantly in Q2, while in Brazil, the economy missed consensus forecasts and experienced the largest decline on record.
Eurozone Inflation Decelerates More Than Expected
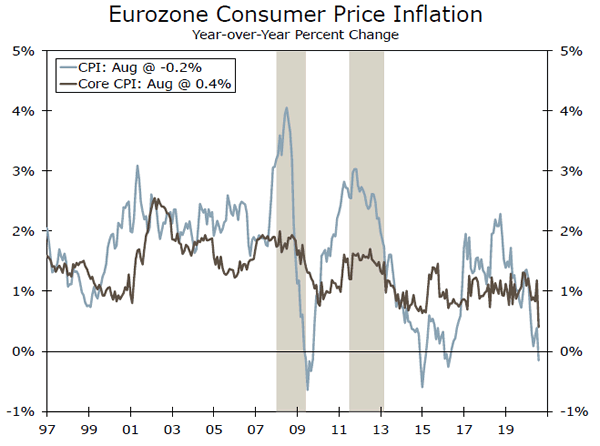
- Inflation in the Eurozone surprised to the downside this week as headline CPI turned negative in August. The decline was surprising given the amount of support policymakers have provided the Eurozone economy.
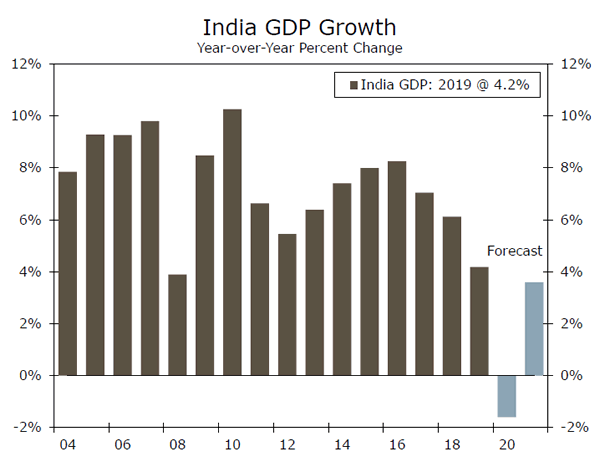
India’s Economy Experiences Sharp Slowdown
The economic deceleration in India has been underway for years now; however, the spread of COVID-19 has certainly exacerbated the slowdown. As the virus spread into India, which is now has the third highest case count, Prime Minister Narendra Modi implemented nationwide lockdown measures. Indian citizens were required to say in their homes and businesses were forced to close in an effort to contain the spread of the virus. Mobility was extremely suppressed, while just about all of India’s economic and sentiment indicators deteriorated significantly. This week, we found out just how much the Modi-lockdown protocol weighed on the economy as Q2 GDP contracted 23.9% on a year-over-year basis. The decline is the largest on record, and while some activity indicators have rebounded, it is unlikely the Indian economy avoids a full-year decline in 2020. As of our most recent forecasts, we expect a notable contraction to India’s economy, with the prospects for 2021 still somewhat muted.
Brazil’s Economy Slumps in Q2
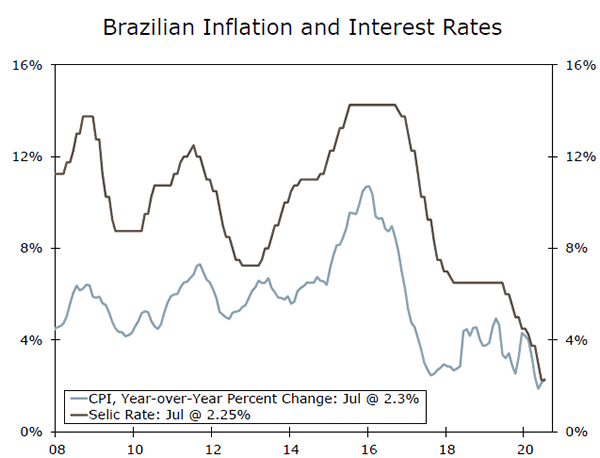
COVID-19 has arguably been most severe in Brazil. With over 3.9M confirmed cases, authorities in Brazil have struggled to contain the transmission of the virus. Densely populated favelas along with less-than-adequate health infrastructure have left Brazil particularly vulnerable to the virus, while state lockdown measures have weighed on an economy that is primarily driven by domestic economic activity. Q2 GDP data released this week showed the slowdown was quite severe and worse than consensus forecasts suggested. Data indicated the Brazilian economy contracted 9.7% quarter-over-quarter and 11.4% year-over-year in Q2. Leading indicators suggest a recovery is underway for the second half; however, we expect the economy to remain somewhat subdued. Markets have been extremely concerned over the trajectory of Brazil’s fiscal balance, which may hit a deficit of 12% of GDP as the administration implements large spending programs to offset the impact of the virus. Any worsening of public finances could weigh on sentiment towards Brazil, which could also complicate the country’s future economic recovery.
Eurozone Inflation Goes Negative
This week, Eurozone inflation data indicated prices across the broader European economy fell on a year-over-year basis. While inflation was expected to decelerate, deflation in the month of August was much of a surprise. As of now, headline CPI in the Eurozone fell -0.2% year-over-year, while core inflation fell more than expected to 0.4% year-over-year, but managed to remain in positive territory. The negative headline is a bit concerning given the amount of monetary and fiscal stimulus the European Central Bank and Eurozone governments have deployed into the economy. The ECB has restarted asset purchases, while a Eurozone shared debt program has been implemented all in an effort to spark consumer demand and activity. In our view, the European Central Bank is likely to look through negative inflation at this time and wait a little bit longer for stimulus to filter down to the real economy. However, if inflation continues to remain in negative territory or at subdued levels for longer than expected, we would expect additional stimulus to be implemented in an effort to push inflation higher.
Global Outlook
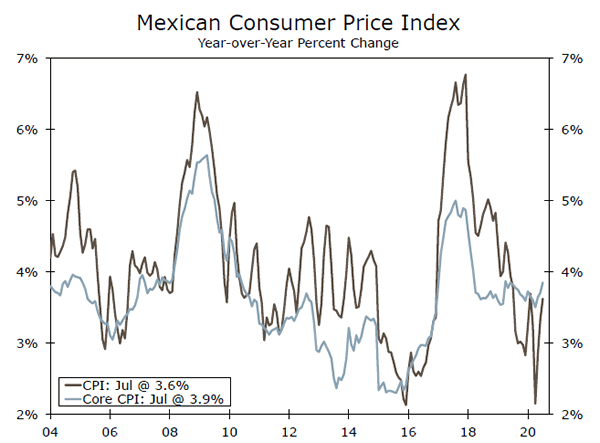
Mexico Inflation • Wednesday
One of the most impacted countries from the COVID-19 pandemic has been Mexico. The economy has been ravaged as a result of lockdown measures and a lack of fiscal stimulus, with the GDP contraction in Q2 the largest on record. While the economy continues to struggle to gather momentum, inflation expectations have been rising over the last few months. In July, headline inflation picked up to 3.62% year-over-year, while Mexico’s measure of bi-weekly inflation pushed up to 3.99%. As of now, the upper bound of the Central Bank of Mexico’s inflation target is 4.0%. Using the bi-weekly inflation number as a signal, it is likely the August inflation reading could approach the higher end of the central bank’s target range. In our view, a sustained move higher in prices would likely prevent the central bank from cutting interest rates further. Right now, markets are still pricing in lower interest rates, and should the central bank keep rate steady, the peso could appreciate.
Previous: 3.62%
Brazil Inflation • Wednesday
The spread of COVID-19 has weighed on Brazil’s economy, an economy that never fully recovered from the collapse of the commodity super-cycle and multiple political crises. As of now, Brazil has the second most confirmed cases with just over 4.0M. The slowdown in the economy has been quite sharp as well, with Q2 GDP declining 9.7% quarter-over-quarter and the Brazilian real the worst performing currency in the world. Inflation has also come down significantly with the main IPCA price measure falling the lowest since 1999. However, over the last two months inflation rose slightly picking up to 2.31% year-over-year in July. It’s likely the Brazilian economy bottomed out in Q2, which could mean a bit more of a sustained rise in inflation going forward. A weaker currency as well as ultra-loose monetary policy from the Brazilian Central Bank should fuel some price pressure as well as aid consumer activity heading into the end of the year.
Previous: 2.31%
Consensus: 2.39%
European Central Bank • Thursday
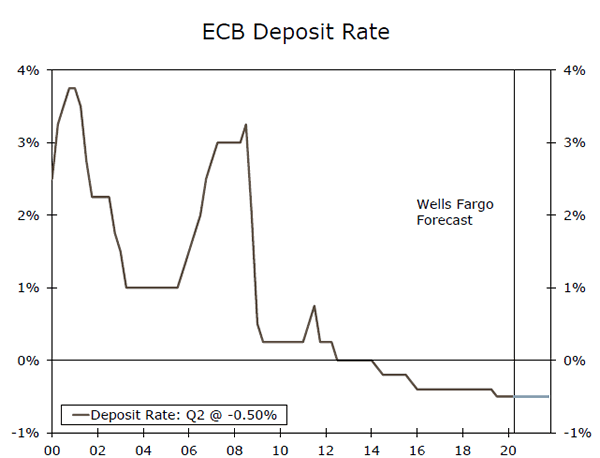
Monetary policy has turned significantly accommodative as central banks around the world try to offset the impact of COVID-19, and the ECB has been no exception. Over the last six months, the European Central Bank has moved forward with additional asset purchases as well as a Eurozone-wide fiscal stimulus packages that will direct funds to the most affected countries. The economy has shown signs of a rebound; however, recently there have been some setbacks. Confirmed cases have started to rise again and this week CPI inflation fell into negative territory. In our view, the decline in CPI is somewhat notable given the amount of fiscal and monetary stimulus that has been pumped into the economy. We doubt the ECB moves forward with any new policy initiatives to combat the drop in inflation at this time; however, should inflation remain negative and price pressure do not build, the ECB may be forced to take action in the near future.
Previous: -0.50% Wells Fargo: -0.50%
Consensus: -0.50% (Deposit Facility)
Point of View
Interest Rate Watch
The Markets Grapple With Unknowns
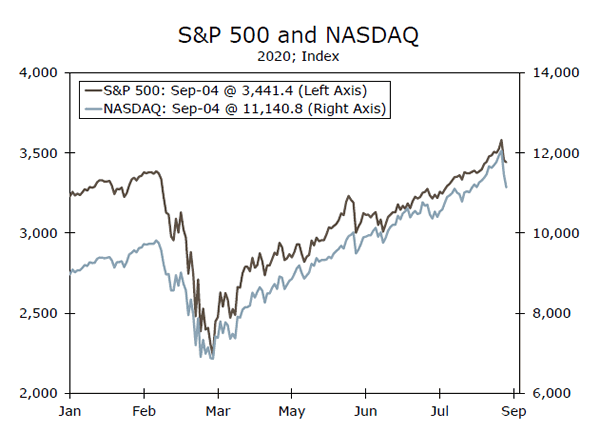
The stock market’s seemingly nonstop run abruptly shifted into reverse on Thursday, as investors suddenly realized the shift to remote work likely has some limits, particularly given the continued progress on developing vaccines and therapeutics to combat COVID-19. The selloff in tech shares only reverses a tiny portion of the run-up in recent months and leaves most equity market indices close to all-time highs.
How much can be made of Thursday’s sudden stock market selloff is difficult to determine. The reversal primarily occurred among firms benefitting from the shift to remote work. The CDC’s note to state governors to prepare to distribute a vaccine by November 1 likely surprised investors expecting a vaccine in mid-2021. The selloff reflects the reintroduction of uncertainty as to how much longer large portions of the workforce will work remotely.
Increased uncertainty nearly always leads to lower share prices and higher bond yields. While there has been some good news on the vaccine front, we doubt the timetable for an effective vaccine has been accelerated. Some healthcare workers and first responders may start receiving a vaccine later this year but widespread vaccinations are still likely a ways off.
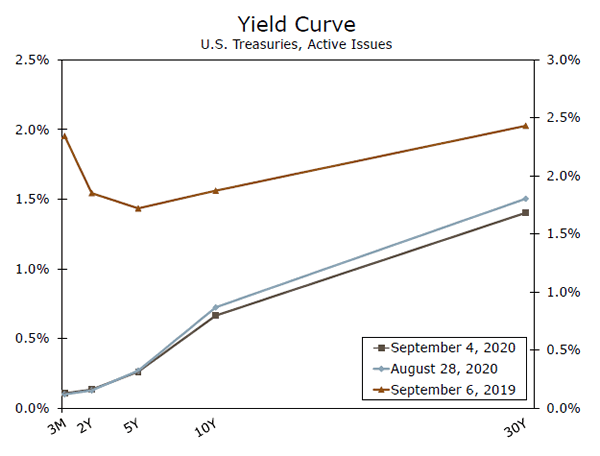
Bond yields fell along with the stock market and rebounded only modestly with this morning’s better than expected employment report. While payrolls rose in line with expectations, the mix was slightly better than expected, with solid gains in manufacturing, construction and the logistics sectors adding to the rebound at retailers, restaurants, administrative positions and doctor’s and dentists’ offices.
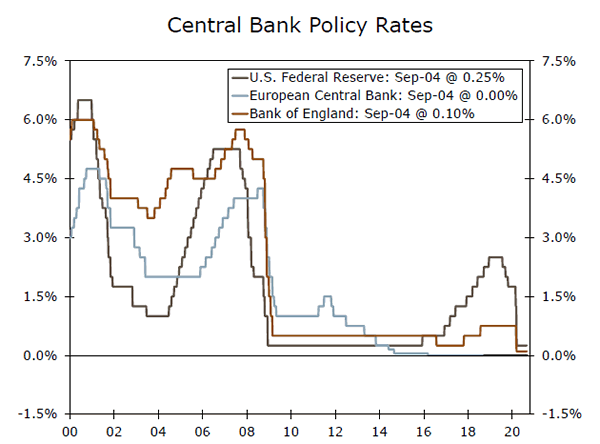
The biggest surprise was the 1.8 percentage point fall in the unemployment rate to 8.4%, as household employment rose 3.76 million and the labor force rose by 968,000. The change in the labor force might reflect individuals that were marginally attached to the job market prior to the pandemic and remained in the labor market until the expanded unemployment benefits expired. The Fed’s timetable remains unchanged and the federal funds rate will remain near zero for the foreseeable future.
Credit Market Insights
South African Debt Update
The South African economy has been hit hard by the COVID-19 crisis with over 630,000 confirmed cases across the country. In an effort to aid the economy, the International Monetary Fund (IMF) granted South Africa $4.3B in emergency funding, the largest emergency support for any country on record. South Africa is already borrowing from several other agencies as well, and is estimated to borrow at least $7B from other lenders. That said, the South African Finance Minister warned that debt levels could exceed 100% of GDP by 2025. Should debt levels rise to that level and interest rates stay where they are, the country could be at risk of entering unsustainable territory.
Even before COVID, South Africa’s economy was struggling. The country’s ongoing corruption scandals and slow reforms could also undermine its ability to recover in the second half of this year. The IMF currently projects the South African economy to contract over 7% for full-year 2020. Given the subdued economic outlook and high debt levels, the country could also be at risk of further credit rating downgrades. South Africa currently has no investment-grade credit rating from any of the major agencies after Moody’s downgraded the country’s rating to “junk”, which sparked a selloff of South African bonds. That said, South African bond yields have bounced around this year, rising to as high as 12.34 in late March, and falling as low as 8.60 in June.
Topic of the Week
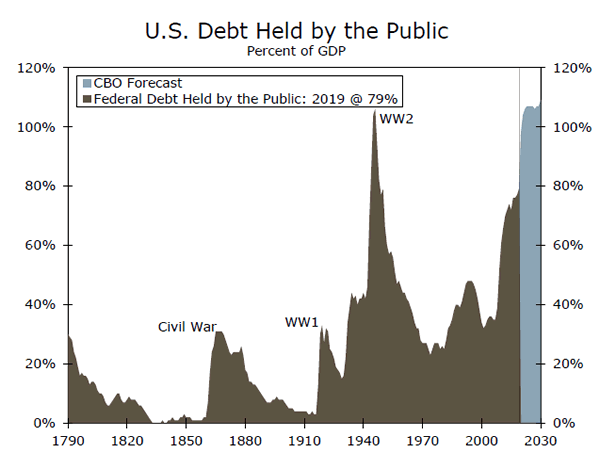
This week, the Congressional Budget Office (CBO) released its Update to the Budget Outlook, outlining its projections for federal debt and deficits over the next decade. The report underscores the tremendous amount of debt the federal government has taken on to finance its response to COVID-19. CBO forecasts a deficit of $3.3 trillion in 2020.* At 16% of GDP, that would be the largest deficit relative to the economy since 1945. For 2021, CBO expects some improvement, but, at 8.6% of GDP, next year’s deficit would be the fourth largest deficit in the post-WWII era (after 2020, 2009 and 2010). Such significant spending would cause federal debt to balloon. By FY2021, federal debt held by the public would eclipse 100% of GDP—a sharp rise from the already elevated 79% at the end of 2019 (top chart). It is also important to note that these projections assume laws governing taxes and spending remain generally unchanged. With more than 29 million Americans still claiming some form of unemployment insurance, more fiscal stimulus could very well be on the way. Legislation thus far has been critical to nation’s public health response and has buoyed income and spending amid the precipitous drop in economic activity. While spending to avoid a deeper economic contraction remains the suggestion of many economists and policymakers, including Federal Reserve Chair Jay Powell, the sheer size of national debt can be dizzying.
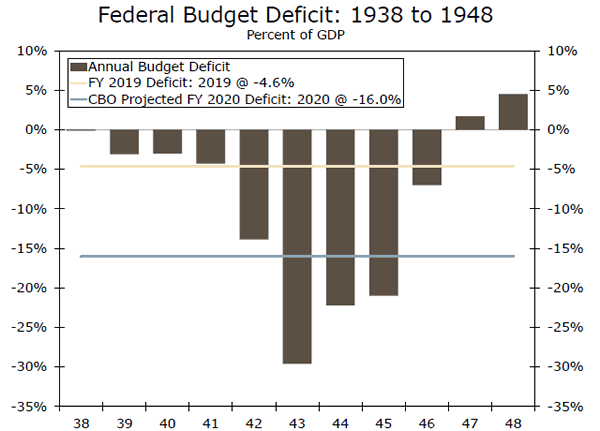
This is not the first time, however, the United States has run such significant deficits. During World War II, the federal government ran budget deficits eclipsing 20% of GDP for three straight years (bottom chart). As we wrote in April, the U.S. government was able to reduce its debt burden in the post-war years through a mix of low real interest rates, strong economic growth and healthy federal revenues. While some of these methods seem realistic in today’s economic environment, others may be more difficult to pursue.
*All years mentioned refer to federal fiscal years.


