
Executive Summary
As discussed in Part I of this series, the fundamental ambiguity of the current virus-driven crisis has brought a host of new challenges for economic modeling. Record volatility and persistent uncertainty complicate analysts’ ability to discern trends in economic data, while the disruption of normal economic activity opens new questions about the reliability of historical relationships. In this report, we explore modeling and estimation techniques that will be important to consider as the economy slowly makes its way out of the COVID-19 crater.
Is Predicting the Shape of a Recovery Enough?
On June 8, 2020, the National Bureau of Economic Research (NBER) announced that economic activity in the United States peaked in February 2020, marking the beginning of a recession. By then, of course, it was clear economic growth had fallen at an unprecedented rate amid the spring lockdowns. But, as activity began to pick-up and lockdowns were lifted, the conversation turned to the shape of the ensuing recovery and how long it would take for the level of activity (i.e. level of real GDP) to reach its pre-virus peak. While some anticipated a rapid, V-shaped recovery, others predicted a slower U-shape or some combination of the two with a quick bounce followed by a more gradual recovery thereafter. Now, several months later, questions remain regarding the recovery’s shape as many highlight the potential for a W-shaped recovery, or a double-dip recession.
While the economy’s nadir seems to be clearly in the rearview mirror, the path forward remains remarkably uncertain. The return to ‘normalcy’ largely depends on the path of the virus, but one tool we will employ is our Ordered Probit model to predict the strength of recovery. We created our Ordered Probit model in 2016, which simultaneously predicts the probability of recession and the strength of the recovery (Figure 1).1 In a simulated experiment the model has predicted the strength of all recessions and recoveries since 1980 and may be particularly useful now given the uncertainty surrounding the young expansion.
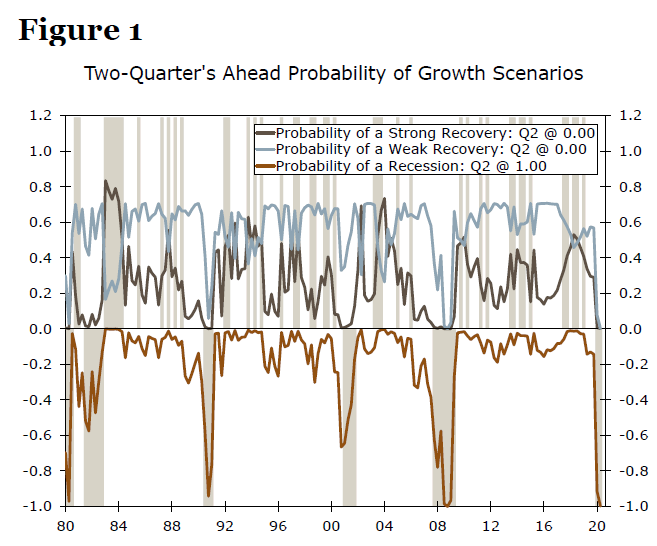
We currently forecast economic growth to continue through 2022, but not all recoveries are of equal strength. As we have seen after the past few downturns, it can take quite a long time for the economy to get back to full health even after the recession has ended. Adding this dimension to traditional recession models can help inform not only if the economy will be growing, but how fast.
Predicting the shape of a recovery can also help inform expectations for the path of economic policies (i.e. monetary and fiscal policy). Historically, policy is ‘normalized’ in an expansion phase of a business cycle. For example, the Federal Open Market Committee (FOMC) typically tends to normalize policy by raising the federal funds target range during the expansion. However, the last two recoveries, following the 2001 and 2007-09 recessions, paint a different picture. After the 2001 recession, the FOMC did not raise the federal funds rate (FFR) until June 2004 (31 months after the trough of the recession), and the first rate hike in the post-Great Financial Crisis (GFC) era did not come until December 2015 (77 months after the trough).
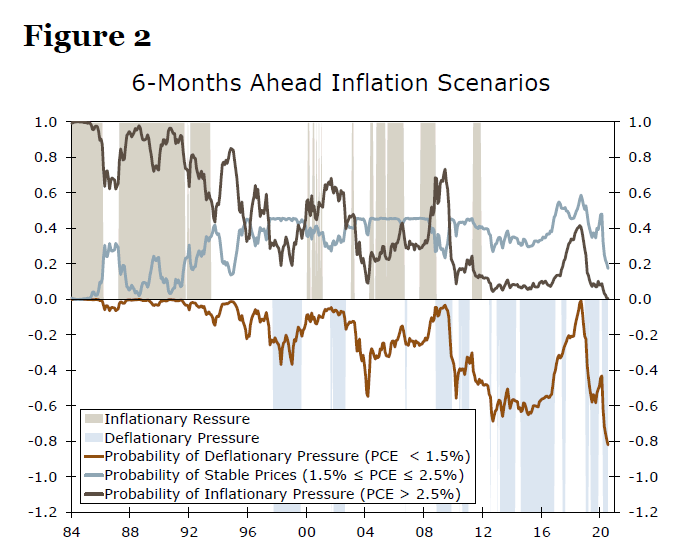
In order to understand this slow return to normal, it is helpful to consider the underlying sectors that drive policymakers. The Fed is tasked with promoting maximum employment and price stability. If activity begins to recover, but employment growth remains lackluster or inflation remains below target, the central bank may be slower to remove accommodation. Therefore, it is not just predicting the path of the recovery in the overall U.S. economy, but in individual sectors that will be important in the post-COVID era. This is why we will also utilize an additional Ordered Probit model we previously built to help illustrate the inflation side of the Fed’s mandate. The model predicts the probabilities of inflationary pressure, deflationary pressure and price stability simultaneously (Figure 2).2 Notably, the model picked-up on deflationary pressure at the onset of the current crisis, and we will utilize this model to gauge the coming inflationary environment as the economy begins to recover. Given the Fed’s insistence on higher inflation before any accommodation is removed, it will be important to observe possible inflation scenarios as well as the strength of the recovery in order to anticipate the path of monetary policy.
Estimating the Depth of Shocks
Before we can estimate the pace of recovery, however, it is important to assess the depth of the downturn. That is, in order to adjust economic models coming out of a downturn we to estimate the depth of the shock from which the economy is digging out. This is also true for policymakers, who need to understand the depth of the crisis and its causes in order to properly calibrate stimulus. However, calculating the true damage from a shock is not always an easy task. Many traditional models were unable to reproduce the actual depth of the GFC by shocking just home prices, for example. We previously provided a different approach to estimate damages from the GFC, by incorporating the indirect effects of changing animal spirits, something we will continue to monitor.3
In many traditional models, how an event propagates through the economy depends on how much people adjust their spending based on a shock to their income, known as an individual’s marginal propensity to consume (MPC). For example, if the government sends people $1,200 (a positive shock) as part of economic stimulus, people may only spend 75% of it. Understanding this MPC is important, because it allows an analyst to estimate the total effect of an event on the economy. The 75% that people spend becomes income for other people, who will spend some portion of it, and so on.
While one can estimate the MPC by looking at the average effect of a shock over time, animal spirits, or economic sentiment, can shift the MPC, as people respond differently to the idiosyncrasies of each shock. If people are uncertain about the outlook they may choose to save more to weather the potential economic tumult. In the lead up to the GFC, for example, home prices fell dramatically, presenting a negative shock to households’ financials. While one might expect individuals to adjust spending based on some past average of prior home price shocks, animal spirits exaggerated this effect as sentiment cratered in the face of the financial crisis.
In the wake of COVID-19, we have seen this dynamic re-appear. While individuals have curtailed spending due to an inability to spend on many services animal spirits are also a factor. Thus as analysts estimate the depth of the COVID shock, we suggest that they should include a measure of animal spirits as an element in models to produce accurate results.
Verifying Existing Benchmarks
When turning attention to the recovery, analysts should also verify pre-existing benchmarks. There are some famous benchmarks analysts utilize to forecast certain economic events, and prior to using them in the post-COVID era it is important to verify their predictive power. There was evidence of some of these benchmarks breaking down after the GFC, and we are likely to face similar difficulties in the post-COVID era. For example, the inverted yield curve, or the spread between the 10-year Treasury yield and the FFR, is a famous recession predictor, as it has led all recessions since 1969-70 recession (Figure 3). However, the 2008-09 recession may have changed its effectiveness as a leading indicator.
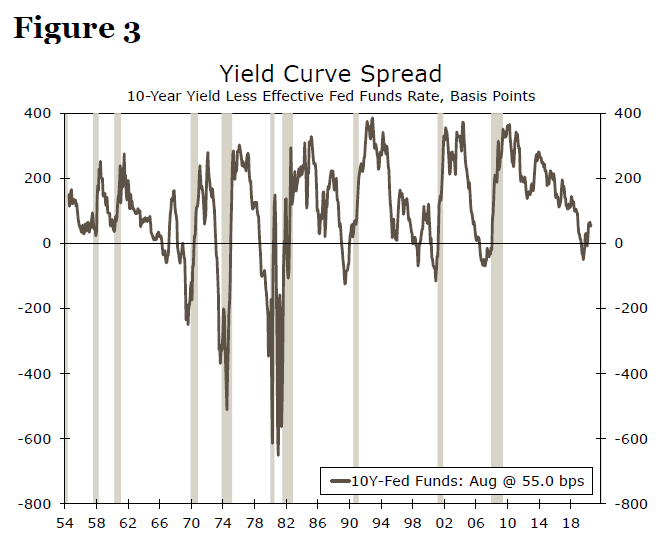
The FOMC brought the federal funds target range to the zero lower bound in December 2008 and kept it there until December 2015. This low level of the FFR corresponded with a broader downshift in the level and volatility of interest rates. These trends have led many to question the predictive power of the yield curve and we shared in this concern. To address this shift, we presented a new framework utilizing a threshold between the FFR and the 10-year Treasury yield, rather than simply an inverted yield curve.4 We found that in a rising FFR period, the FFR crossing/touching the lowest level of the 10-year yield in that cycle is indicative of an impending recession (Figure 4). Since 1954, in a simulated experiment, this framework not only predicted all recessions but also predicted changes in monetary policy stance (i.e. from accommodative to normalization).
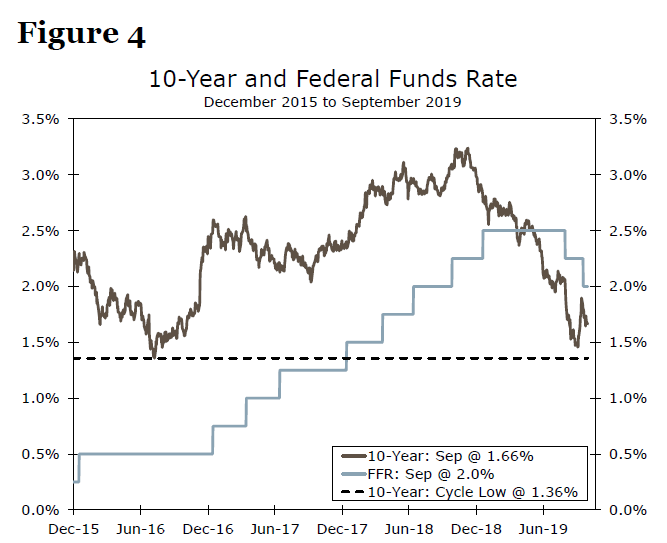
In the post-COVID era, the dynamics that motivated this new framework are likely to not only continue but intensify. The FOMC brought the federal funds target range to the zero lower bound in March 2020 and the 10-year Treasury yield dropped below 1% on March 3 for the first time ever. Furthermore, the Fed’s balance sheet eclipsed $7 trillion in June, and the latest projections from the FOMC showed intentions to keep interest rates lower for a longer period of time.5 That being said, at present, both the 10-year yield and the FFR are expected to stay very low compared to the historical averages. Moreover, both of these interest rates are components of the yield curve as well as our previously proposed method. Given current levels and future expectations (lower rates for longer) of these rates, we suggest analysts should re-evaluate the effectiveness of the inverted yield curve and our approach before employing those tools in the post-COVID era.
Dangers of Volatility
Volatility may pose another challenge to analysts, as there has been extensive volatility in most macroeconomic indicators due to COVID-19. We discussed the implications of volatility on the seasonal adjustment process of data in Part I of this series, but extensive volatility can also make it difficult to rely on traditional economic models when estimating the recovery. Standard econometric techniques, like Ordinary Least Squares (OLS), are known to produce misleading results (spurious regression) when dealing with volatile data. However, there are econometric tools that handle volatility. The commonly utilized tool to handle an underlying variables’ volatility is known as autoregressive conditional heteroscedasticity (ARCH), or its generalized form, GARCH.
Traditional macroeconomic variables are stable, at least compared to financial data like stock prices or exchange rates, therefore applications of the ARCH/GARCH approach in macroeconomics are not common. One major reason is that economists are typically interested in the average relationship (objective mean) between variables, and financial analysts are concerned with uncertainty (variance) related to underlying asset prices. However, the GFC led economists to become more concerned with underlying volatility.
Prior research has suggested that outliers and high-variance episodes such as the GFC can affect the OLS results and lead to spurious results.6 By incorporating the ARCH approach in traditional econometric methods, one can obtain more accurate results even when the underlying data are volatile. This new approach is called ARCH-macroeconomics. We strongly suggest utilizing the ARCH-macroeconomic approach for modeling in the post-COVID era to generate accurate results when dealing with volatility. Due to its technical nature, for a detailed example of ARCH-macroeconomics, we direct interested readers to the appendix of this report on page 6.
Threats of Motionless Variables
Volatile data are not the only concern in the post-COVID environment. Standard econometric tools can generally handle stable data (slowly moving upward or downward with a reasonable variation) and produce reliable results. Volatility can be an issue, but as we just discussed statistical tools such as ARCH can handle volatility appropriately. However, very calm (motionless) data are less common and can cause serious problems during estimation. This problem becomes even more serious when we are dealing with a vital factor, like interest rates, that play a central role in a number of financial and economic models.
Between December 2008 and July 2020 (140 monthly data points), the target FFR had only moved 13 times. This “motionlessness” occurred despite material movements in the broader economy. For the next couple of years, this dynamic is likely to continue, as we assign a low probability that the FOMC will adjust its target range for the FFR over the medium term. Analysts may therefore have to manage two different behaviors in the post-COVID era; very calm interest rates alongside extreme volatility in other sectors of the economy. So how would an analyst model these two sets of variables with completely different behaviors?
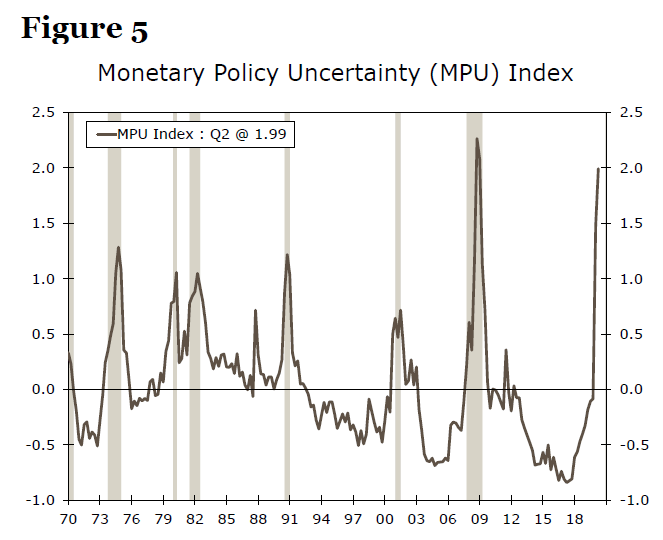
Unfortunately, the answer is not straightforward. In order to obtain reliable results, analysts need to translate volatile data into a calm series, or a calm series into a volatile data set. Since we lack tools to deal with calm (motionless) data, the latter option is more realistic. Further, with volatility present in so many sectors of the economy today, it is better to convert calm data, like interest rates, to follow the rest of the economy. Now, the practical question is how to translate the FFR into a volatile series. In our past work we introduced a monetary policy uncertainty index (MPU).7 The MPU hit 1.99 in Q2-2020, the highest value since Q1-2009 (Figure 5). The index’s volatile behavior during the first half of 2020 is consistent with the rest of the economy and the extraordinary actions undertaken by the FOMC beyond just adjustments to the FFR. The MPU index can therefore be used as a proxy for monetary policy in forecasting to obtain more reliable results than mitigating for problems resulting from differences in volatility.
Conclusion
Analysts need to consider sector-specific rebounds in addition to the overall economy when predicting the strength of the post-COVID recovery. The ARCH-macro approach would be a handy tool when dealing with virus-related volatility in modeling and forecasting. Volatile data are not the only concern for economic modeling, however, as ‘motionless’ data are also a threat and should not be ignored. An index-based proxy for these motionless series can help mitigate this problem. Estimation of the true COVID-related damages is vital for appropriate policy action and we suggest that analysts incorporate animal spirits in the estimation process.
Finally, most of the modeling examples used throughout this report were inspired by the 2008-09 recession. To address the challenges that traditional models were unable to handle in the post-GFC era, new ways to forecast and model were developed. While we believe some of these solutions will also help in the post-COVID era, some of the currently unforeseen challenges we are likely to inevitably face will cause new modeling techniques to be developed.
APPENDIX
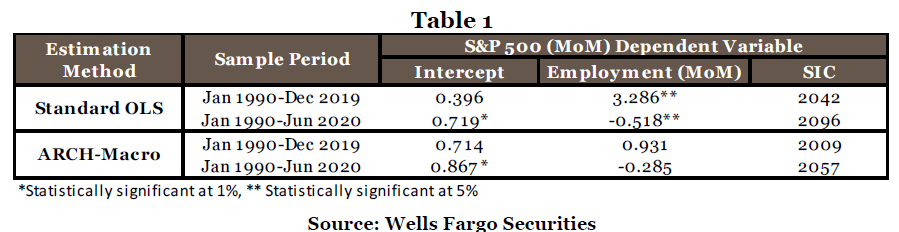
Using a standard OLS approach, we run a regression between the month-over-month percent change in the S&P 500 index and nonfarm payrolls for employment and reported the results in Table 1. We utilize two different sample periods (1) Pre-COVID era (1990-2019) and (2) the COVID period (1990-June 2020). The OLS results for the pre-COVID era suggest employment is statistically useful to explain S&P growth. The positive result (3.286) suggests higher employment would boost the S&P, which seems intuitive. However, when we extend the estimation to include the COVID era, the employment coefficient is still statistically significant but negative (-0.518), which is meaningless as it implies employment growth has a negative effect on S&P growth. We believe this change in the estimated relationship is a sign of the underlying volatility in both variables leading to a spurious correlation.8
We also employ ARCH-macroeconomic (label ARCH-macro in Table 1) on both samples and the results indicate there is no statistically significant relationship between the growth rates of the S&P and employment. The ARCH-based results are also consistent with the efficient market hypothesis which states assets prices are unpredictable. Furthermore, since the pre-COVID sample includes the GFC-era, the OLS results are misleading due to the volatility of that time period.
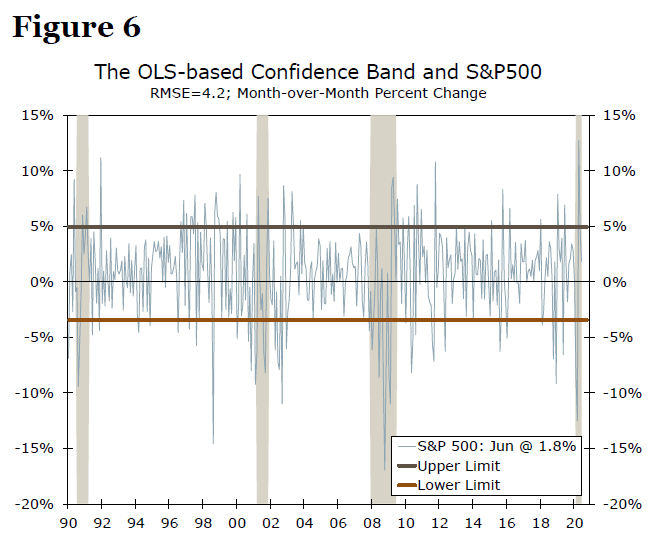
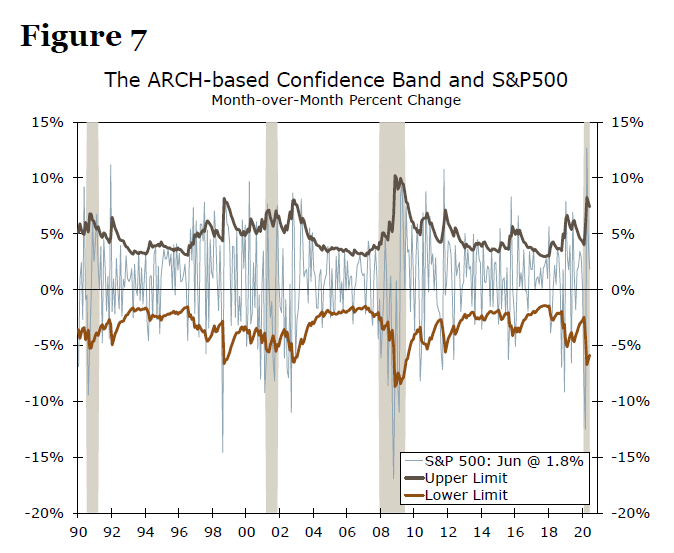
Volatility has consequences for forecasting, often resulting in misleading confidence bands when using OLS. The estimated RMSE (a measure of the error) of the OLS model using the COVID-era sample is 4.2. Moreover, we plot the S&P growth rates along with the confidence band using the RMSE in Figure 6. The ARCH based estimates are shown in Figure 7. There is an important difference between the two approaches. The OLS estimated RMSE is a constant, 4.2 (only one value for the whole sample) and that suggests risks to the forecast are the same for each time period. In other words, the risk to the forecast is identical for the GFC period (a highly volatile period) and 2014 (the first relatively calm year in the post-GFC era). The ARCH-based confidence band is different for different periods, which reflects the time-varying nature of risk, a realistic reflection of the underlying risk and uncertainty to the forecast. The highest values are for the GFC era in the estimated variance based on the ARCH-macro approach, which indicates the uncertainty created by the GFC. Therefore, we strongly suggest utilizing the ARCH-macroeconomic approach for modeling in the post-COVID era to generate accurate results.
1 For more detail on the methodology, see “Predicting the Probability of Recession and Strength of Recovery: An Ordered Probit Approach” (July 19, 2016).
2 Iqbal & Silvia (2016). “Does Deflation Threaten the Global Economy?“, Global Economy Journal, 16(2), 189-212.
3 For more detail, see “The Roar of the Animal Sprits: A New Index” (January 18, 2018).
4 For more detail, see “Do We Need to Wait for a Yield Curve Inversion to Predict a Recession? No.” (September 08, 2017).
5 The FOMC’s Dot Plot in its latest September Summary of Economic Projections shows most committee members expect the federal funds target range to stay at the zero lower bound until the end of 2023.
6 Hamilton, J. (July 2008). “Macroeconomics and ARCH.” National Bureau of Economic Research.
7 For more detail, see “Quantifying Monetary Policy Uncertainty: A New Index,” (May 16, 2019).
8 There are some tests/rules, such as the ARCH effect and R-squared relative to the Durbin-Watson dstatistic, to determine the underlying volatility as well as spurious results. For more details about those tests and rules, please see Silvia et al. (2014). Economic and Business Forecasting: Analyzing and Interpreting Econometric Results.


