WTI fell to a monthly low on Tuesday reaching as low as $57.50 per barrel and stabilized nearby that level. Analysts believe the move lower comes after new lockdown measures were announced in Europe but also the fact that the block’s vaccination process remains slow and could impact future demand for Oil. In our view, this is a selloff that has started in the previous weeks, when Oil traded at multiyear high levels. This is the third consecutive week that WTI moves lower. From a fundamental perspective the UAE energy minister said on Tuesday that OPEC+ is unlikely to pump more oil than the market can handle. The recent significant buildup in stockpiles in the previous and current week, seem to have had a negative impact on Oil prices especially as demand is still kept constrained.
WTI fell approximately $3.50 on Tuesday and tested our current (S1) 57.50 support level but was unable to breach it. If the selling continues in today’s session then the next level lower could be the (S2) 56.10 support barrier and even lower the (S3) 54.65 hurdle. Please note the (S2) and the (S3) were last seen in February and are not part of the recent price action. In the opposite direction and in case an upward movement prevails, we could see WTI making a turn towards the (R1) 58.30 resistance level. Above that we have noted the (R2) 60.00 round number threshold which could become a target for the bulls if the sentiment changes. At the top, we have noted the (R3) 61.70 hurdle that could become a target in a continuous upward momentum. Overall WTI remains in a down trend since the beginning of March. Traders should note the EIA crude oil stockpiles figure to be released today in the European afternoon, as the reading could create volatility for the commodity.
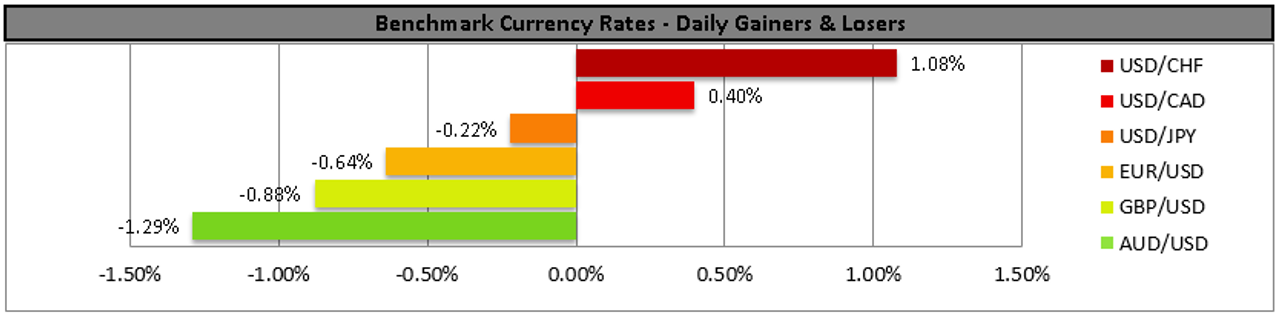
USD moves higher with PMI day ahead
The USD was the strongest among the major currencies on Tuesday and on Wednesday early European morning and dominated the scene against all except the JPY. On Tuesday, during Fed Chair Jerome Powell’s testimony, he noted that they expected inflation to be on the rise during the year ahead. On the other hand Janet Yellen noted that Tax changes will help to pay for economic programs. AUD/USD moved to new monthly low levels even as Australia’s Manufacturing PMI figure for March has improved. EUR/USD weakened but has a very interesting day ahead with the PMI data for France, Germany, Eurozone and the Eurozone’s Consumer Confidence for March. Traders will also be focusing on CNB’s interest rate decision as the performance of the Czech economy during the pandemic has been impressive which raises expectations for the central bank to raise rates faster than anyone else in Europe.
The USD Index rose towards the (R1) 92.55 resistance level with the latest upward momentum but did not test it clearly. Even though the (R1) remains a challenge for the bulls, a move even higher could send the index towards the (R2) 93.05 barrier. Even higher we note the (R3) 93.70 hurdle. Please note both our (R2) and (R3) levels were last seen back in November 2020. However, if the index is to correct downwards, then the (S1) 91.30 support level could be revisited. The (S1), is a level that has been tested constantly in March but has not been breached to the downside, proving its solidity. Lower we have noted the (S2) 90.60 barrier and even lower the (S3) 89.90 line. In our opinion the index is currently in and upward momentum and the strength of the USD has been felt across the board in the past days.
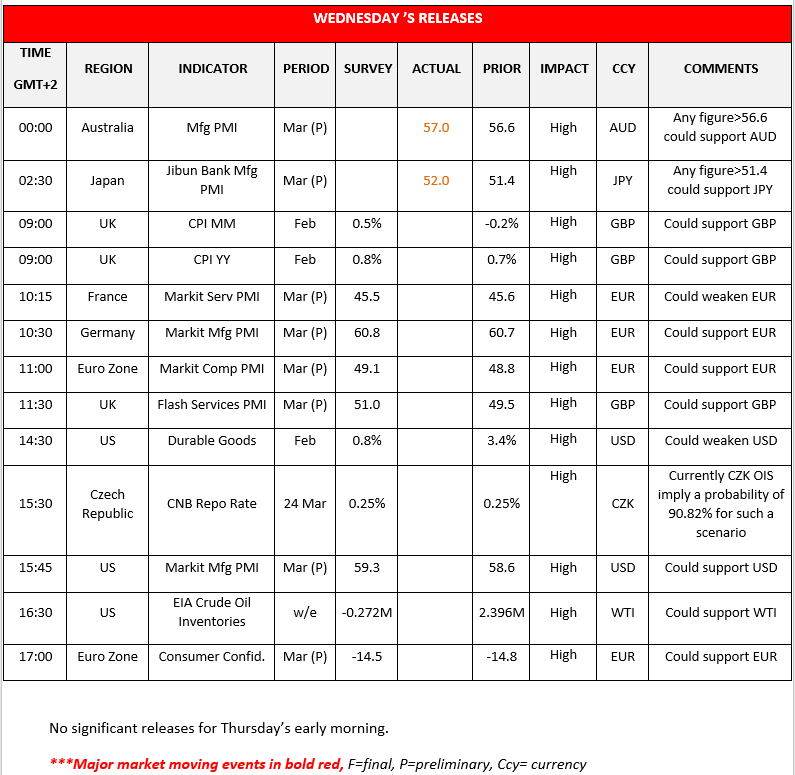
Other economic highlights today and early Tuesday:
In the European session we get the Preliminary PMI data for France, Germany, Eurozone and the UK. We also get the Eurozone’s Preliminary Consumer Confidence for March, the UK Inflation data for February and CNB’s Interest rate decision for March. In the US session we get the Preliminary PMI data for March and the US Durable Goods for February. In the US session we also get the EIA Weekly Crude Oil stocks figure and Federal Reserve Chair Jerome Powell gives virtual testimony on coronavirus aid, relief, and the Economic Security Act before Senate Banking Committee
WTI 4H Chart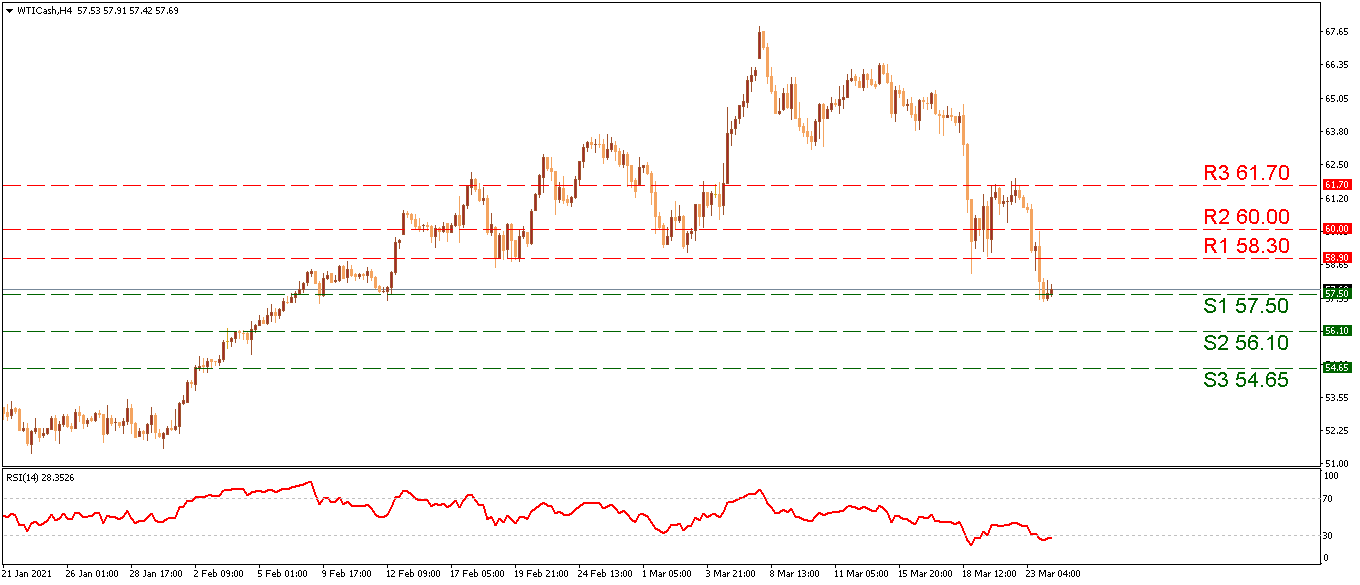
Support: 57.60 (S1), 56.10 (S2), 54.65 (S3)
Resistance: 58.30 (R1), 60.00 (R2), 61.70 (R3)
USD Index Daily Chart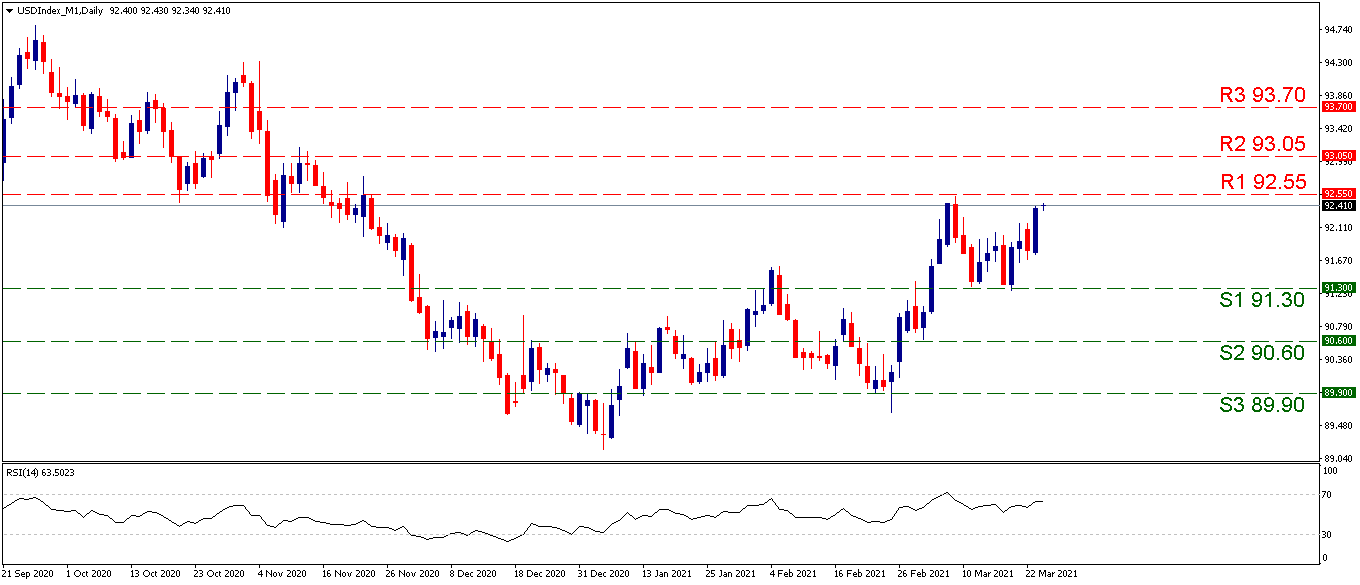
Support: 91.30 (S1), 90.60 (S2), 89.90 (S3)
Resistance: 92.55 (R1), 93.05 (R2), 93.70 (R3)