The Canadian dollar spiked against the US dollar after the Bank of Canada (BOC) decision. As expected, the bank left interest rates unchanged at 0.25%. It also decided to slash its weekly quantitative easing purchases from C$4 billion to C$3 billion. This was in line with what some analysts such as those from ING and Credit Suisse were expecting. The bank revised the growth estimate for this year to 6.5% even as it insisted that it won’t raise interest rates until inflation rises to 2%. Other major central banks like the Federal Reserve and Reserve Bank of Australia (RBA) will continue with their purchases in the foreseeable future.
The euro held steady ahead of the important interest rate decision by the European Central Bank (ECB). Like the BOC, the ECB is expected to leave the interest rate unchanged in this meeting. However, it will continue to boost asset purchases since the European economy seems to be recovering slower than expected. The unemployment rate in the region is more than 8% while inflation is slightly below the 2% target. Still, the bank is expected to reduce asset purchases in July. It will then give a three-month notice about ending QE in the fourth quarter of this year.
US stocks rallied yesterday as fears over rising coronavirus cases globally started to wane. It was the first day that the stocks rose this week. The Dow Jones, Nasdaq 100, and the S&P 500 index rose more than 1% each. This trend will likely continue later today as the market focuses on the upcoming earnings. Some of the top companies that will publish their results are Nestle, Intel, AT&T, Danaher, Snap, and Blackstone Group, among others. Intel will be watched closely because of the ongoing chip shortage and the rising competition in the industry.
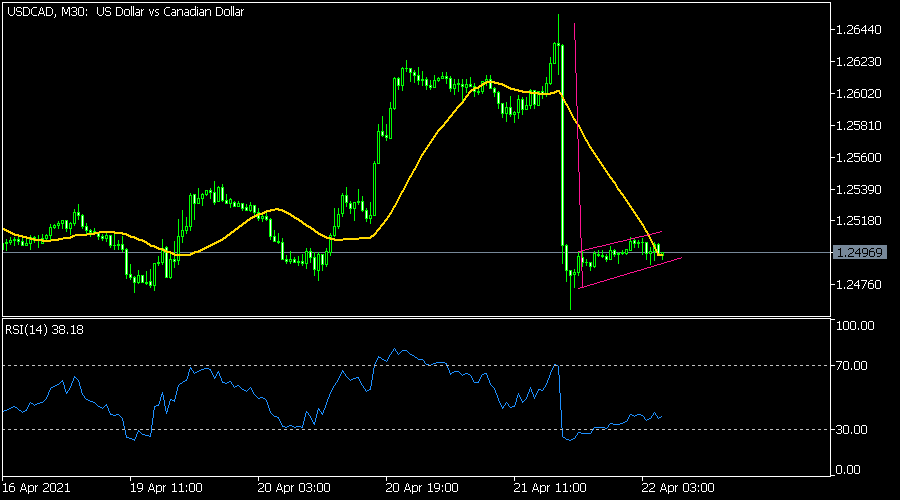
USD/CAD
The USD/CAD pair declined sharply yesterday after the BOC interest rate decision. It fell from the intraday high of 1.2655 to a low of 1.2460. On the 30-minute chart, the pair has formed a bearish flag pattern that is shown in pink. This pattern is typically a bearish sign. It is also substantially below all moving averages while the signal line of the MACD has made a bullish crossover. While the pair may attempt to rebound today, another bearish breakout cannot be ruled out.
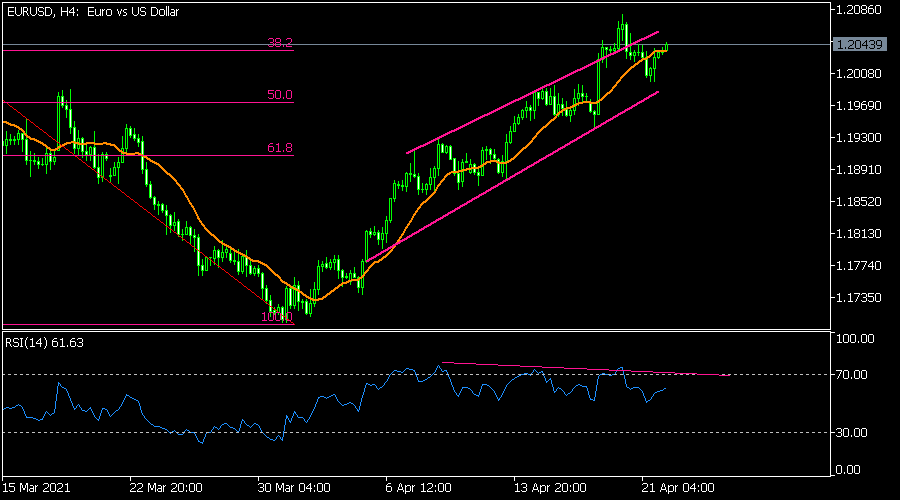
EUR/USD
The EUR/USD pair rose slightly ahead of the ECB interest rate decision. On the four-hour chart, the pair is slightly below the upper line of the ascending channel. It is also slightly above the 38.2% Fibonacci retracement level while the Relative Strength Index (RSI) has made a bearish divergence pattern. The price is also slightly above the 25-day moving average. The pair is likely to keep rising ahead of the ECB decision.
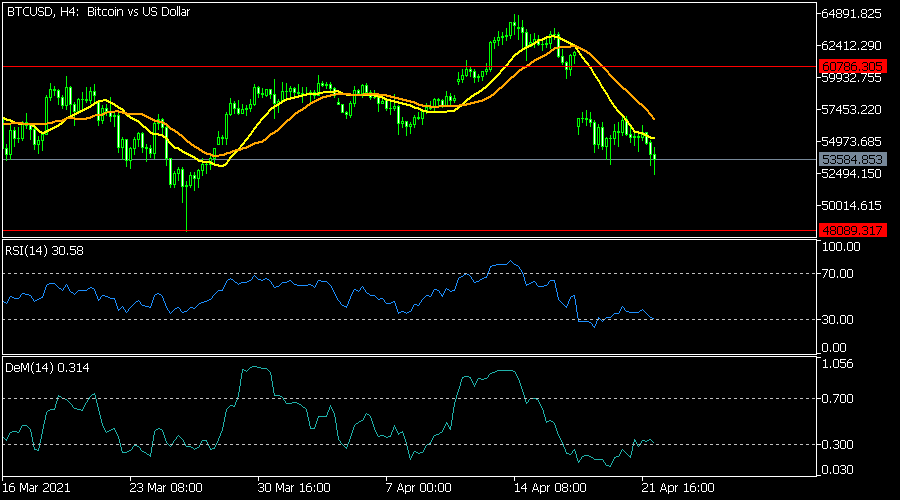
BTC/USD
The BTC/USD pair declined to $52,380, which is substantially below its highest point last week. On the four-hour chart, the pair has moved below the 25-day and 15-day moving average while most oscillators like the DeMarker and the Relative Strength Index (RSI) have moved below the oversold level. The pair will likely continue falling as bears target the next key support level at 50,000.