
Summary
United States: Supply Chain Woes Tug at Growth and Send Prices Higher
- This week’s light calendar of economic reports showed supply chain disruptions tugging a little at economic growth. New home sales are being held back by record low inventories, as higher construction costs are slowing starts. While a slightly larger drop in consumer confidence and advance durable goods orders garnered headlines, hiring continues to ramp up and business fixed investment advanced solidly, reflecting the urgency of the supply side to catch up with demand.
- Next week: ISM Manufacturing (Tuesday), ISM Services (Thursday), Employment (Friday)
International: Less Positive on the U.S. Dollar Outlook
- It was an especially light week on the international economic data front. On Tuesday, however, we released our monthly International Economic Outlook for May. Perhaps the biggest change in our forecast was a somewhat less positive view on the U.S. dollar going forward.
- Next week: India Q1 GDP (Monday), Canada Q1 GDP (Tuesday), May Eurozone CPI (Tuesday)
Interest Rate Watch: Eye-Popping Inflation Not Widespread, but Driving Inflation Expectations Up
- Alternative measures of inflation suggest that the April’s leap in inflation is not as widespread as traditional “core” measures indicate. That may boost the Fed’s confidence that the recent strength in inflation is driven by the unique circumstances of restarting activity after a pandemic. However, the hard-to-miss price hikes are lifting inflation expectations, which could lead to inflation becoming more entrenched.
Topic of the Week: The Party’s Just Getting Started for Services
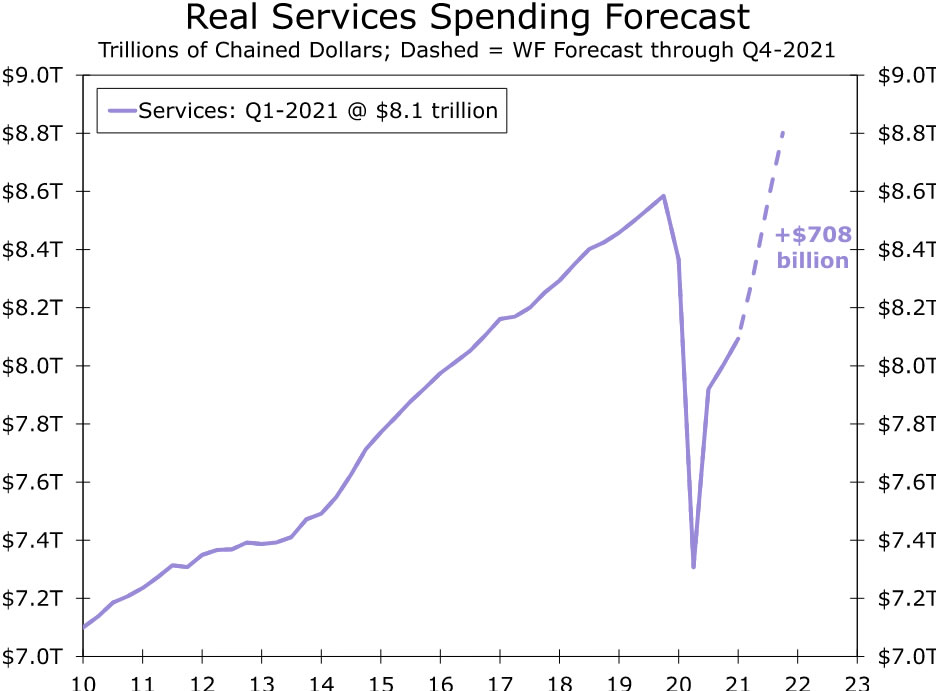
- Over the past year, we have watched as piled-up excess savings have left consumers flush with cash, and finally, we are on the verge of what we have all been waiting for: the services spending boom. Still 4.7% below its February 2020 level, real services spending fell back during the pandemic, but we expect more than four and a half years of typical spending to occur in the next three quarters.
 U.S. ReviewSupply Is Racing to Catch Up with Demand
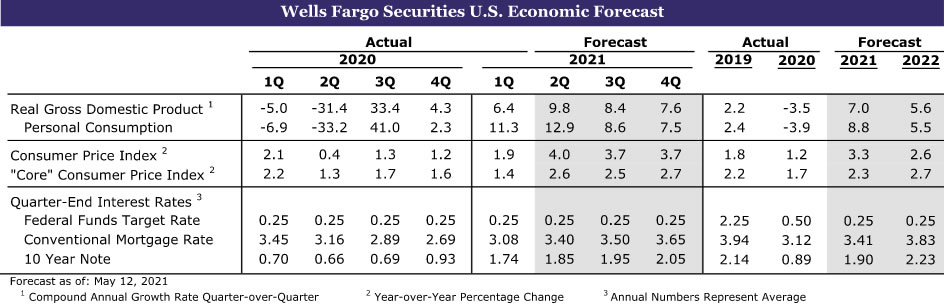
While first quarter real GDP growth was unrevised at 6.4%, revisions to the underlying components show a widening gap between the resurgence in the demand for goods and services and the supply. Consumer spending rose at an even faster 11.3% annual rate during the first quarter, with the revision showing stronger purchases of big-ticket items such as cars, light trucks and household appliances. Business fixed investment and residential investment were also revised modestly higher, while there was a larger draw down in inventories than first reported and exports were revised lower.
The strength in demand is pulling prices higher. The GDP Price Index rose at a 4.3% pace during the first quarter, and, after excluding food and energy items, core prices rose at a 3.4% annual rate. Both are 0.2 percentage points higher than initially reported. The stronger inflation readings confirm what we have been seeing in much of the survey data, including the NFIB, ISM and Philadelphia Fed surveys, as well as the recent CPI and PPI data. The acceleration in inflation is extending into the current quarter. This morning’s personal income and consumption data showed overall prices rising 0.6% in April and rising 0.7% after excluding food and energy prices. The PCE deflator has risen 3.6% over the past year and core PCE deflator is up 3.1%; both were slightly higher than expected.
Personal income plummeted 13.1% in April, following a 20.9% surge the prior month, which was driven by the distribution of COVID relief checks. Personal income less transfer payments rose a solid 1% in April, and wages and salaries rose a solid 1%, matching the prior month’s gain. The 0.6% rise in inflation overwhelmed the 0.5% rise in nominal personal consumption, resulting in a 0.1% drop in real outlays. All the drop was in goods outlays and part of the decline is likely tied to supply shortages of cars and light trucks, appliances and other goods. We expect spending to rebound from April’s slight drop over the balance of the quarter, when employment and wages and salaries are expected to rise solidly. The saving rate fell back to 14.9% in April, after surging to 27.7% in March. Prior to the pandemic, the saving rate was 8.3%.
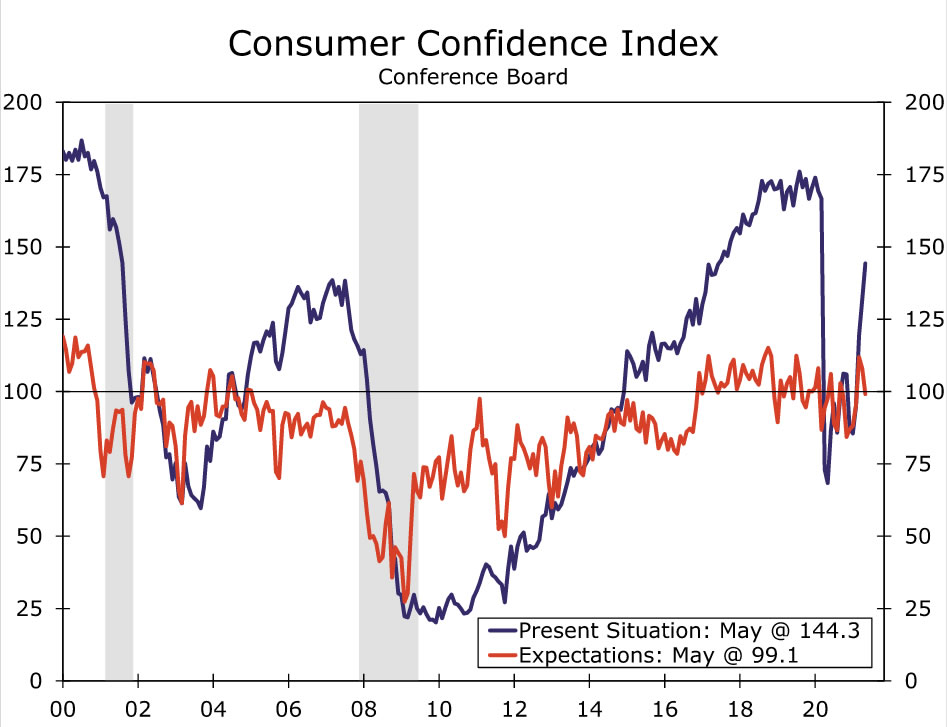
Consumer confidence came in slightly below expectations in April, with the overall index falling 0.3 points to 117.2. The prior month’s data was also revised 4.2 points lower, which made April’s drop appear even larger. The underlying data were mixed. Consumers’ assessment of current economic conditions jumped to 144.3, which is its highest reading since March 2020. Consumers’ expectations for future economic conditions declined 8.8 points to 99.1. The widening gap between consumers’ view on current economic conditions and future conditions is notable, because it is typically associated with the latter stages of the business cycle. The slide in expectations might reflect concerns about rising prices and possible tax increases. It also could simply be noise or some combination of the three.
Purchasing plans also fell sharply in May, with the share of consumers planning to purchase a home over the next six months falling 2.8 percentage points to 4.3%, which is its lowest level since February 2013. The share planning to purchase automobiles fell 2.0 points to 9.1%, while the share planning to purchase major appliances plummeted 9.4 points to 41.9, hitting its lowest level in a decade. Purchasing plans are volatile on a monthly basis. The most recent declines coincide with widespread shortages of homes, motor vehicles and appliances and sharply rising prices. Again, this may simply be noise, or it may be a warning that the stimulus-driven surge in spending and home buying has gotten too far ahead of supply, triggering a spike in prices.
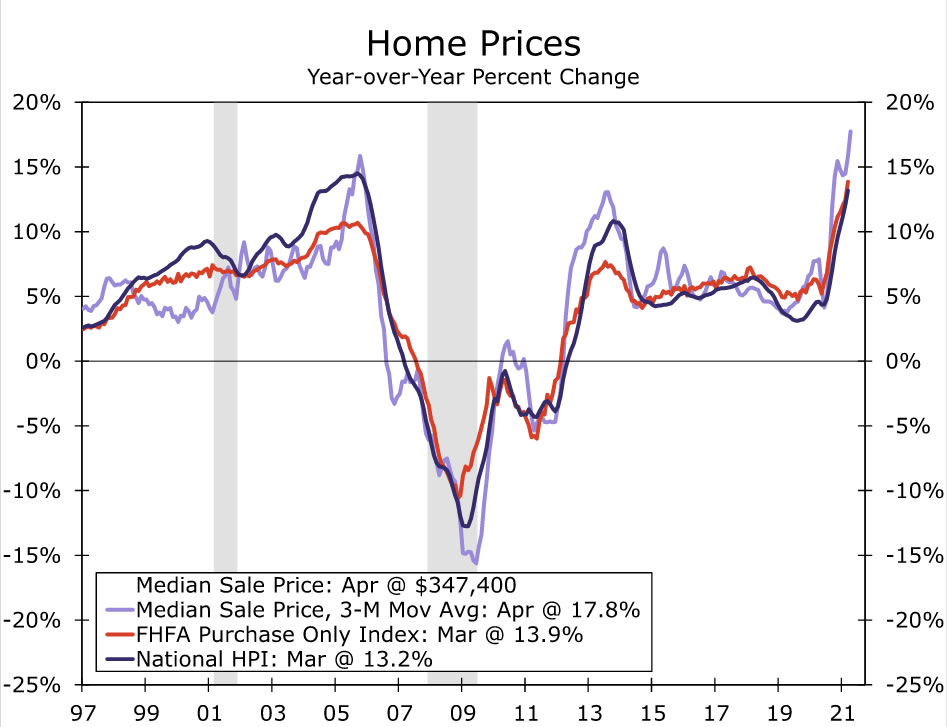
Home prices have clearly jumped. The median price of a new home surged 11.4% on a non-seasonally adjusted basis in April and is up 20% over the past year. Part of this past month’s surge in prices reflects an 8.2% decline in new home sales in the South—the largest and most affordable region for new home sales—and a 7.9% rise in home sales in the West, which is the second-largest region for new home sales and the least affordable region. Prices are also being driven higher by rising construction costs, reflecting soaring lumber prices, higher labor costs and higher lot costs. While supply shortages are clearly playing a role in driving prices higher, demand is also doing its part. Builders report buyers are largely shrugging off higher prices, and report brisk demand for new homes. Builders are increasingly limiting sales in new communities. Prices for existing homes have also spiked, with the S&P CoreLogic Case-Shiller National Home Price Index jumping 1.5% in March and climbing at a 17.2% annual rate during Q1.
The best cure for high prices is high prices. Higher selling prices should bring out more sellers and prompt builders to build more homes. Further back in the supply chain, higher lumber prices are spurring production at sawmills around the country. Prices have eased slightly in recent days. The major motor vehicle manufacturers are also investing in new equipment to deal with supply bottlenecks and there have been a flurry of announcements from firms planning to increase production of microchips. The increased emphasis on boosting production capacity and bringing supply and demand back into balance was evident in the advanced durable goods report, which showed overall orders falling 1.3% in April. The drop was the first drop in 11 months and was largely due to a drop in orders for aircraft and motor vehicles, while orders for nondefense durable goods, or core capital goods, rose a solid 2.3%. Whether this will be enough to avoid a larger flareup in inflation that lingers for a while remains to be seen. (Return to Summary)
U.S. Outlook
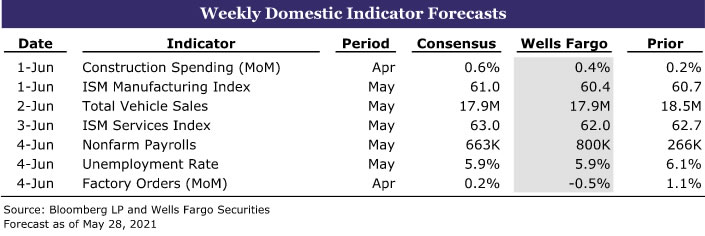
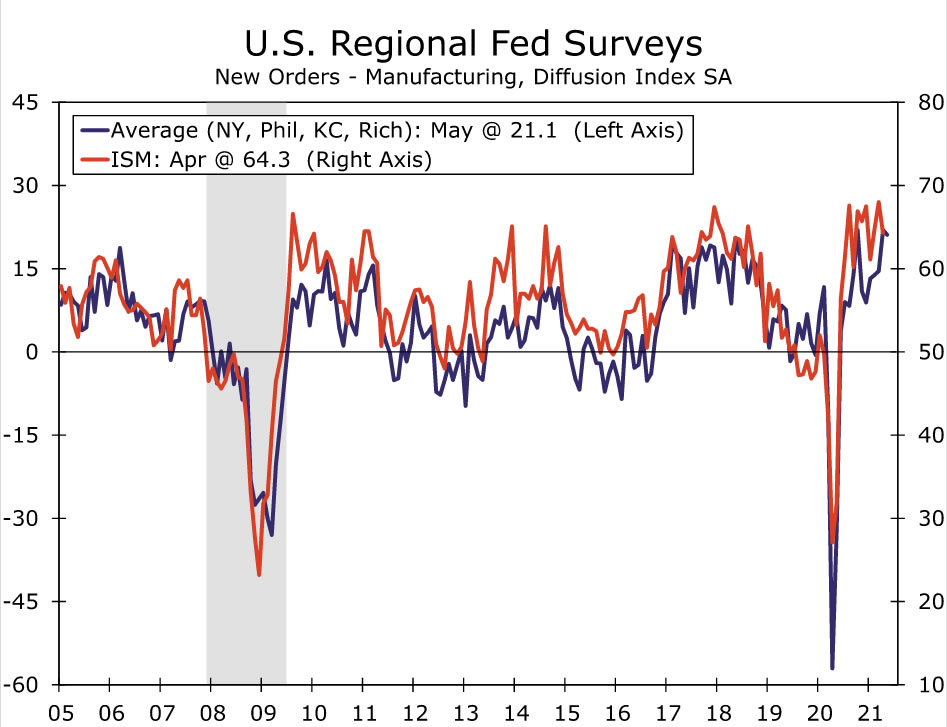
ISM Manufacturing Index • Tuesday
After notching a high not seen since the 1980s, the ISM manufacturing index slipped four points, or the most since lockdown measures last March, in April. We expect the index gave up a bit more ground in May and slid to 60.4, which is still a reading that signals broad and strong expansion in the sector.
The main takeaway from the ISM in recent months is that the economy could be running even hotter if it were not for a variety of constraints on supply. We expect this remained a theme in May. But we still expect demand remained robust and orders continued to roll in last month based on new orders holding up across a number of regional Fed PMI surveys.
Supply issues likely continued to constrain production and lead to higher order backlogs. We will be paying close attention to the prices paid component in next week’s release, which has surged in recent months as low supply is met with solid demand. Higher input prices paid by manufacturers could further stoke concerns that inflationary pressure may be here for longer than implied by the transitory pop associated with the reopening.
Source: Institute for Supply Management, Federal Reserve System and Wells Fargo Securities
ISM Services Index • Thursday
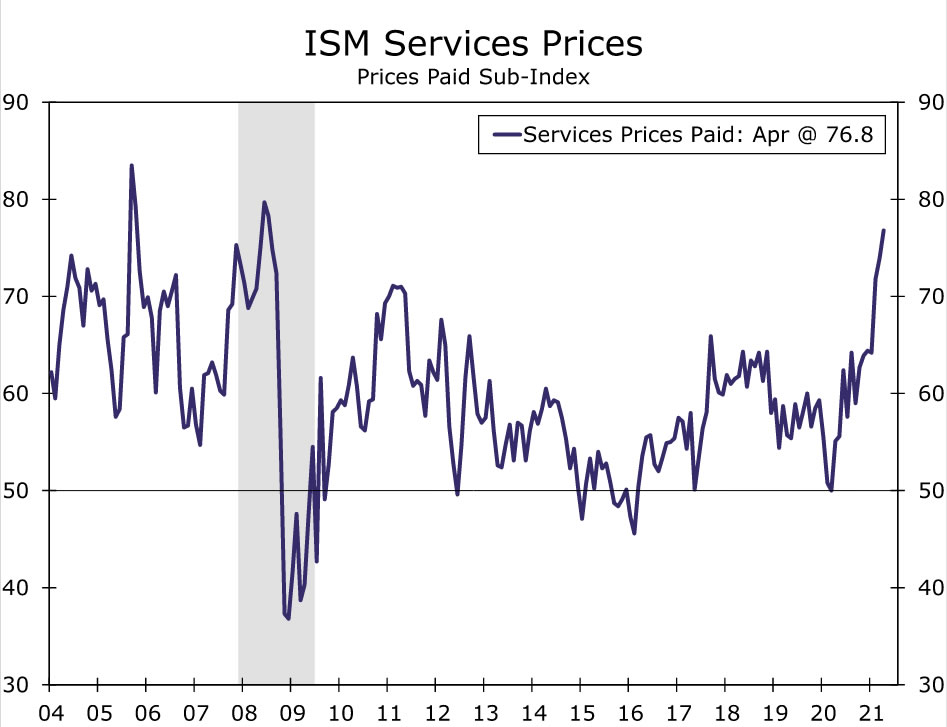
Supply shortages are not limited to the manufacturing sector. The services side of the economy is facing its fair share of problems, as service providers also struggle to get their hands on the materials and help they need. Supply issues, rather than a lack of demand, is what we expect is responsible for slower service sector activity this month, and we forecast the ISM services index eased modestly to 62.0 in May from 62.7 previously.
We believe the reopening of the economy amid increased vaccinations and households’ desire to again participate in many previously constrained services is about to unleash a rapid recovery in the service sector (See Topic of the Week for more detail). As such, demand factors that drive service sector activity are only starting to heat up. Strong demand matched with scarce supply is stoking inflation, exhibited by the recent jump in the prices paid component.
If the ISM comes in weaker than expected, scarce supply is limiting the rebound. A better print, however, would suggest the service sector is restarting despite these headwinds and perhaps signal services are in such high demand that consumers will happily accept the higher price tag.
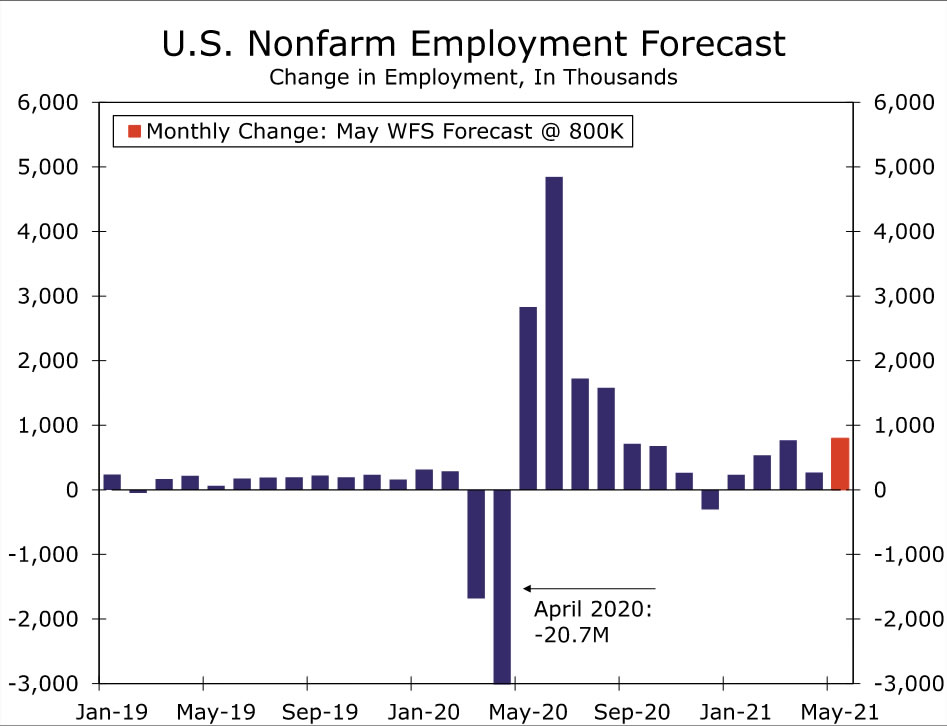
Employment • Friday
Fully reopening the economy after a pandemic is not a seamless process and this was on full display in the April jobs report. Strong demand for labor as firms reopen and restaff collided with a number of constraints on the supply of workers. Still, the April payroll figure was in stark contrast with other data on the labor market. PMI indices on employment, consumers’ views of the job market and declining jobless claims all suggest the economy should be adding jobs at a robust pace.
While we don’t suspect all the labor supply issues worked themselves out in May, we believe the jobs’ recovery got back on track. We forecast employers added 800K jobs during the month and the unemployment rate ticked down to 5.9%. We will also be paying extra close attention to any revisions to prior month’s data in next week’s release.
If employers added significantly fewer jobs than we forecast, it would seem the disconnect between the demand for and supply of labor needs a little more time to work out. A weak report could entrench expectations that tapering doesn’t start until early 2022, despite the recent rise in inflation. Alternatively, big upward revisions to prior data or a solid gain in May employment, particularly if accompanied by a meaningful upward revision to April, may put a brighter spotlight on when the Fed may discuss and ultimately kick off tapering.
International Review
Less Positive on the U.S. Dollar Outlook
It was an especially light week on the international economic data front. On Tuesday, however, we released our monthly International Economic Outlook for May. Below, we review some key takeaways.
As the world slowly emerges from the COVID crisis, the aftershock to the global economy is becoming increasingly evident, as cross currents have become more apparent across geographical regions as well as across time. Overall the global economy remains on a path to recovery, but the performance of individual economies is varied. The variance reflects economies that were initially hit and then began to recover from the COVID crisis at different times, as well as differing policy responses (i.e., public health policy, monetary and fiscal policy) by governments and other institutions. As a result, the pattern of economic recovery has been unusual and unpredictable in early 2021.

The outlook for many European economies has brightened as they begin to emerge from COVID-related restrictions that had restrained growth. United Kingdom activity and survey data have surged in recent months, while a rise in key PMI and KOF confidence surveys in the Eurozone and Switzerland point to a significant upswing in economic momentum for those economies moving forward. As a result, we have revised our 2021 GDP growth forecast for the Eurozone and the United Kingdom perceptibly higher.
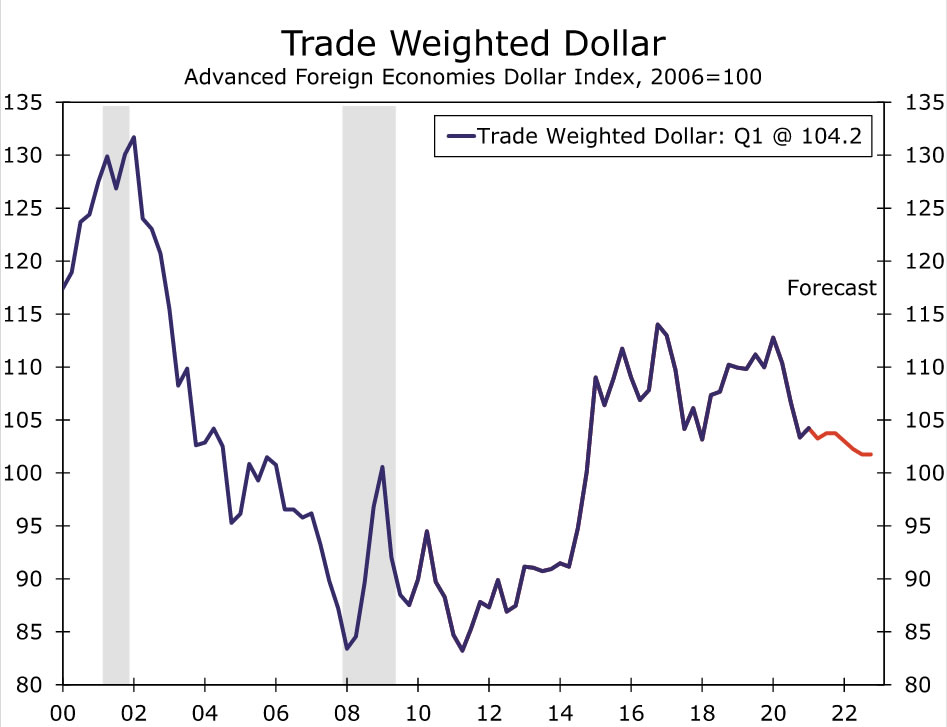
In addition to cross currents among the developed economies, there have also been some among the emerging economies. China’s Q1 GDP growth slowed to just 0.6% quarter-over-quarter, and activity data and confidence surveys were up and down during the early part of 2021, while Mexico also eked out a small gain in Q1 GDP. Moreover, with COVID cases still widespread in countries such as India and Brazil, among others, we have revised our outlook for growth among the emerging economies lower in recent months. In the aggregate, our forecast is for global growth of 6.3% for 2021 and 4.1% for 2022 (above chart).
In terms of our currency forecasts, we think this translates into a softer U.S. dollar than we had previously anticipated (above chart). The longer-term fundamentals (global growth catch-up and relative monetary policy trends) remain consistent with a weaker greenback, in our view. However, we had previously anticipated a period of near-term U.S. dollar strength before the greenback softness emerged. In our opinion, recent developments, including relative economic and monetary policy trends, and low FX volatility, make that near-term U.S. currency strength seem less likely. Instead, we now lean toward a brief period of U.S. dollar stability before U.S. dollar softness resumes.
International Outlook
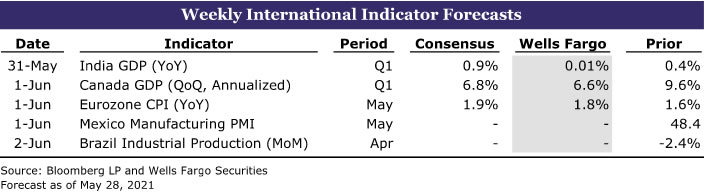
India Q1 GDP • Monday
In the first quarter of calendar year 2021, the Indian economy was continuing to regain its footing. COVID spread was at reasonably low levels, and on a sequential basis, the Indian economy grew 10% to finish 2020. As recently as April 7, the Reserve Bank of India’s monetary policy statement pointed to continued gains in manufacturing and services activity. Around that time, however, COVID cases exploded in the country, taking a significant human and economic toll. As a result, although the Q1 numbers may show a modest rise in real GDP growth in India, this lagging indicator masks the economic problems that began at the end of the first quarter. To that point, we downwardly revised our forecast for Indian GDP growth for the second month in a row.
The Reserve Bank of India (RBI) also meets next week for a monetary policy meeting. In our view, the RBI is likely to continue Operation Twist measures and asset purchases, both forms of monetary policy easing, and the fragile state of India’s economy will force the RBI to keep interest rates on hold both at the upcoming meeting and over time as the recovery progresses.
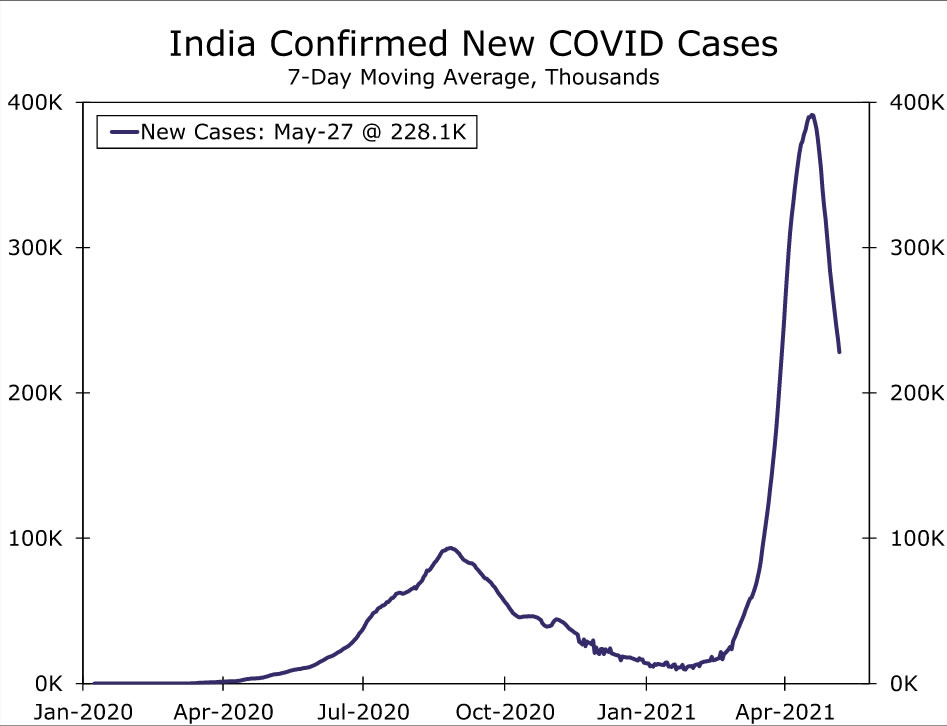
Canada Q1 GDP • Tuesday
When data for Q1 Canadian GDP growth are reported next Tuesday, we expect the figures to show the Canadian economy grew somewhere in the 6%-7% range on a quarter-over-quarter, annualized basis. If realized, this would put Q1 Canadian economic growth right around the 6.4% reported in the United States in Q1. The Bank of Canada has taken steps to slow its bond purchase program, although this was in part due to an improving economy and in part for market-functioning reasons.
However, after a solid start to 2021, renewed COVID-related restrictions will likely cause growth to slow in Q2. Canada lags the United States in its vaccination program, and in April, Canadian employment declined for the first time since January. The Canadian employment data for May are released next Friday and will show what kind of bounce back, if any, has occurred. Longer term, we believe the public health situation will improve, and the broader fundamentals remain supportive of the economy, including sturdy household income trends, elevated savings rates and generally high commodity prices.
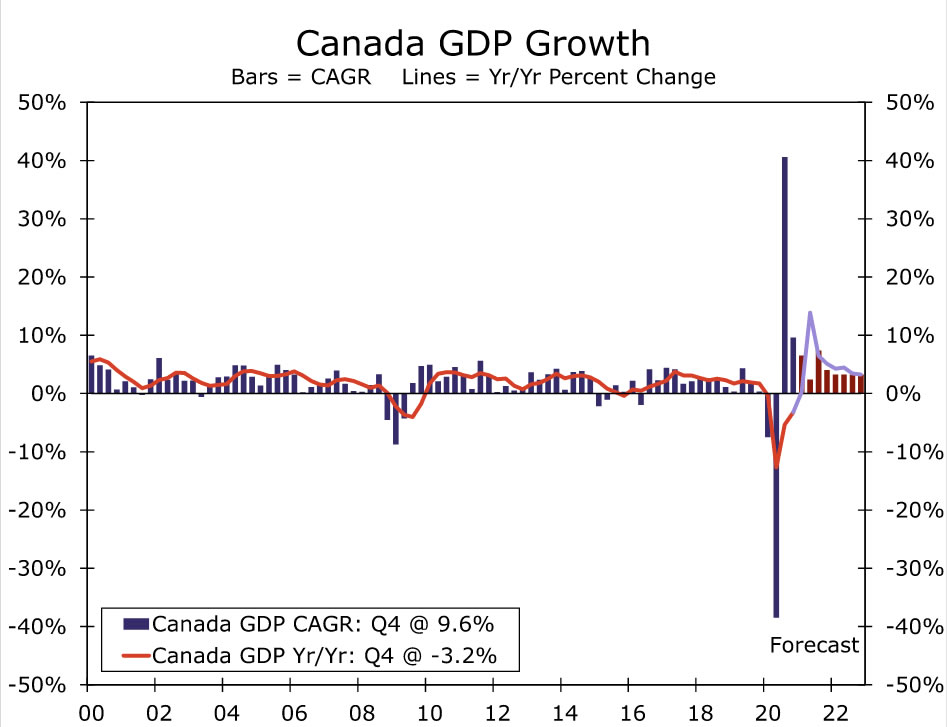
Eurozone CPI • Tuesday
Higher expected inflation in the United States has been corroborated recently by higher realized inflation in recent months. In April, the headline CPI in the United States rose 4.2% year-over-year, while core inflation rose 3.0%. The reasons for this are well-known: base effects from the year-ago comparison, significant pent-up demand amid a better public health situation, still flowing fiscal stimulus, etc.
In the Eurozone, realized inflation has not seen quite the same pickup. Headline CPI inflation was 1.6% year-over-year in April, up from 0.9% at the start of the year but still much lower than the comparable U.S. reading. Core inflation was even lower at just 0.7%. We expect prices to accelerate as Europe follows the United States into a full reopening, but we believe price pressures will still be much more muted on a relative basis. We look for Eurozone headline CPI inflation to average 1.6% in 2021 and 1.3% in 2022.
Interest Rate Watch
Eye-Popping Inflation Not Widespread, but Enough to Drive Inflation Expectations Up
April’s jumps in the “core” Consumer Price Index and the “core” PCE deflator, the largest one-month increases since the early 1980s, have brought forward questions as to how much inflation the Fed might be willing to withstand before adjusting policy. Fed officials have been adamant that the current pace of inflation is unlikely to be sustained after the initial burst of activity associated with the economy’s reopening and resulting bottlenecks subside. To that end, April’s leap in prices was largely driven by categories hit particularly hard by the pandemic and recent supply chain issues. While the core CPI rose 0.9% in April, prices for used vehicles, car & truck rentals, hotels, airline tickets and sporting events all rose 8% or more last month.
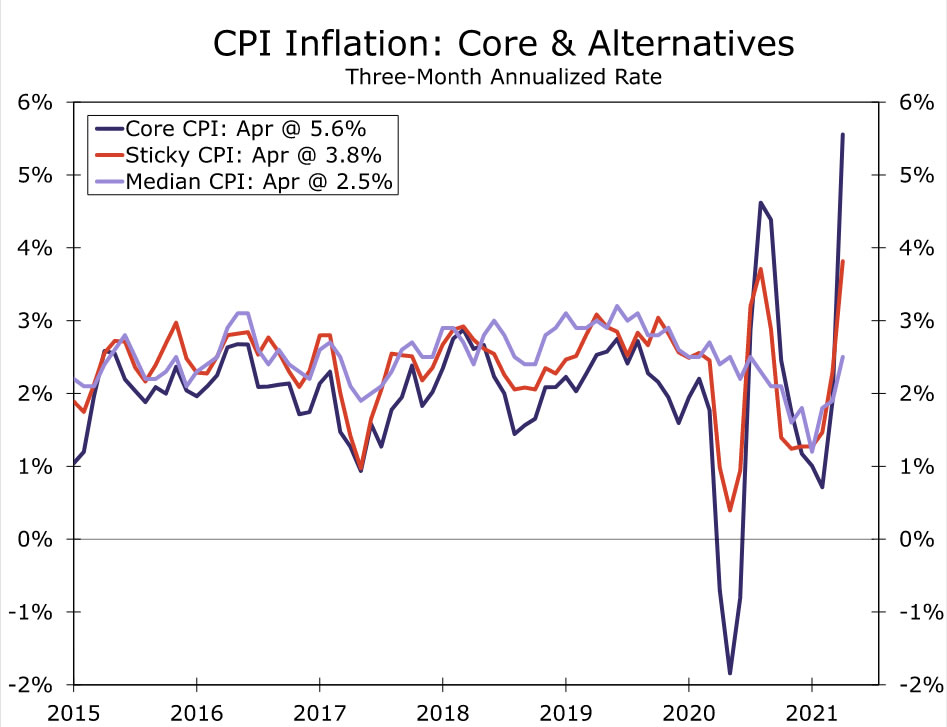
The degree to which the rapid strengthening in price growth has been driven by extreme jumps in a few categories can be more clearly seen in alternative measures of inflation. The traditional core CPI, which excludes food and energy, is up at a 5.6% annualized pace the past three months. But the Sticky CPI, which focuses on items for which prices change relatively infrequently, and the Median CPI have picked up to a less alarming degree. This marks a turnaround from the past two decades, when alternative measures tended to outpace traditional core inflation, and likely gives the Fed confidence that the current pop in inflation is indeed being driven by some unique factors.
While the more tempered pickup in alternative measures of inflation suggests that prices are not surging in a widespread fashion, there is danger in that the hard-to-miss hikes in some categories raise expectations for future inflation. Higher inflation expectations could become self-fulfilling, as businesses raise prices in anticipation of higher costs and workers push for greater wages to compensate for rising living expenses.
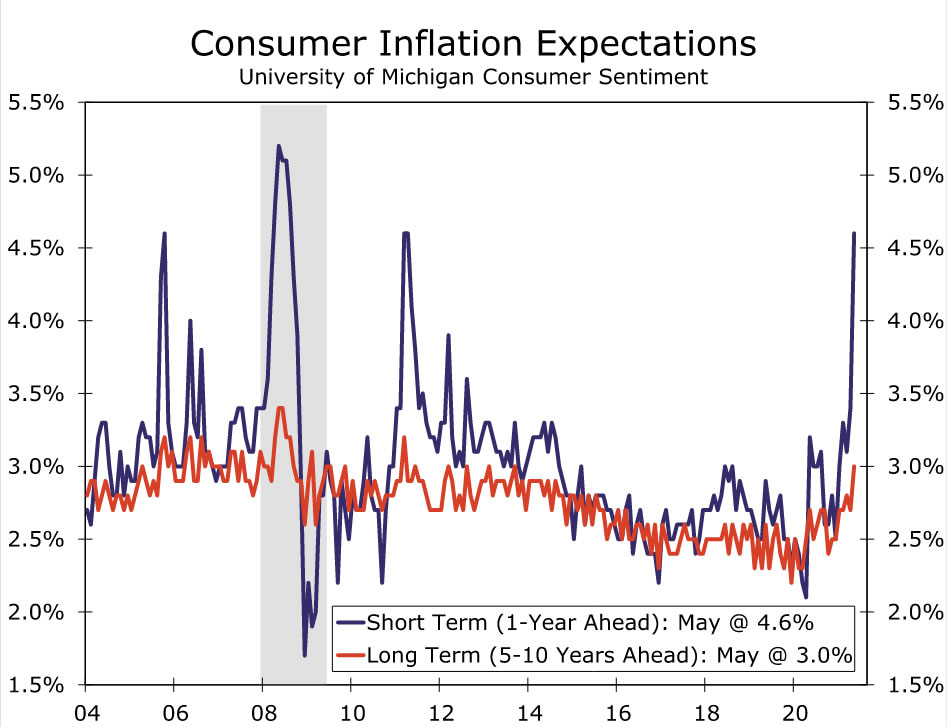
Consumer inflation expectations shot up further in the May Consumer Sentiment Survey. As Fed Governor Lael Brainard said this week, “a very important part of inflation dynamics is longer-term inflation expectations and those have been extremely well-anchored.” Yet as actual inflation rises, those expectations may quickly become unanchored as the May reading hinted.
For now, inflation expectations, while certainly higher than in recent years, remain near levels consistent with the Fed’s 2% PCE goal over time. As demand growth cools and supply constraints ease over the year, price pressures should abate in the areas seeing particularly sharp price hikes, which in turn, should curb the rise in inflation expectations. But how high inflation expectations rise in the meantime is likely to influence where inflation settles down even after the unique factors currently speeding inflation along subside. Along with the breadth of price hikes indicated by alternative measures of inflation, these expectations will bear close watching by Fed officials and watchers alike.
Topic of the Week
The Party’s Just Getting Started for Services
Over the past year, we have watched as piled-up excess savings have left consumers flush with cash, and finally, we are on the verge of what we have all been waiting for: the services spending boom. Real services spending fell sharply over the past year due to the inability to purchase many services, and it remained 4.7% below its February 2020 level as of April. But, changes are on the horizon, as we expect more than four and a half years of typical spending to occur in the next three quarters. This would move the level $700 billion higher than Q1-2020 by year’s end (see chart). It’s not just a rebound; it’s a tsunami of spending.
While many nondiscretionary categories of spending or “staples,” such as housing & utilities, financial services & insurance and healthcare, are now over or close to their pre-pandemic levels, “discretionary” and “other” services spending remain depressed. These categories are crucial to what we have deemed the “recreation renaissance.” Recreation spending is essential to the robust service rebirth, as real spending in this category is almost $100 billion under its pre-pandemic level. However, food services and transportation services also fall under the discretionary umbrella, and stand to benefit from a resurgence in leisure activity and vacation travel this year. As in-person entertainment again becomes an option, bars & restaurants and hotels are able to lift restrictions and more of the nation starts hitting the road for personal & business travel, each of these categories should see the strong demand they need to take off.
A closer look at the other major category of services spending that is under its Q1-2020 level, other services (-$93B), exposes another clear area for growth. The catch-all category has obvious room for improvement in three main areas: personal care services, education and childcare services. As with leisure & travel, their higher exposure to social distancing requirements meant spending was limited, so shifting to in-person activities should boost consumption.
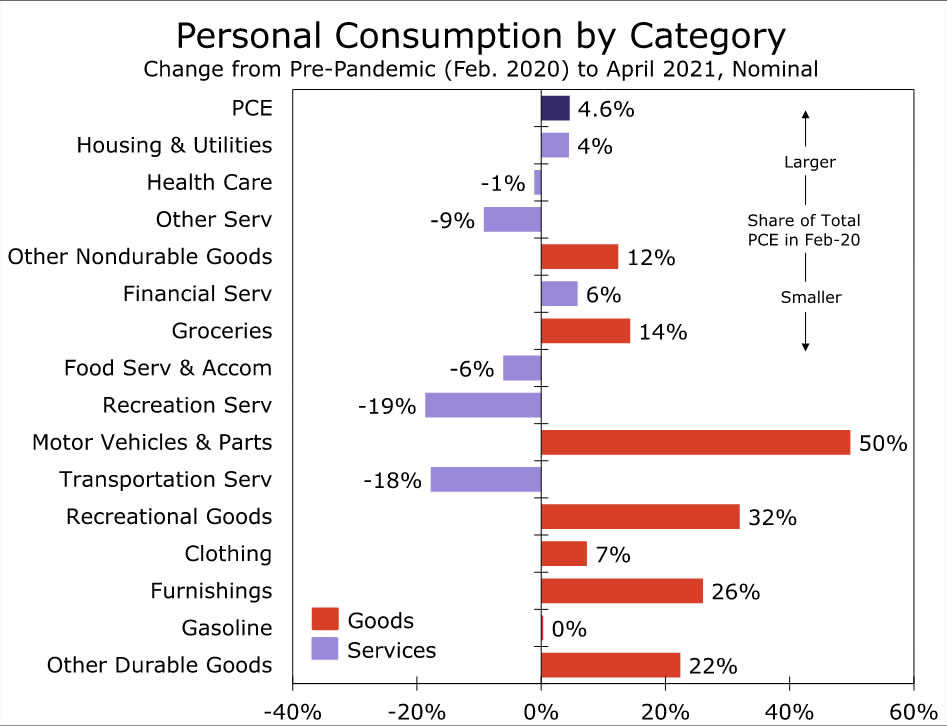
The services sector resurgence we expect also need not take away from the invaluable support goods spending has provided to consumer spending this past year. In fact, we think the goods spending spree could continue. Real consumer spending levels are only a stone’s throw away from where their pre-pandemic peak thanks to goods spending, which is currently 16% above its February 2020 level. Despite the robust rebound already seen in durable goods spending, spending to date still only accounts for around 40% of growth typically seen over an entire cycle, so there is still room to run. Furthermore, the massive amount of excess savings on household balance sheets afford households the means to continue to spend.
The bottom line is that the confluence of consumers with full wallets and more spending options should lead to robust, double-digit consumer spending growth this year. But, the reopening of the economy has not been without its struggles, as goods and services providers face supply constraints due to input and labor shortages. A translation of these issues into higher consumer prices could mean that confidence and purchasing power could decrease. However, for now, we are optimistic and are anticipating a period of historic growth for consumer spending.


