
Summary
The 2008-2009 recession was followed by a slow economic recovery and major downgrades to estimates of U.S. potential GDP growth. As we emerge from the economic damage wrought by COVID-19, will the 2020s be another “lower for longer” period? Or will the post-pandemic economy buck the trend and undergo a renaissance?
Potential GDP growth, or the long-run sustainable run-rate of the economy, is a significant determinant of household income growth, business profit growth and real interest rates. Potential growth can be broken down into three components: labor, capital and total factor productivity (i.e., intangible factors that lead to a better combination of capital and labor, like new technology). We believe there are both reasons for optimism and pessimism regarding the outlook for potential GDP growth in the 2020s.
For the optimists: (Upside Case)
- Labor: Remote work facilitates both higher participation and more hours worked; the robust policy response and rapid rebound in output limits labor market scarring; new polices improve structural child care challenges and lift participation
- Capital: Government investment rises up off the mat following the federal infrastructure deal and state & local governments’ overflowing coffers; an already impressive performance in private investment over the past 18 months continues amid efforts to make supply chains more resilient
- Productivity: Remote work generates better matching between employers and employees; recent tech advancements become more widely adopted; the tight labor market of recent years leads to more investment in new technologies
For the pessimists: (Downside Case)
- Labor: Damage to the labor force cuts deeply due to retirements and shifts in industry activity; new policies aimed at supporting families underwhelm, stymied by capacity; waning boost from immigration
- Capital: Higher corporate taxes dampens private investment; federal infrastructure deal generates only a very small boost to growth
- Productivity: Work from home is a one-time boost affecting only a slice of the workforce; pandemic learning-loss dents future human capital; productivity inflection points are hard to forecast—best to assume status quo in meantime
We lean toward the upside case. The 2010s illustrated that workers will respond to persistently strong labor demand, and remote work and policy support to families further raise the prospect for somewhat faster growth in hours worked. Even if higher corporate taxes come to pass, investment seems likely to grow faster than in the past cycle given a tight labor market and greater public investment spending. Productivity growth was already trending higher pre-pandemic, and mere mean reversion could supply a noticeable lift to potential growth. We estimate potential growth through the end of the decade to be around 2.2%—stronger than the 2010s and current estimates from the FOMC and CBO.
The magnitude of our upgrade to potential GDP is relatively small, but the direction is meaningful. Small changes over long periods of time can compound, pointing to a higher level of output and income at the end of the decade. While the global savings glut should continue to put significant downward pressure on long-term rates, stronger potential GDP growth along with structurally higher inflation suggest that revisions to the neutral rate of interest may not always be downward. We believe long-term interest rates are headed higher in the years ahead even if they remain relatively low by historical standards.
What Is the U.S. Economy’s Cruising Altitude?
Potential GDP growth is difficult to measure, even harder to predict, and unlike nonfarm payrolls or CPI, it does not move financial markets on a day-to-day basis. However, potential GDP growth is one of the straws that stirs the drink for financial markets and the economy. It offers insights into the medium- to long-run outlook for key macroeconomic variables such as household incomes, business profits and real interest rates. And just because shifts in the potential growth rate of the U.S. economy tend to occur slowly does not mean they do not occur at all. Major economic events, such as the invention and adoption of electricity or the 2008-2009 financial crisis, can fundamentally alter the potential growth rate of the economy. Events do not even necessarily need to be economic in nature; World War II and its aftershocks played an enormous role in the evolution of the U.S. economy over the subsequent decades. Today, as the United States emerges from the worst pandemic in a century, significant structural changes in the economy and society appear to be at hand. In this report, we explore how the COVID-19 pandemic may alter the long-run potential growth rate of the U.S. economy.
What Is Potential Growth?
Over the short run, aggregate spending drives economic growth. It is from the demand-side that economists derived the well-known equation C+I+G+NX=GDP. However, over the long run, economic growth is driven by an economy’s capacity to produce goods and services. Today’s environment offers a timely example of the importance of supply-side factors in determining growth. Demand has boomed since the start of the year thanks to the tremendous fiscal transfers to households and the unleashing of built up savings. However, without a similar boom in the capacity to produce goods and services, the economy has had trouble meeting this demand. While growth has been exceptionally strong over the first half of the year, it could have been even stronger had the U.S. economy’s productive capacity kept up.
So what drives an economy’s capacity to produce goods and services? The sustainable growth rate for an economy is determined by labor force growth and the productivity growth of those workers. The latter half of this duo can further be divided into two drivers: capital (the tools utilized by the workers) and total factor productivity (the intangibles that affect output per hour worked, such as new innovations or processes). Put a little more simply, producing more stuff requires more inputs (labor and capital), or a more efficient mix of the same inputs (total factor productivity).
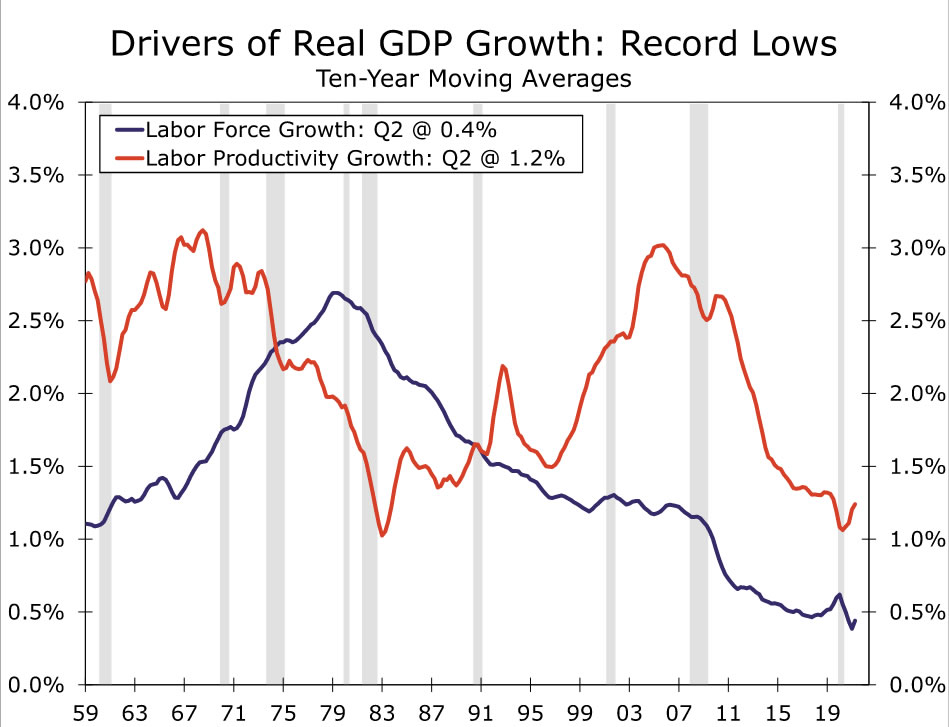
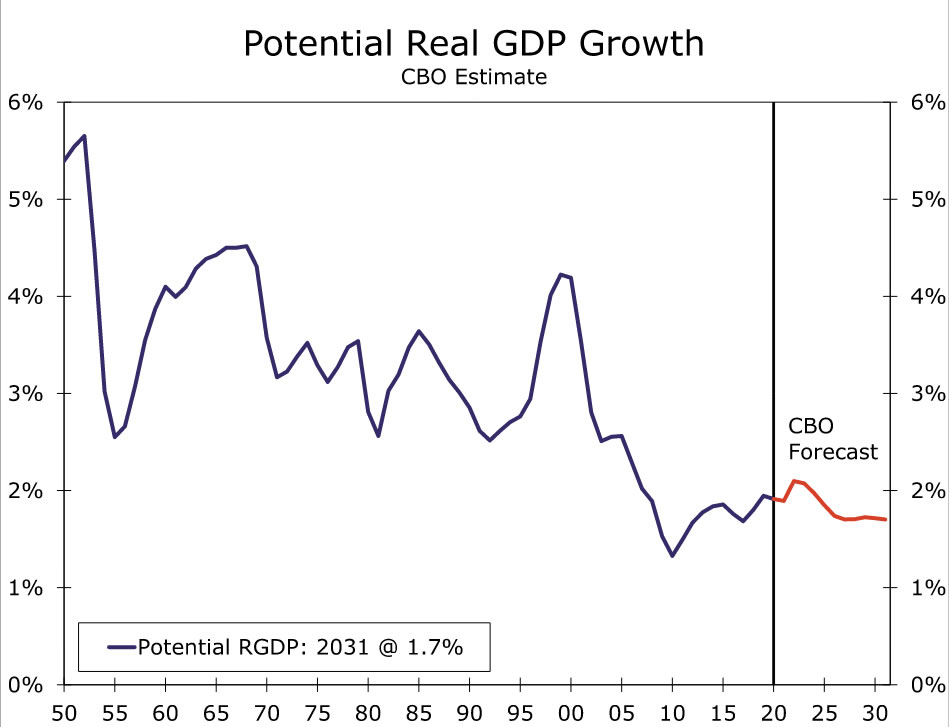
By taking a moving average over a 10-year period, we can smooth through the noise in the data and get a sense of how labor force and labor productivity growth have evolved over time. As Figure 1 illustrates, labor force growth has been slowing for decades. The moderation reflects an aging population, declining fertility rates and a leveling off of female labor force participation in recent decades. The slowdown in labor productivity growth is more recent and dates back to the end of the internet boom in the mid-2000s and the 2008-2009 financial crisis. The Congressional Budget Office (CBO) produces the most well-known estimate of U.S. potential GDP growth, and unsurprisingly its estimate for potential growth in the 2010s was historically low (Figure 2).
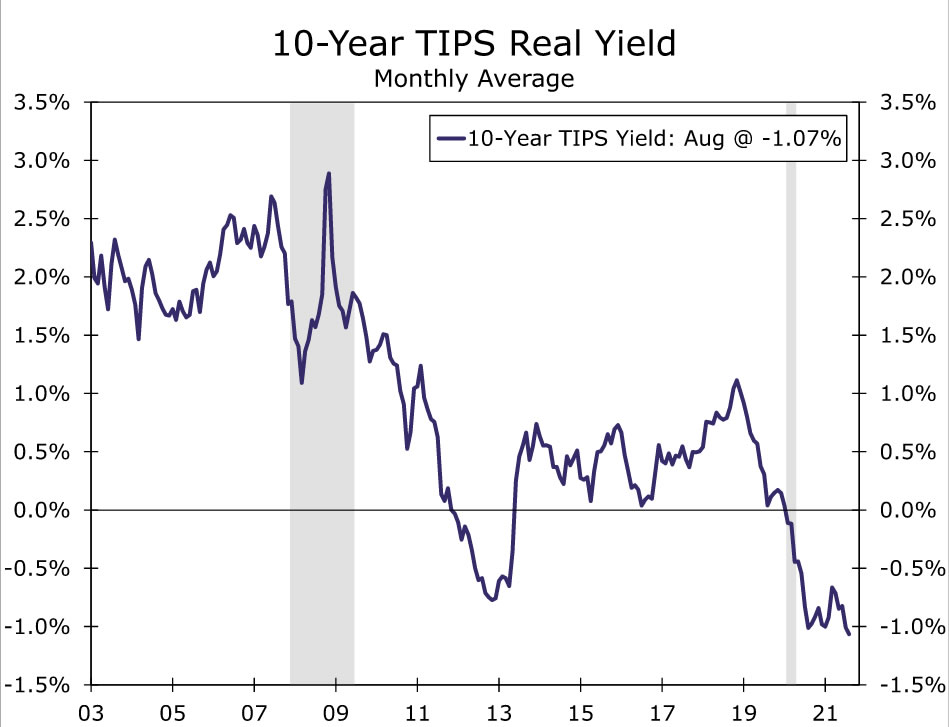
As we emerge from the COVID pandemic and look ahead to the 2020s, where is potential growth headed? The question is not merely an academic one. An economy’s potential growth rate has enormous financial market and policy implications. Faster potential growth should be associated with stronger household income and business profit growth, all else equal. In addition, slower potential growth should be associated with lower real interest rates, all else equal, and that is exactly what the United States has experienced over much of the past decade (Figure 3).
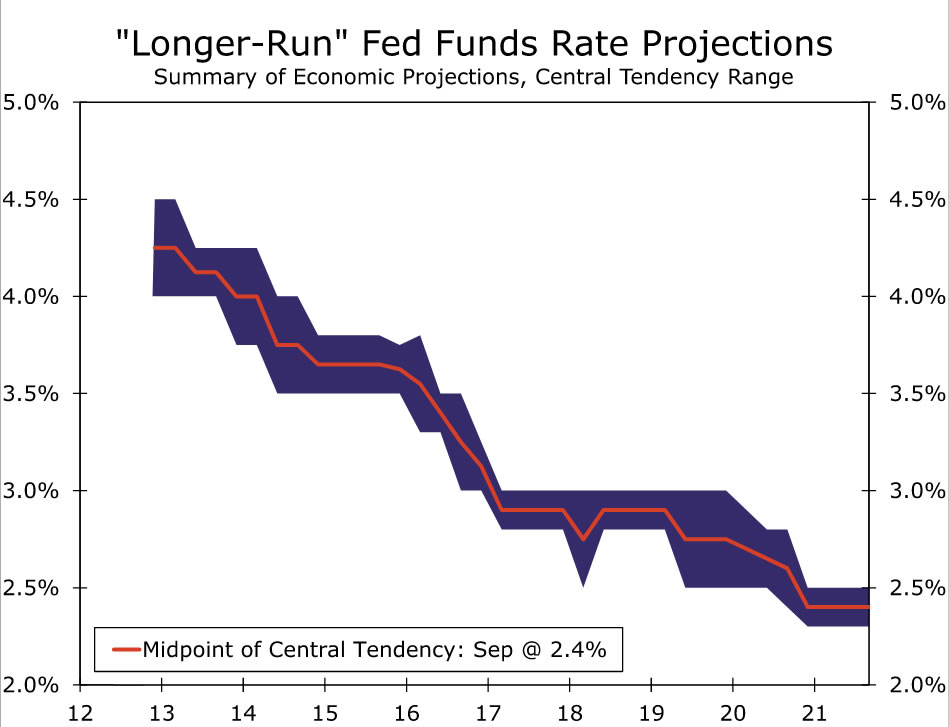
Accordingly, FOMC officials have downwardly revised their estimates for the “long-run” fed funds rate that should prevail when the economy is operating at full potential (Figure 4). Since the pandemic began, however, the median estimate for the long-run dot has not changed. Perhaps this is unsurprising given how little visibility the Fed has had into the post-pandemic economy. But as we slowly navigate our way toward a post-pandemic world, the outlook for potential growth, the long-run fed funds target and interest rates more broadly have come into focus. In the sections below, we lay out an upside and a downside case for potential GDP growth. We then lay out which side of the argument on which we land and discuss some possible implications of this view.
Upside Case
The economist Paul Romer quipped back in 2004 that “a crisis is a terrible thing to waste.” Could the COVID-19 crisis be a catalyst in changing the way people work, businesses invest and governments spend to such an extent that these changes lift potential GDP growth?
Labor: New Avenues to Raise Hours Worked
The demographic headwinds to potential growth are well in train, but they could be alleviated by stronger labor force participation. The forceful fiscal and monetary policy response to this crisis has prevented traditional recessionary dynamics from taking hold and has put the labor market recovery on the fast track compared to recent cycles. Early pandemic layoffs were more tilted toward temporary rather than permanent job losses, and as the recovery has taken hold labor demand has been robust, especially compared to the early 2010s recovery.
Limited scarring could lead to a quick resumption in the pre-COVID trend in participation within individual age groups. A rise in labor force participation within age groups similar to 2015-2019 would push the labor force participation rate to 63.1% in 2029, compared to the CBO’s estimate of 61.2%.1 If realized, that alone would translate into potential GDP growth that is an extra 0.2-0.3 points higher.
That labor force participation projection may even prove too pessimistic. The pandemic has accelerated the rise in remote working. Employers’ growing comfort with work from home could facilitate more individuals joining the workforce, either because they are better able to balance paid and unpaid work or find enticing job opportunities beyond their local market. Remote work could also allow employees to log more hours as commute time is freed up, offering another way to boost the total labor input in the economy.
Furthermore, policy changes on the horizon could also unlock unused sources of labor. The United States led the pack in women’s labor force participation in the late 1990s, but it has subsequently fallen behind as other countries developed more supportive policies for working parents.2 If the Biden administration’s efforts to offer universal preschool for three and four year-olds, subsidize childcare costs and extend the expanded childcare tax credit succeed, the scales could be tipped in favor of paid work for some caregivers. In 2019, labor force participation among mothers with a child under the age of six was a full 10 percentage points lower than for mothers with a child age 6-17, illustrating the importance of affordable childcare in helping parents work outside the home.3
Capital: A Far Cry from the Last Recovery
Some recent public policy efforts also look poised to help raise the capital stock at a faster pace in the decade ahead. This new spending comes at an opportune time as government investment as a share of GDP was historically low for much of the 2010s (Figure 5). In the 2010s, state and local governments turned to austerity amid a slow economic recovery, depressed real estate valuations and financial challenges related to pension funding. At the federal level, discretionary spending was limited by budget caps and “sequestration” while the spending growth that did occur was dominated by transfer payment programs like Social Security and Medicare.
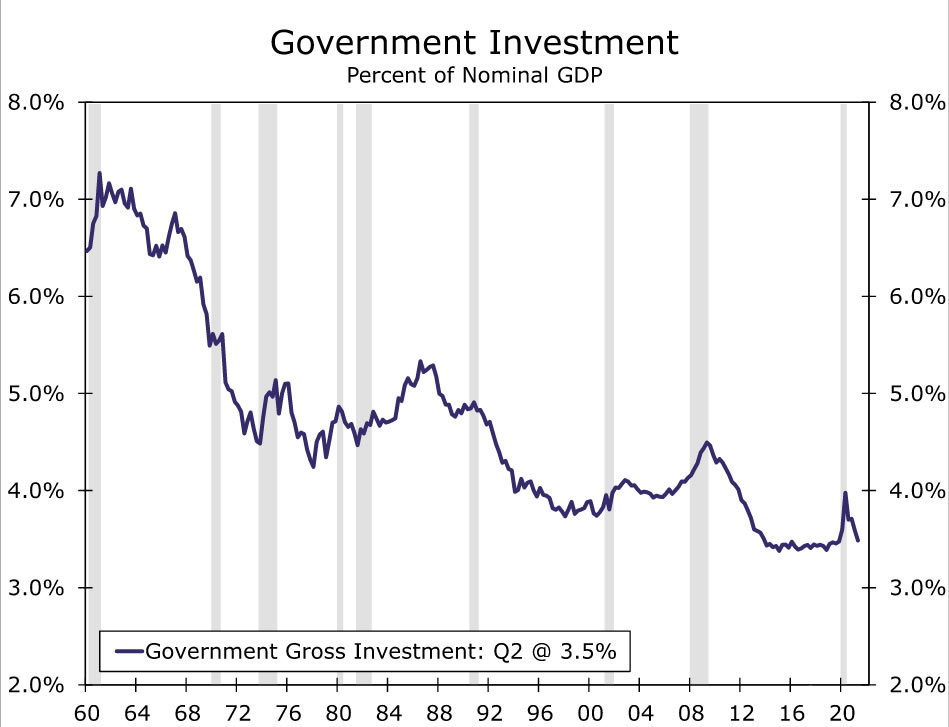
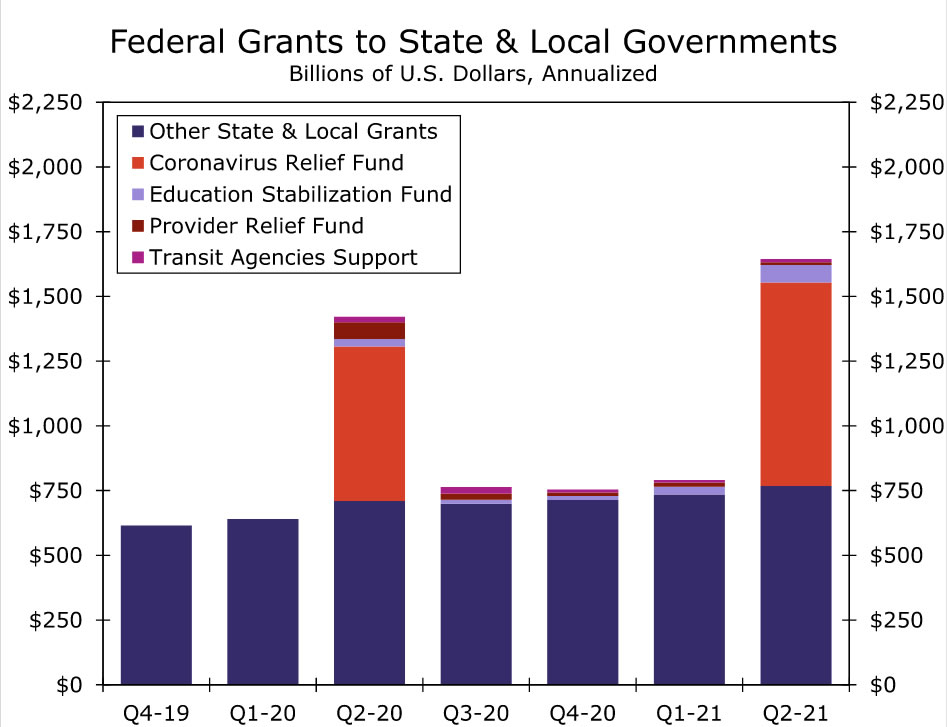
The bipartisan infrastructure package currently working its way through Congress includes $550B in new spending on physical infrastructure over the next decade. In addition, state and local governments are flush with cash as this economic recovery has been much more robust than the early 2010s. Through the first half of 2021, inflation-adjusted state and local tax receipts are up 6.1% compared to 2019. The federal government has also provided a breathtaking amount of aid to state and local governments since the pandemic began (Figure 6). As a result, state and local governments are well-positioned to boost public investment on not just physical infrastructure but also other areas like education. The tailwinds for public investment are much more favorable today compared to a decade ago, and all levels of government appear poised to contribute to an acceleration in public investment over the next decade.
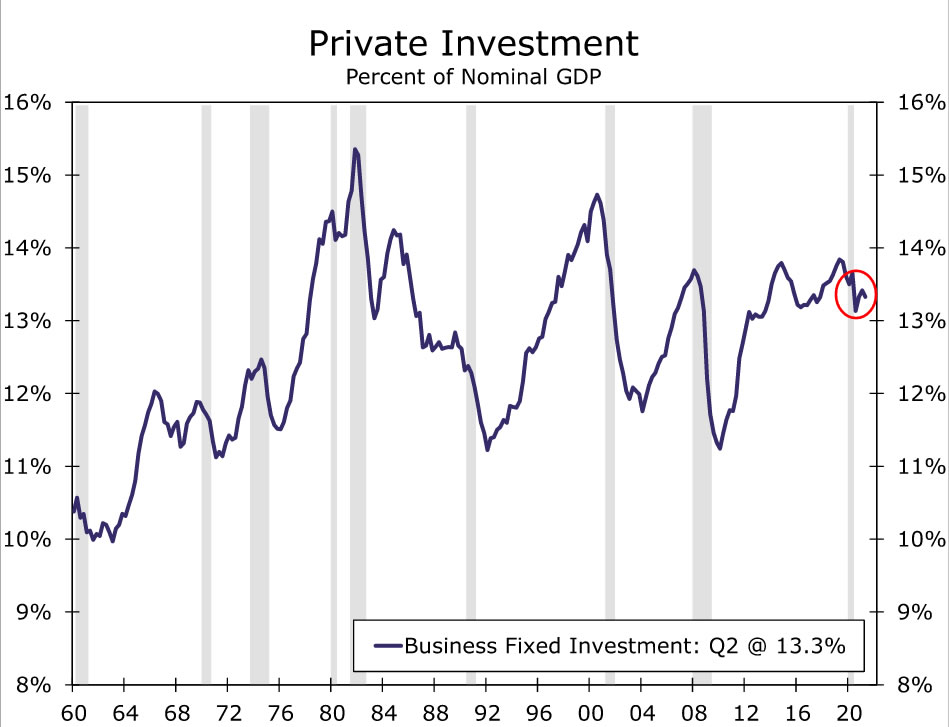
This potential increase in public investment comes on top of what has already been an impressive cycle for private business investment. Companies typically slash investment in a downturn to preserve cash flow and await greater certainty; investment as a share of GDP plummets as a result (Figure 7). But, capital spending barely dipped before ripping higher over the past year. Firms reoriented operations to not only survive the pandemic but to capitalize on new opportunities arising from the sudden shift in activity. Efforts to make severely strained supply chains more resilient and the case for more investment in the manufacturing sector point to tailwinds remaining in place over the coming years.
Productivity: Only Way to Go from Here Is Up?
Beyond more labor and more capital is the prospect of a more efficient combination of the two, i.e., total factor productivity (TFP). Working from home could generate better matching between employers and employees as neither are limited to the workers and jobs in their local market. At the same time, early studies show that working from home can boost individuals’ productivity, subject to some caveats like having a designated work space.4 Even where working from home was not as productive as the office, the gap has narrowed tremendously relative to 2019 with the boom in technology adopted to support remote work.5 Innovation could also get a boost from a surge in new business formation as new products and processes are commercialized, while better quality labor could be on the horizon thanks to two years of free community college and more generous Pell grants under the Biden administration’s proposals.
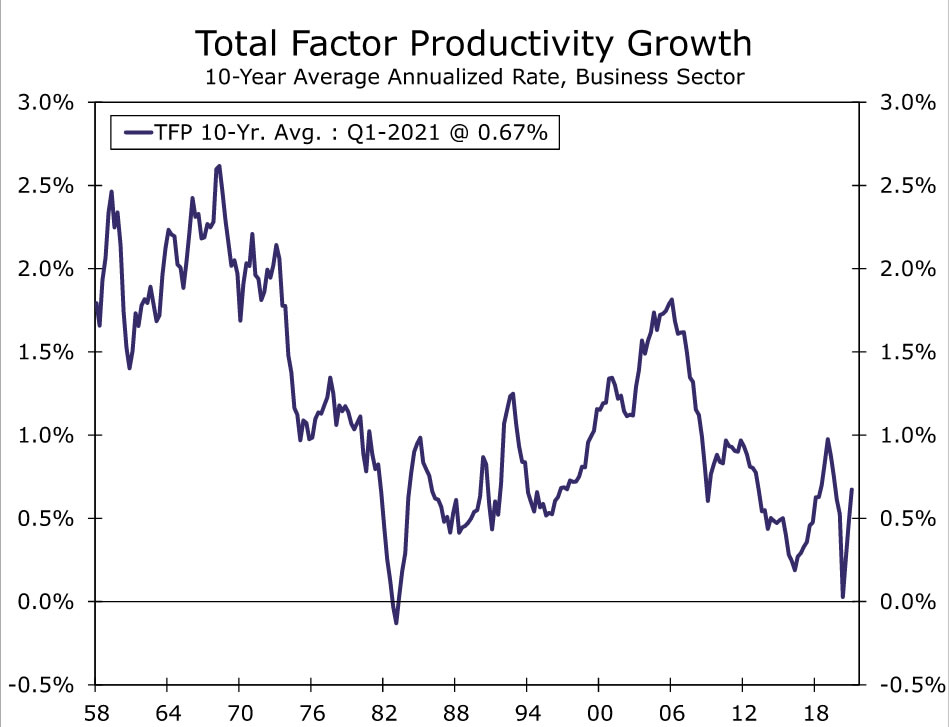
More generally, the bar for stronger productivity growth relative to the past decade is low. Total factor productivity growth averaged just0.6% over the 10-year expansion that ended in 2019, the poorest performance of any decade since the 1980s. Encouragingly, TFP started to perk up late last cycle (Figure 8). Perhaps such low rates earlier in the cycle meant productivity was due for a pickup, and mere mean reversion points to stronger TFP ahead. Yet there is also a case to be made that breakthroughs in machine learning, automation and big data are on the cusp of widespread adoption that can finally move the needle on productivity. After all, it took until the mid-1990s for computers to finally be used widely enough to lift aggregate productivity growth.6
Current labor shortages so soon after the tight labor market of the late 2010s may also lead businesses to invest in better technology. When labor is relatively cheap, firms may view the financial risks associated with developing new technology as unnecessary. Yet, if labor availability and costs are becoming particularly vexing issues, it could encourage businesses to devote more resources toward research and development and help speed any subsequent breakthroughs along.
Downside Case
Could stronger potential growth after the economic trauma of the pandemic merely be wishful thinking? After all, the 2008-2009 recession inflicted long-lasting damage on labor and investment. Moreover, many of the underlying determinants of potential growth are slow moving and not easily altered.
Labor: More Scarring and Less Policy Help than Meets the Eye
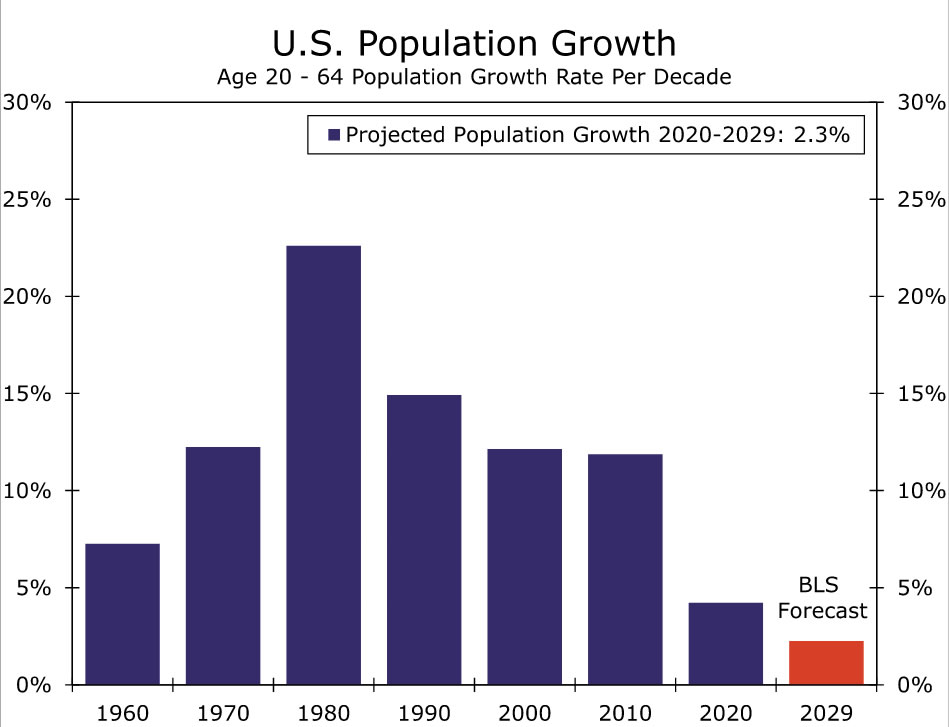
As discussed earlier, demographic trends were already weighing heavily on potential growth. The U.S. population ages 20-64 is expected to grow just 0.2% per annum over the remainder of the decade compared to 0.4% per year in the 2010s and 1.1% in the 2000s (Figure 9). The expected slowdown stems from the youngest Baby Boomers reaching the traditional age of retirement as well as falling fertility rates among both native and foreign-born women. Immigration has been fairly steady in recent years and foreign-born workers have provided a sizable share of labor force growth over the past two decades (46%). That said, gridlock in Washington, D.C. on immigration policy suggests the trend is more likely to get worse than better. This deprives the United States of an immediate source of labor as well as labor force growth down the road, since foreign-born women continue to have higher birthrates than U.S. born women across all racial and ethnic groups.7
Higher labor force participation is therefore imperative in improving labor supply growth ahead. Yet the supply hit from COVID lingers. Even as GDP has made a full recovery and job openings have blown past prior highs, the labor force has 2.9M fewer people in it compared to pre-COVID. Many of the reasons workers have not returned seem temporary, such as childcare issues related to school disruptions, health concerns about catching COVID and more generous unemployment benefits. However, the longer the pandemic drags on and workers stay on the sidelines, the less likely they are to return to the labor force.8
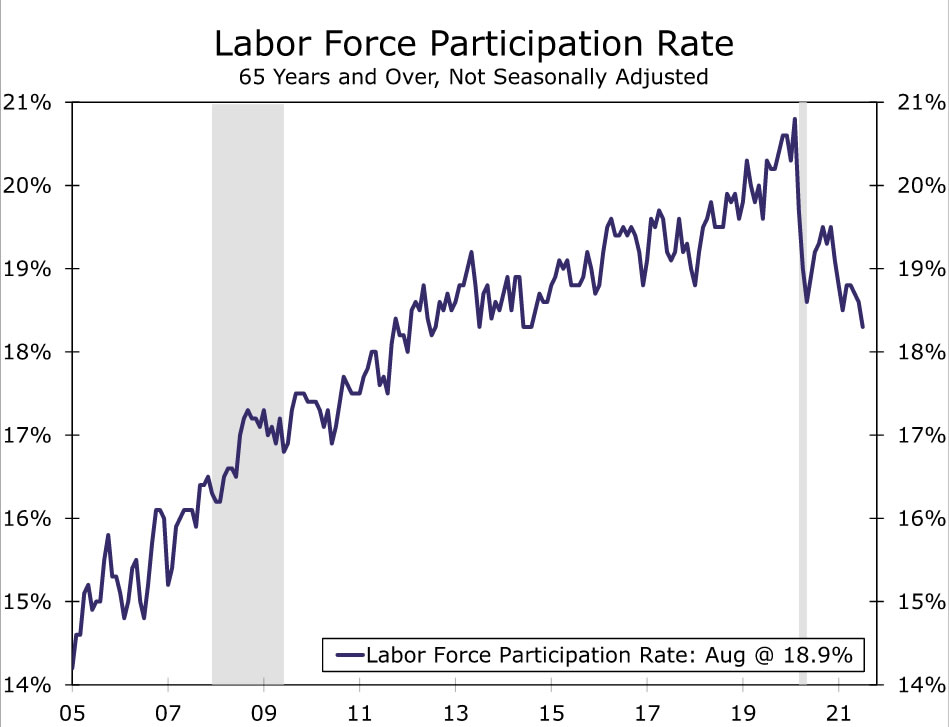
Furthermore, not all workers have left the labor force for reasons that are likely to be short term in nature. In sharp contrast to the past cycle, the participation rate of older workers has plummeted amid mass retirements (Figure 10). The prospect of these workers returning to the jobs market when the public health situation and economy improve further is lower than for younger workers. At the same time, the rapid reorientation of the economy means many workers will have to switch industries and careers post-COVID. That will take time, and not all will make the transition.
Policy efforts to support families may not be a game changer for labor force participation and therefore potential growth if not well-designed. Paying for child care and universal access to preschool is one thing, but increasing the capacity of these sectors is quite another. As of August, there were already 12% fewer employees at U.S. childcare facilities since February 2020, implying a significant reduction in capacity since COVID. It is also somewhat unclear if a more generous child tax credit with no strings attached would end up reducing hours worked. Some research suggests that the expanded child tax credit will depress labor supply, but the estimated magnitude of the hit is contested.9These changes must also be viewed through the lens of other tax credit changes that could have a positive impact on labor supply, such as the proposed permanent expansion of the Earned Income Tax Credit. Ultimately, the policy design of what does (or does not) become law on individual income tax policy will be key to determining the direction and magnitude of the impact on labor supply.
Capital: Higher Taxes Bite
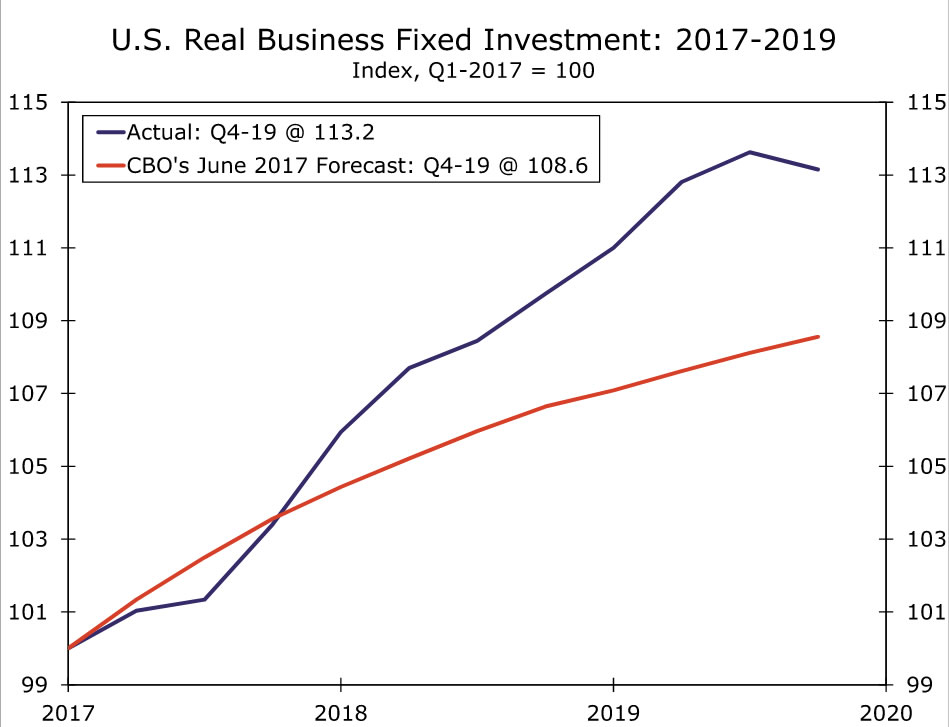
Potential changes to the taxation of capital could also influence the ultimate impact on potential growth. Higher corporate income taxes to fund the administration’s $3.5T proposed budget agenda could weigh on private investment. An initial glance at the data does suggest that the 2017 tax cuts boosted the economy over the ensuing couple years, albeit by less than some of the bill’s most optimistic proponents suggested. U.S. real GDP outperformed the CBO’s June 2017 baseline over the following two and a half years, and business fixed investment contributed to that outperformance (Figure 11).
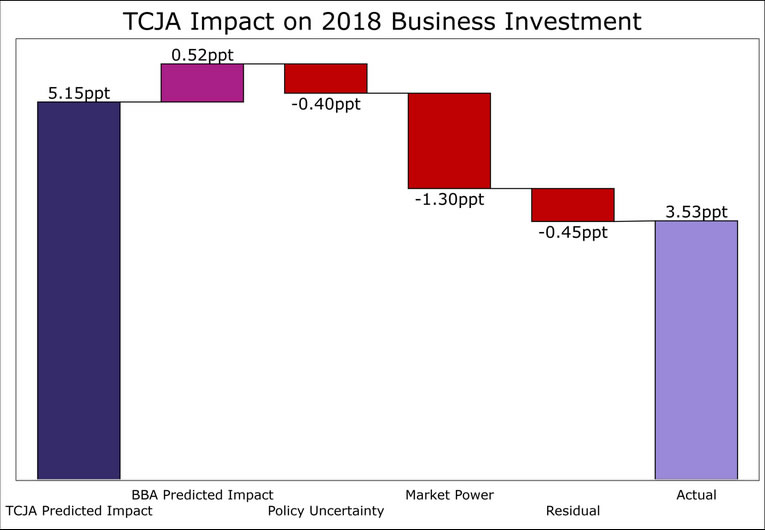
Of course, these better-than-projected economic outcomes might not be entirely attributable to the Tax Cuts and Jobs Act (TCJA). CBO underestimating the output gap, stronger-than-expected aggregate demand, an increase in discretionary spending from the Bipartisan Budget Act (BBA) of 2018 and multiple other factors could account for the difference. Alternatively, there were some other factors that may have weighed on growth in business fixed investment and real GDP growth over this period, such as trade policy changes and uncertainty.
A recent study by economists at the International Monetary Fund that attempted to account for these factors offered fodder for both proponents and opponents of the bill.10 The authors noted that business investment growth since 2017 (but before the pandemic) was stronger than forecasted pre-TCJA, and this outperformance was stronger than what was seen in other advanced economies. But, after accounting for many of the aforementioned factors, U.S. business investment underperformed the predicted impact based on prior empirical evidence. If the corporate income tax cuts did have some positive impact on business investment in the years that followed, it seems reasonable to conclude that reversing these tax cuts would weigh on investment growth at least somewhat.
In addition, a recent study from the CBO on the long-run impact from a $500 billion infrastructure package found only a very small positive impact on the level of real GDP over the next decade.11 And while private sector and state and local balance sheets are relatively healthy coming out of the pandemic, this is in part due to the significant borrowing the federal government has done to prop them up. For now, low interest rates and political indifference to budget deficits have kept the money flowing. However, it is possible that changes in macroeconomic conditions, political realities or both could lead to much tighter federal fiscal policy in the decade ahead.
Productivity: Not So Easy to Move the Dial
Perhaps the most nagging reason to stay cautious on the outlook for potential growth is productivity. Regime changes in productivity growth are notoriously difficult to predict. Until then, it may be safest to assume the status quo. The evidence for how much working from home may raise productivity is far from overwhelming. Only a fraction (about 20%) of workers are able to work at home without a loss of productivity.12 And even if productivity at home is comparable to the office, will it be a one-time level shift, or will it continue to rise faster than the traditional office? The training and social capital afforded by the office have helped make the transition to remote work a success, but those benefits are at risk of fraying over time. Moreover, slower growth in human capital due to learning loss from the pandemic is also likely to weigh on future productivity. Researchers at the San Francisco Fed estimate that school closures and parental income loss (which affects additional investment in education), could lower future output by about one-fourth point per year over the next 70 years.13
What Would a One-Handed Economist Say?
Two-handed economists have been frustrating audiences for close to a century. Therefore, if we had to pick the more plausible scenario, which hand would we choose? We lean toward the upside case. We believe there is scope for potential output to grow faster in the current decade than it did over the past decade (1.7% per year according to the CBO), as well as what the CBO and Fed project ahead (1.9% per annum from 2021-2029 in the case of the CBO, and 1.8% in the case of the FOMC’s longer-run estimate). But the temptation economists have to use two hands is rooted in the trade-offs, crosscurrents and uncertainty that come with new policies and shocks to the economic landscape. To that end, we believe the upside to potential growth is likely to be relatively modest given the structural factors related to demographics and the potential offsets discussed in our downside case.
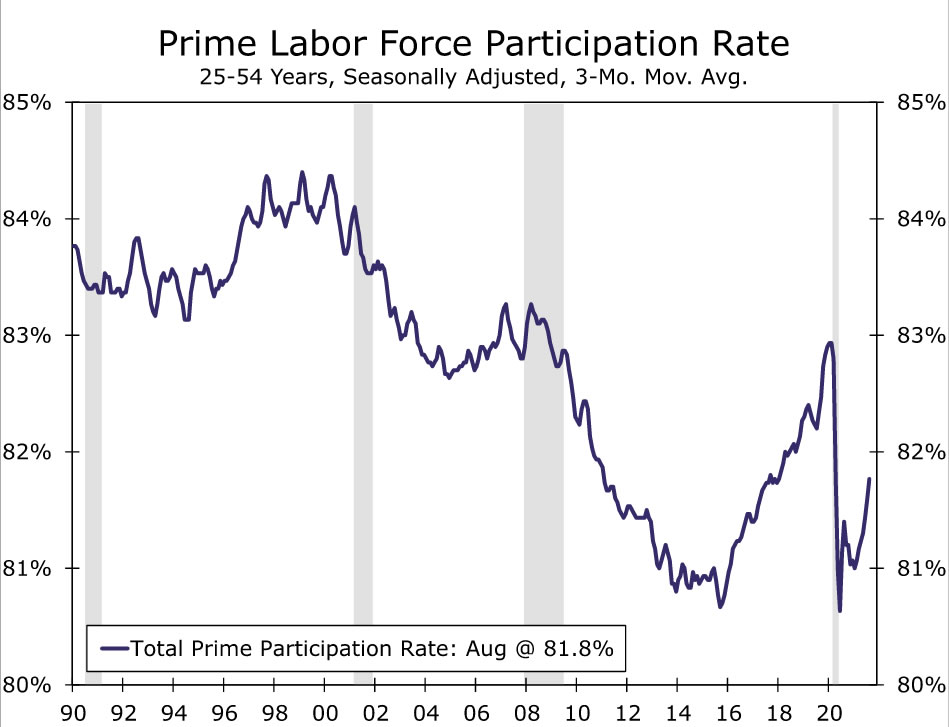
For a marked rise in potential growth, all three components—labor, capital, and TFP—would likely need to rise in tandem. The labor component is where we see the most upside relative to the CBO’s estimates. The 2010s illustrated that sidelined workers did eventually respond to persistently strong demand. The participation rate among prime-age workers (ages 25-54) came within a few ticks of reaching its pre-Great Recession peak after having been written off as being permanently lower by many in the early part of the decade (Figure 14). While 2.9M fewer people are in the labor force than in February 2020, many of the constraints keeping people out of the workforce are unique to the pandemic and temporary in nature. Factor in greater employment options thanks to remote work or the ability to work more hours as commute time is freed up, and we land on the optimistic side of the labor picture. However, population dynamics remain formidable. Even with a few extra tenths for potential GDP growth squeezed out of the workforce, the contribution from labor would remain historically low (Figure 13).
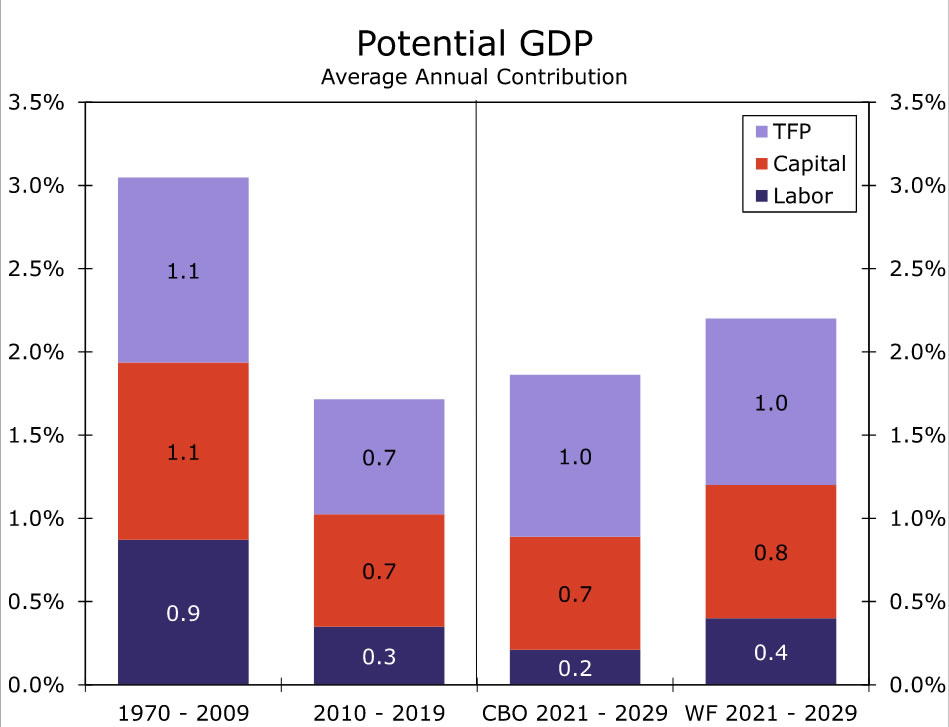
As far as an upswing in the capital contribution, we are more cautious. The CBO estimates that capital will contribute an average of 0.7 points to potential growth over the remainder of the decade, on par with the 2010s. We view this as a plausible estimate, with the risks skewed toward slightly higher. Public investment appears poised to strengthen considerably compared to the 2010s, particularly at the state and local level. Corporate finances are reasonably solid and the labor market is already tight, which augers well for more capital investment. Attempts to improve supply lines over the next few years should also support new capital formation. Yet the likelihood of higher business tax rates and softer final demand as the decade grinds on suggests capital contribution is likely to lessen during the out-years and keeps capital’s contribution subdued relative to the decades that preceded the Great Recession. On net, our potential growth estimate includes an additional tenth to the headline from capital compared to CBO’s estimate.
As mentioned earlier, productivity is particularly difficult to predict, but some degree of pickup seems like the best bet. Among the three components of potential growth, TFP is the only one CBO projects to notably strengthen in the 2020s compared to the 2010s. History suggests mean-reversion is a powerful trend when it comes to TFP, and the pickup in TFP growth before the pandemic offers some tentative evidence that this may have been occurring late in the last decade.
Given the improving trend in TFP immediately preceding the pandemic and near-term prospects for productivity-enhancing investment, including R&D, we believe a pickup in TFP relative to the past decade is a reasonable working assumption. Whether working from home will help TFP grow faster in a sustained way remains to be seen, but most students affected by learning loss are still years away from joining the workforce. Our forecast for TFP more or less mirrors CBO’s, with TFP adding 1.0 percentage point to potential growth, slightly below its average from 1970-2009 but three-tenths above its contribution in the 2010s.
The public policy piece of the puzzle creates some additional uncertainty around our potential growth forecast. There are a significant number of policy changes currently on the table before Congress including new spending on infrastructure, child care subsidies, universal pre-K, paid family leave, health care and numerous changes to individual and corporate income taxes. Teasing out the net impact on potential growth from these policy changes will be difficult even once we know what will become law, which as of this writing remains unknown. Based off of what we know now, it is relatively easy for us to imagine the end result of these policy changes being enough to add a couple additional tenths to potential GDP growth over the next decade. However, we can also imagine a scenario just about as equally likely where the cumulative policy changes before Congress subtracts a couple tenths from potential growth. Subsequently, we treat these changes as a net wash until we know more, while recognizing that the uncertainty in this area creates an additional margin of error around our forecast.
All told, we believe that potential growth will directionally be a bit higher in the current cycle compared to both the past cycle and the CBO’s outlook. However, we think the magnitude of this increase is measured in just a few tenths of a percentage point, with potential real GDP growth averaging around 2.2% over the next decade. Although this would be a relative improvement from the 2010s, in an absolute sense the economy’s “cruising altitude” would remain low by historical standards.
Monetary Policy Implications
While the magnitude of our upgrade to potential GDP is growth relatively small and comes with uncertainty, the direction is meaningful. Even small changes in growth over long periods of time can compound and have a significant impact on the level of output and income. The level of potential output in the United States is more than 5% higher in 2029 in our projections compared to CBO. Furthermore, if potential growth is flat to modestly up in the 2020s compared to the 2010s, this would suggest that the FOMC may not repeatedly revise down its estimate of the “long-run” fed funds rate like it did in the 2010s.
Of course, other factors could put downward pressure on long-term interest rates. But, as we have laid out in other reports, we think some of these factors, such as inflation, have also broken from their pre-pandemic trend. Perhaps other factors, like a structural upward shift in savings or a downshift in potential growth elsewhere in the world, will put downward pressure on the neutral rate such that it offsets the upward pressure emanating from somewhat faster U.S. economic growth and inflation. Multiple indicators suggest that markets are anticipating the fed funds rate to be well-below the Fed’s 2.5% “long-run” dot in the second half of this decade (Figures 15 and 16).
We certainly subscribe to the belief that the global savings glut will continue to put significant downward pressure on long-term interest rates. Indeed, our forecast has the 10-year Treasury yield rising to “only” 2.25% by year-end 2023. However, in a world where it seems everyone is concerned about the next leg lower in interest rates, our review of the potential growth outlook is in line with our belief that interest rates are headed higher in the coming years even if they remain relatively low by historical standards.
Endnotes
1 Our average estimate for LFPR for 2022-2029 would be 62.6% vs. CBO estimate of 61.8%. Please see “Projecting Labor Force Participation Beyond COVID” for more information.
2 In 1999, U.S. women had the seventh-highest participation rate among 34 OECD countries, but that slipped to 20th in 2019—the largest ranking drop of any country.
3 TED: Economics Daily. “Labor force participation declines for mothers and fathers in 2020.” Last modified April 27, 2021.
4 Bloom, Nicholas, Liang, James, Roberts, John and Ying, Zhichun Jenny, “Does Working from Home Work? Evidence from a Chinese Experiment,” The Quarterly Journal of Economics (2015), p. 165-218.; Emma Harrington and Natalia Emanuel. Working Paper. “‘Working’ Remotely? Selection, Treatment, and Market Provision of Remote Work” 2021.
5 Morris Davis, Andra Ghent, Jesse Gregory. Working Paper. “The Work-from-Home Technology Boon and its Consequences.” 2021. (Return)
6 John Fernald, “A Quarterly, Utilization-Adjusted Series on Total Factor Productivity.” FRBSF Working Paper 2012-19 (updated March 2014).
7 Gretchen Livingston, “Hispanic women no longer account for the majority of immigrant births in the U.S.“, Pew Research Center, last modified August 8, 2019.
8 Andreas Mueller, Johannes Spinnewijn, Giorgio Topa. Working Paper. Job Seeker’ Perceptions and Employment Prospects 2021.
9 Danilo Trisi, Ife Floyd. “Benefits of Expanding Child Tax Credit Outweigh Small Employment Effects” Center on Budget and Policy Priorities. March 1, 2021. https://www.cbpp.org/research/federal-tax/benefits-of-expanding-child-tax-credit-outweigh-small-employment-effects; Alex Brill, Kyle Pomerleau, Grant Seiter. “Unintended consequences: Democrat’s child tax credit will cost jobs” April 22, 2021
10 Emanuel Kopp et al. Working Paper. U.S. Investment Since the Tax Cuts and Jobs Act of 2017. 2019.
11 Congressional Budget Office, “Effects of Physical Infrastructure Spending on the Economy“, August 2021.
12 Brodie Boland et al. “Reimagining the office and work life after COVID-19” June 8, 2020.
13 John Fernald, Huiyu Li, Mitchell Ochse, “Future Output Loss from COVID-Induced School Closures“, FRBSF Economic Letter, February 16, 2021


