
U.S. Highlights
- Equity markets fell this week as various concerns weighed on sentiment, including central banks signaling an end to pandemic era stimulus. Fortunately, Congress agreed to a last-minute spending deal to avert a shutdown, but it will still need to raise the debt ceiling.
- August consumer spending data showed underlying resilience in services outlays despite the increase in infections. It also showed core services price pressures cooling slightly, supporting the Fed’s narrative that inflation will cool in the month ahead.
Canadian Highlights
- July’s industry-level real GDP, the key data release this week, revealed a lesser-than-expected 0.1% contraction in activity during the month.
- Flash estimates point to a healthy, 0.7% rebound in economic activity in August. And although we’re not out of the woods yet, health indicators have shown stabilization, or even improvement in some provinces in recent weeks.
Special Feature: Global Energy Supply Squeeze Taking the Spotlight
- A global energy supply squeeze has taken the spotlight this week, amplifying the uptrend in natural gas prices.
- The turn of events has sparked concerns around economic output and inflation in Europe and Asia, with prices at the mercy of weather. North America is experiencing some ripple effects, but faces lesser risks given its ample domestic production.
U.S. – Markets Fall Despite Economic Resilience
Equity markets had a notable decline this week due to various issues, among them worries about a delta-variant driven slowdown and central banks signaling an end to pandemic-era stimulus. Congress is once again locked in brinksmanship on the debt ceiling, although markets are likely less spooked having seen this show numerous times before. Friday’s economic data looked pretty good, but was not enough to boost sentiment on equities.
Congress passed an 11th hour deal to keep government funded through Dec. 3rd, averting a shutdown. That takes one Washington-related risk off the table, but Congress still needs to raise the debt ceiling by Oct. 18th. If it fails to do so, the Treasury will then need to make decisions about which of the U.S. government’s bills it won’t pay. Congress has gone through many of these brinksmanship debacles, but it has never not made debt payments. We expect a deal to be reached, but likely at the last minute.
This week also featured several Fed speakers, but most notably Chair Powell’s testimony in Congress. He spoke about the difficult tradeoff the Fed is facing with unemployment and inflation both elevated. The Fed has a dual mandate on fostering full employment and low and stable inflation. It would prefer to make more progress on the employment side before taking its foot off the accelerator pedal but inflation is testing its resolve.
The Fed expects that the worst of the recent run-up in inflation will prove temporary. That is a reasonable expectation. As the economy re-opened and Americans started travelling again, price spikes occurred in many travel related goods and services due to demand outpacing supply. Prices sharply rose for things like car rentals, hotel rooms and airline fares. These price spikes are expected to be one time, and will likely not keep inflation elevated on an ongoing basis.
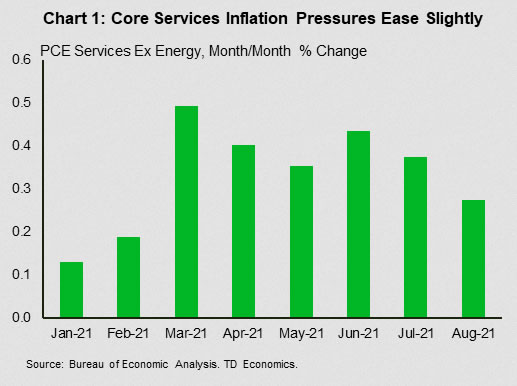
The August inflation data confirms this is occurring. The core PCE deflator – the Fed’s preferred inflation metric – was released on Friday and showed that core services inflation continued to ease from the hotter readings seen in the spring (Chart 1). Inflation is typically cited in year-on-year growth rates, and core inflation remained quite hot at 3.6% in August. We expect that while core inflation to remain high in the coming months due to base effects, it will moderate in 2022 (see our latest forecast).
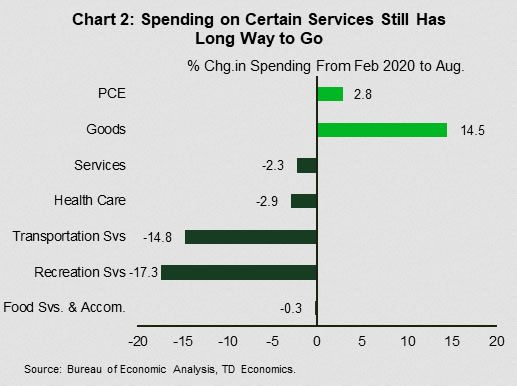
The release also provided some reassurance on the resilience of consumer spending. Growth in services spending cooled from the early days of re-opening. This is to be expected as more areas return to “normal”, spending growth returns to a more trend-like pace. That said, part of the slowing was due to consumer caution on the delta-variant, with spending at close-contact activities like restaurants, bars, and live entertainment falling in August. But, other areas are picking up, such as spending related to education and transportation. We expect the slowdown due to delta to prove temporary, and that there is plenty of pent-up demand in these depressed services sectors to drive above-trend growth in consumer spending in the fourth quarter (Chart 2).
Canada – From Downside to Upside Surprises
This was a week light on data, heavy on financial market developments. A risk-off tone dominated, with the S&P/TSX following its global peers lower on the week (down 2.1% on the week as of 10 AM). The WTI crude oil benchmark hovered near US$75 on mounting global energy and natural gas supply concerns. For Canada, this price strength is supportive for exports and income, though it is likely to contribute to higher consumer price inflation (see Special Feature below).
Turning to economic data, a dose of caution on the economy was warranted following the surprise second quarter contraction. But the past few weeks have offered signs that activity may be evolving decently in the third quarter, in line with our expectations. On this note, July’s industry-level GDP release was the key highlight. Canada’s economy contracted by 0.1% in July, a far better outturn than the -0.4% preliminary estimate for the month.
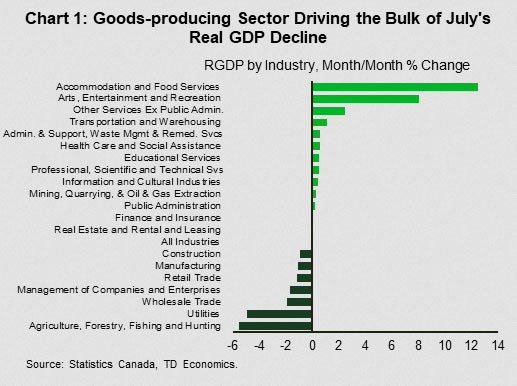
Chart 1 shows shows Canada’s real GDP growth by industry for the month of July. Declines were more centered in the goods-producing sector. Agriculture, forestry, and fishing saw the largest decline, at -5.5%, followed by utilities at -4.9%. Wholesale trade, management of companies, retail trade, manufacturing, and construction also saw declines on the month. The remaining industries saw expansions, with real GDP in the accommodation and food services top the chart at +12.5% and arts/entertainment/recreation following at +8.1%.
Despite the contraction, the report contained some silver linings, including an expansion in 13 of the 20 industries (Chart 1). In fact, underlying demand appears resilient, with idiosyncratic and supply-side impediments in the goods sector driving a sizeable portion of the decline. Case in point, the agriculture, forestry, and finishing industry saw a 5.5% decline on the month. Crop production in Western Canada is facing major setbacks on the back of severe drought conditions. Forestry output was also curtailed by wildfires in British Columbia and Ontario. Meanwhile, demand in the utilities industry, down 4.9% in July, was limited by milder weather trends in Central Canada. The manufacturing industry saw a 1.1% contraction on the month, but it is difficult to disentangle the roles of demand and supply in July. It is fair to say, however, that global supply chain disruptions have disproportionately disrupted this industry in recent months. The cooling in the housing market was another theme that contributed to July’s decline. Output in the construction industry declined 0.9% due to weak residential activity. Still, residential construction remains elevated relative to pre-pandemic levels. In contrast to the goods sector, the service sector showed signs of life. The reopening-led recovery in close-contact industries accelerated, with the accommodation and food services industry witnessing a 12.5% increase, joined by an 8.1% expansion in the arts and recreation industry. Elsewhere, the professional, scientific, and technical services – a consistently strong performer in the past year – expanded by an additional 0.5% in July. Another silver lining in July’s report is the healthy, 0.7% expansion projected for August.
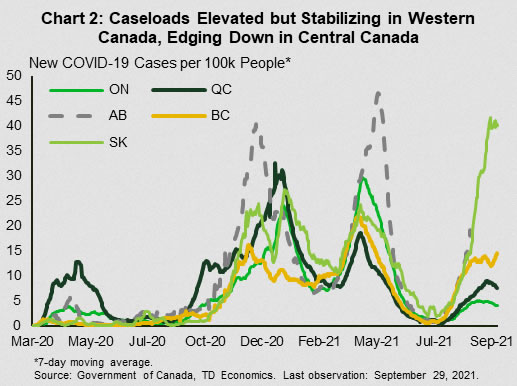
On a separate note, and though still early days, health indicators are offering some respite to concerns relating to Canada’s fourth wave. Alberta and Saskatchewan remain at a greater risk, but vaccinations in these regions have started to pick up. At the same time, caseloads and ICUs are slowly edging down in Canada’s largest province (Chart 2). High frequency indicators, including TD Spend data and mobility data, have displayed continued strength in September. All told, while we’re certainly not out of the woods yet, the trajectory is looking better for Canada during the second half of the year.
Special Feature – Global Energy Supply Squeeze Taking the Spotlight
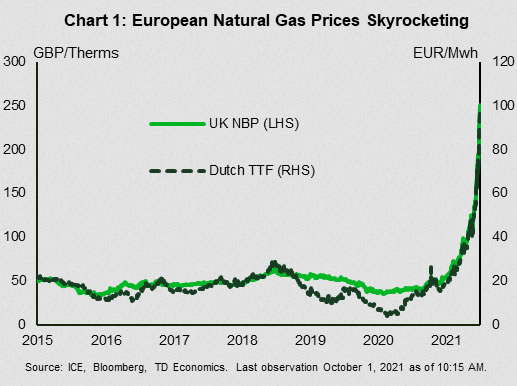
Add global natural gas shortages to the long list of supply chain disruptions impeding the global economic recovery and sparking inflationary concerns. The strong uptrend in natural gas prices has become more amplified in recent weeks, with the Northern Hemisphere faced with impending shortages as it approaches the winter heating season. Indeed, European benchmark natural gas prices are up more than 400% this year – and have risen more by around 90% in the past month alone (Chart 1). In Asia, spot LNG spot prices have also surged. And more recently, North American natural gas prices have joined the party, with Henry Hub futures reaching their highest levels since 2014 before pairing some of their gains. Spillovers are being felt across the energy complex. Despite a bearish U.S. inventory report, WTI oil prices are still hovering near US$75 on speculation that oil to gas switching would further tighten crude markets. Elsewhere, other substitutes (coal) and commodities relying on natural gas feedstock and heavy electricity usage (fertilizers, aluminum) are witnessing output reductions and surging prices.
The Economic Impacts are Already Being Felt
The winter heating season still hasn’t started, but this turn of events is already creating implications for inflation and economic growth across Europe and Asia. Case in point, China’s official manufacturing PMI slid into contractionary territory this week (to 49.6 from 50.1). In China, power rationing has been implemented across several provinces for industrial and residential users. Meanwhile in Europe, several small UK utility providers, caught off guard by the price increases, have failed. Power prices are rising across several countries, adding further upward pressure to already-high consumer price inflation. Indeed, early estimates suggest that Eurozone inflation increased to 3.4% (y/y) in September, the highest since 2008. Some European governments are already intervening to cap electricity rates and/or provide financial support to offset rising costs to consumers. There are mounting concerns that should this tightness continue it could also impact more vulnerable emerging market economies. Further, the impacts on factory output in China and Europe are flaming concerns around already constrained global supply chains.
Several Drivers Tightening European and Asian Natural Gas Markets
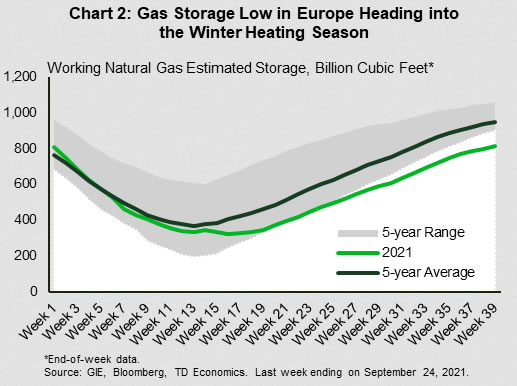
Shortages and supply chain disruptions have become more commonplace in the post-pandemic world. In the case of natural gas and power, a confluence of drivers – almost too many to list – have colluded at the wrong time to tighten markets. Like other areas of the global economy, demand appetite in some regions has rebounded strongly and faster than expected. On the supply side, the summer injection season in Europe is ending on a disappointing note, leaving inventories notably low (Chart 2). For one, flows from Norway and Russia to Europe dropped through the summer. Idiosyncratic events, including a fire at a UK-France connector, played a short-term role. Importantly, constraints to procure natural gas were seen elsewhere. Global LNG markets have been witnessing elevated demand and competition from the more longstanding buyers. At the same time, China has been cementing its position as an increasingly important player in the market while it tries to wean itself off coal-generated electricity. Brazil also contributed to the rise in global LNG demand, with drought conditions limiting its ability to produce hydroelectric power.
North American Markets Are Well Supplied, but Still Feeling the Pinch
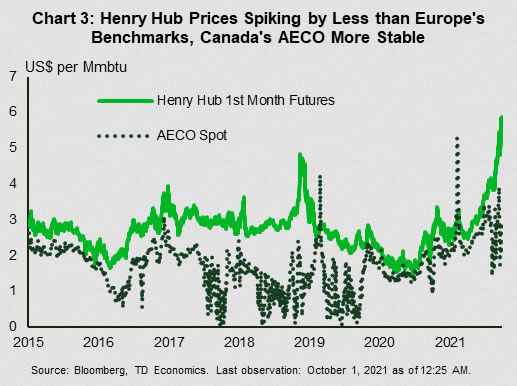
Against this tightening global backdrop, North American economies have started to feel the pinch. The recent spike in Henry Hub benchmark prices is a notable departure following years of lackluster performance. However, while some ripple effects are being felt through disrupted global supply chains and the small exposure of North American markets to LNG exports, North American economies are partly shielded by still-plentiful domestic natural gas production capacity. In Canada, AECO prices have risen this year, but by less than Henry Hub futures (Chart 3), with inventories closer to the five-year average, lesser exposure to the global LNG market, and lesser weather-driven production disruptions. Inventories in the U.S. are running below the five-year average. Recent storms impacted production in the Gulf of Mexico. But production is gradually recovering. LNG export capacity in the U.S. (around 11% of production) is limited by infrastructure, capping the ability of producers to direct more output towards the currently more lucrative external markets for the time being, and thereby partly cushioning the spillover effects.
“The Cure to High Prices is High Prices” Still Applies, but it Could Take Time
With global markets tight, the near-term outlook for natural gas prices will be at the mercy of weather. And all told, some volatility into Q4 would not be entirely surprising for the entire energy complex globally.
Europe is more susceptible to continued elevated prices through the autumn and winter given its notably low inventories and the lack of immediate alternative supplies. And, competition from other buyers will likely keep prices elevated. Indeed, China has recently indicated it will secure fuel sources regardless of the cost. Some areas of potential respite to Europe include an increase in Norwegian and Russian gas flows. Milder weather in the fall/winter would also be supportive. In North America, weather will also be critical in determining the trajectory of prices, and colder than expected spells could still result in near-term volatility given the lower than average inventory. But stripping away from short-term movements, domestic production capacity is still ample and should be able to respond to price spikes. Indeed, Henry Hub Natural gas futures are not signaling any lasting significant shortages, with prices projected to moderate from current levels and settle in the US$3-US$4.5 per Mmbtu range after next winter. In its latest Short-Term Energy Outlook, the Energy Information Administration (EIA) has forecasted a 2.7 billion cubic feet per day increase in production next year, with domestic consumption projected to remain flat due to higher prices.
The case for a more bullish oil market outlook in the fourth quarter has turned more compelling, especially as some OPEC+ members face difficulty in quickly ramping up production. But prices are still likely to moderate as U.S. production fully recovers from the late-summer hurricane impacts. Medium-term, with plentiful OPEC+ spare capacity and rebounding U.S. production, sustained rallies beyond current levels appear unlikely.


