USDJPY shot to the highest level in three years as the market waited for the upcoming US consumer price index (CPI) data. The numbers, which will come in the afternoon session. The data is expected to show that the country’s inflation rebounded in September as the aviation sector made a comeback. At the same time, prices will likely be boosted by rising energy costs. In the past few weeks, energy prices jumped as supply constraints continued. The Japanese yen also weakened after the country published the relatively strong machinery order numbers earlier today.
The GBPUSD pair held steady as investors wait for the latest UK GDP numbers that will come out during the morning session. Data by the Office of National Statistics (ONS) is expected to show that the economy continued to do well in August as the country reopened. Analysts also expect that manufacturing and industrial production rose by 4.1% and 3.1% in August. These numbers will come a day after the ONS published the relatively strong UK jobs numbers. The numbers showed that the country’s employers added about 207k jobs in September, pushing more analysts to price in a rate hike.
US futures wavered in the overnight session as investors waited for the start of the earnings season. Later today, companies like BlackRock, JP Morgan, and Delta Airlines will publish their earnings in the premarket session. They will be followed by other companies like Walgreens Boots Alliance, Bank of America, Wells Fargo, Morgan Stanley, Citi, and U.S Bancorp that will publish their results on Thursday. Analysts expect that these companies will publish strong results. However, they also expect the numbers to show that costs continued to rise.
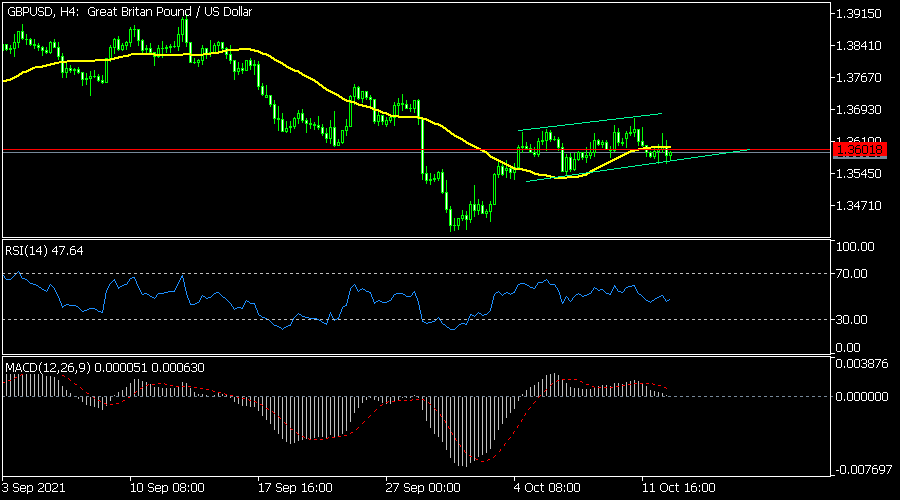
GBPUSD
The GBPUSD price was little changed ahead of the upcoming UK GDP data. It is trading at 1.3582, which was slightly above the lower side of the ascending channel. The pair has moved to the 25-day moving average. It has also formed a bullish flag pattern. Meanwhile, the MACD and the Relative Strength Index (RSI) are at the neutral level. Therefore, the pair will likely rebound later today as bulls target the upper side of the channel.
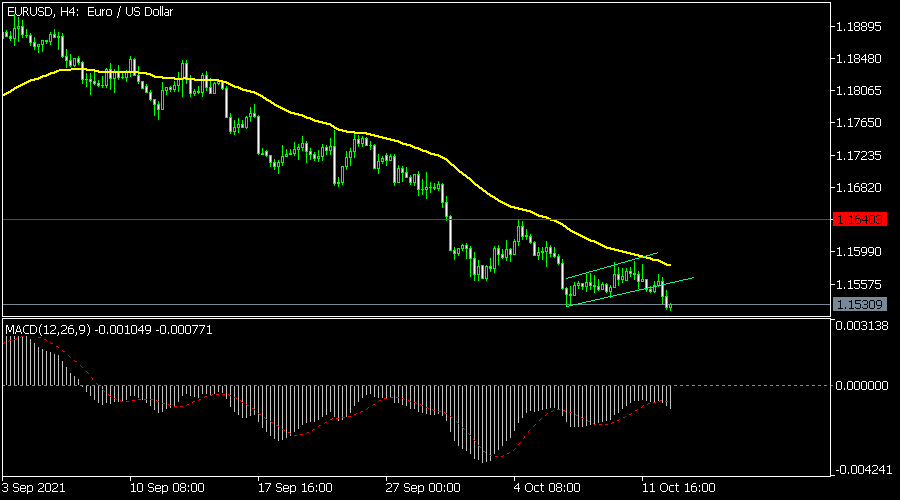
EURUSD
The EURUSD pair has been forming a bearish flag in the past few days. A bearish flag is usually a sign that an asset’s price will break out lower. This bearish breakout happened on Tuesday evening as traders waited for the upcoming inflation data. The pair crashed to the lowest level this year. Along the way, it moved below the short and longer-term moving averages while the MACD has moved below the neutral level. Therefore, the pair will likely keep falling although a break and retest pattern is also likely to happen.
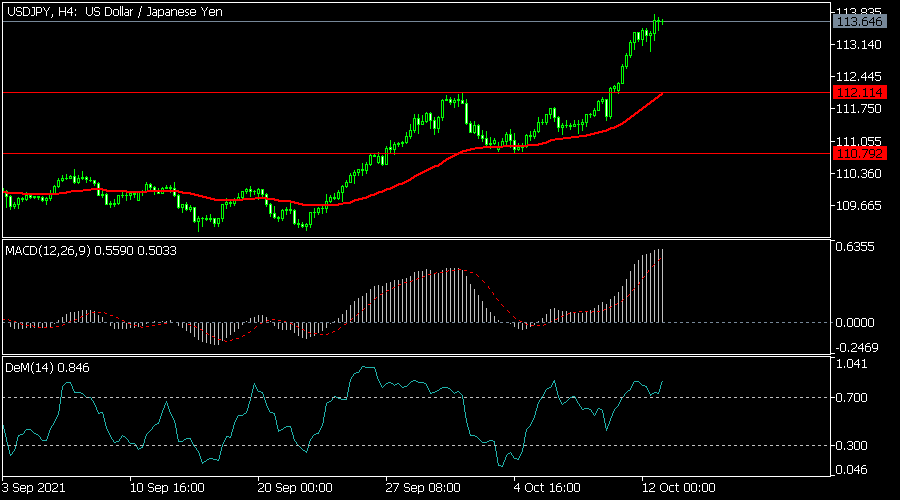
USDJPY
The USDJPY price continued its bullish trend as it rose to the highest level in more than three years. The pair rose to a high of 113.77, which was substantially higher than this month’s low of 110.80. On the four-hour chart, the pair is above the 25-day and 50-day moving averages while most oscillators have moved to the highest level in months. Therefore, the pair will likely keep rising as bulls target the next key resistance at 114.0.