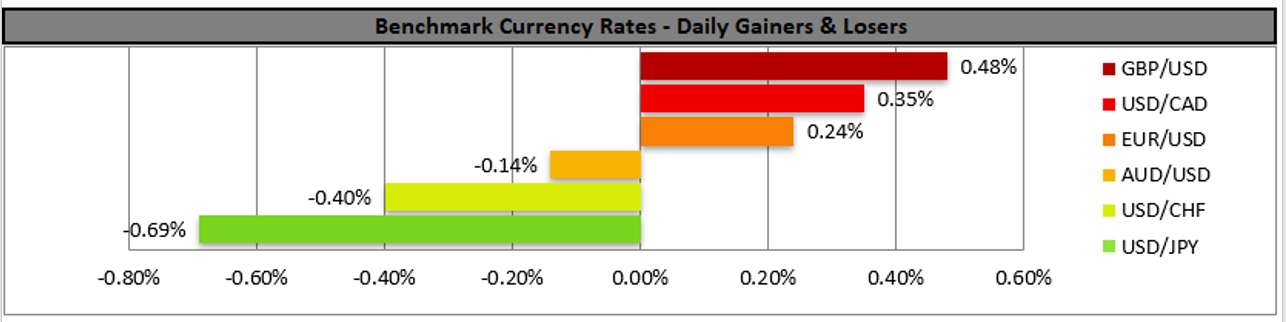
The USD edged lower against a number of its counterparts yesterday, sending some mixed signals with safe haven currencies like JPY and CHF being among the main gainers for the day. US stocks also tended to send mixed signals as worries in the market increased as the US Treasury Secretary Yellen repeated her warning that the US government may run out of money on the 15th of December and despite a temporary solution being found, uncertainty about the issue remains. As for financial releases, the construction data for October sent some mixed signals yesterday and today we note the release of the weekly initial jobless claims figure and the Philly Fed Business Index for November. On the monetary front we note the speech of Chicago Fed President Evans and should he sound more hawkish we may see the USD getting some support.
USD/JPY dropped yesterday, breaking the 114.45 (R1) support line, now turned to resistance before stabilising somewhat. As the pair’s price action has broken the upward trendline guiding it, we switch our bullish outlook in favour of a bias for a sideways movement for the time being. We may see USD/JPY moving between the 114.45 (R1) resistance line and the 113.70 (S1) support level. Please note that the RSI indicator below our 4-hour chart is running along the reading of 50, implying a market that has still to decide on the direction of the price action’s next leg. Should buyers have the upper hand, we may see USD/JPY breaking the 114.45 (R1) resistance line and aim for the 115.20 (R2) resistance level. Should a selling interest be displayed by the market, we may see the pair breaking the 113.70 (S1) support line and aim for the 112.90 (S2) support level which came in action on the 9th to 10th of November.
WTI prices drop after US Government’s call
WTI prices dropped yesterday as news emerged that the US has asked countries such as China, Japan and India, which are heavy users of oil to consider tapping their national oil reserves in a combined effort to bring oil prices down. It was also reported by Reuters that China’s State Reserve Bureau has stated that it was working on a release of crude oil reserves yet did not comment on the reports for the US proposal. It should be noted that oil prices dropped despite the EIA reporting yesterday a surprise decline in the US oil inventories for the past week which under other circumstances could have provoked oil bulls. EIA had reported that increased refining and rising exports were among the main reasons for the reduction of US inventories. Overall, we may see the releases from the strategic oil reserves of various countries actually exercising pressure on the oil prices, yet a correction of the oil market could be achieved only by a rebalancing of supply and demand levels in the long term.
WTI prices dropped yesterday clearly breaking the 79.00 (R1) support line, now turned to resistance and continued lower to test the 76.60 (S1) support line. We tend to maintain a bearish outlook for he pair as long as it remains below the downward trendline incepted since the 9th of November. Please note that the RSI indicator below our chart is at the reading of 30 confirming the bearish sentiment. Should the bears actually remain in control over the commodity’s price, we may see it breaking the 76.60 (S1) support line and aim for the 73.45 (S2) support level. Should the bulls take over we may see WTI reversing course, breaking the prementioned downward trendline, the 79.00 (R1) resistance line and aim for the 82.00 (R2) resistance level.
Other market highlights for today
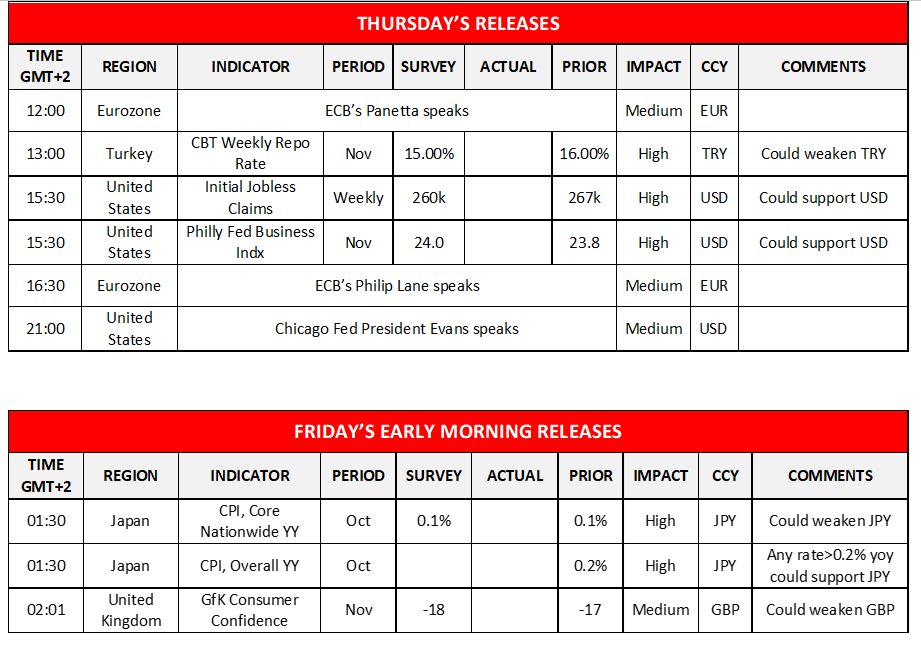
Today in the late European session we highlight the release of CBT’s interest rate decision. In Turkey the whole situation resembles a negative spiral with inflation being almost at 20% yoy and the bank preparing to proceed with another rate cut. TRY is being in a selloff against the USD and should the bank actually proceed with a deeper than a 100 basis points rate cut expected, or a warning that more rate cuts are to come we may see the Lira sinking further.
USD/JPY H4 Chart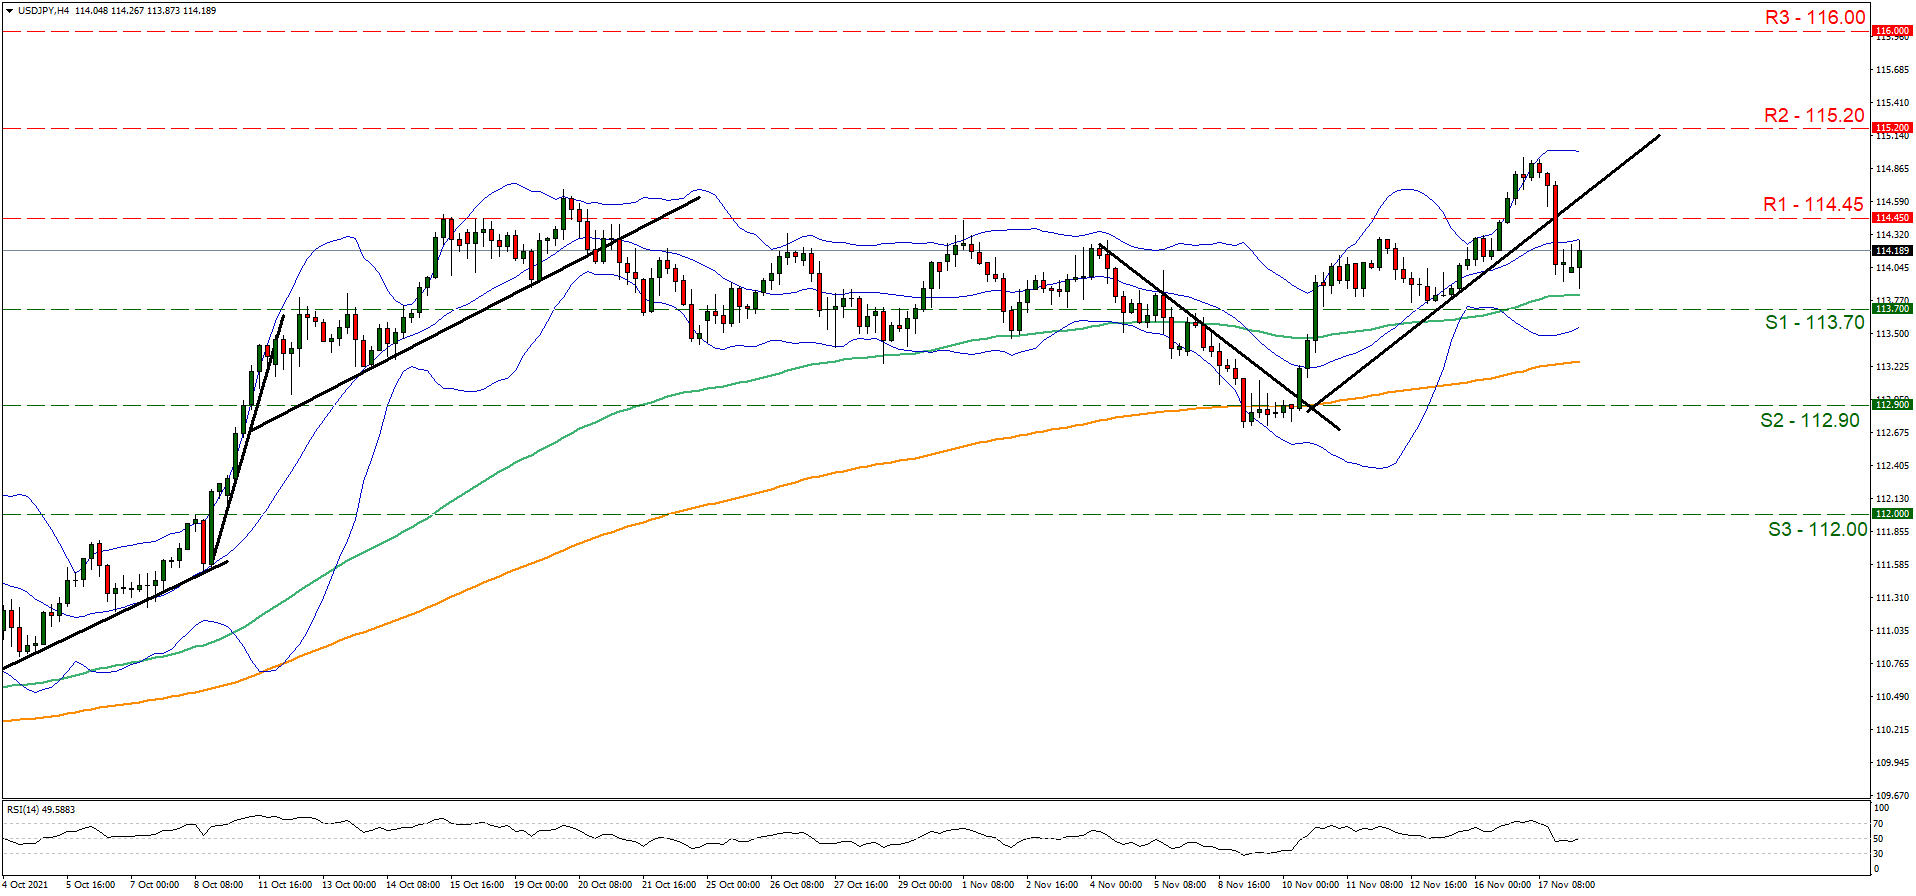
Support: 113.70 (S1), 112.90 (S2), 112.00 (S3)
Resistance: 114.45 (R1), 115.20 (R2), 116.00 (R3)
WTI H4 Chart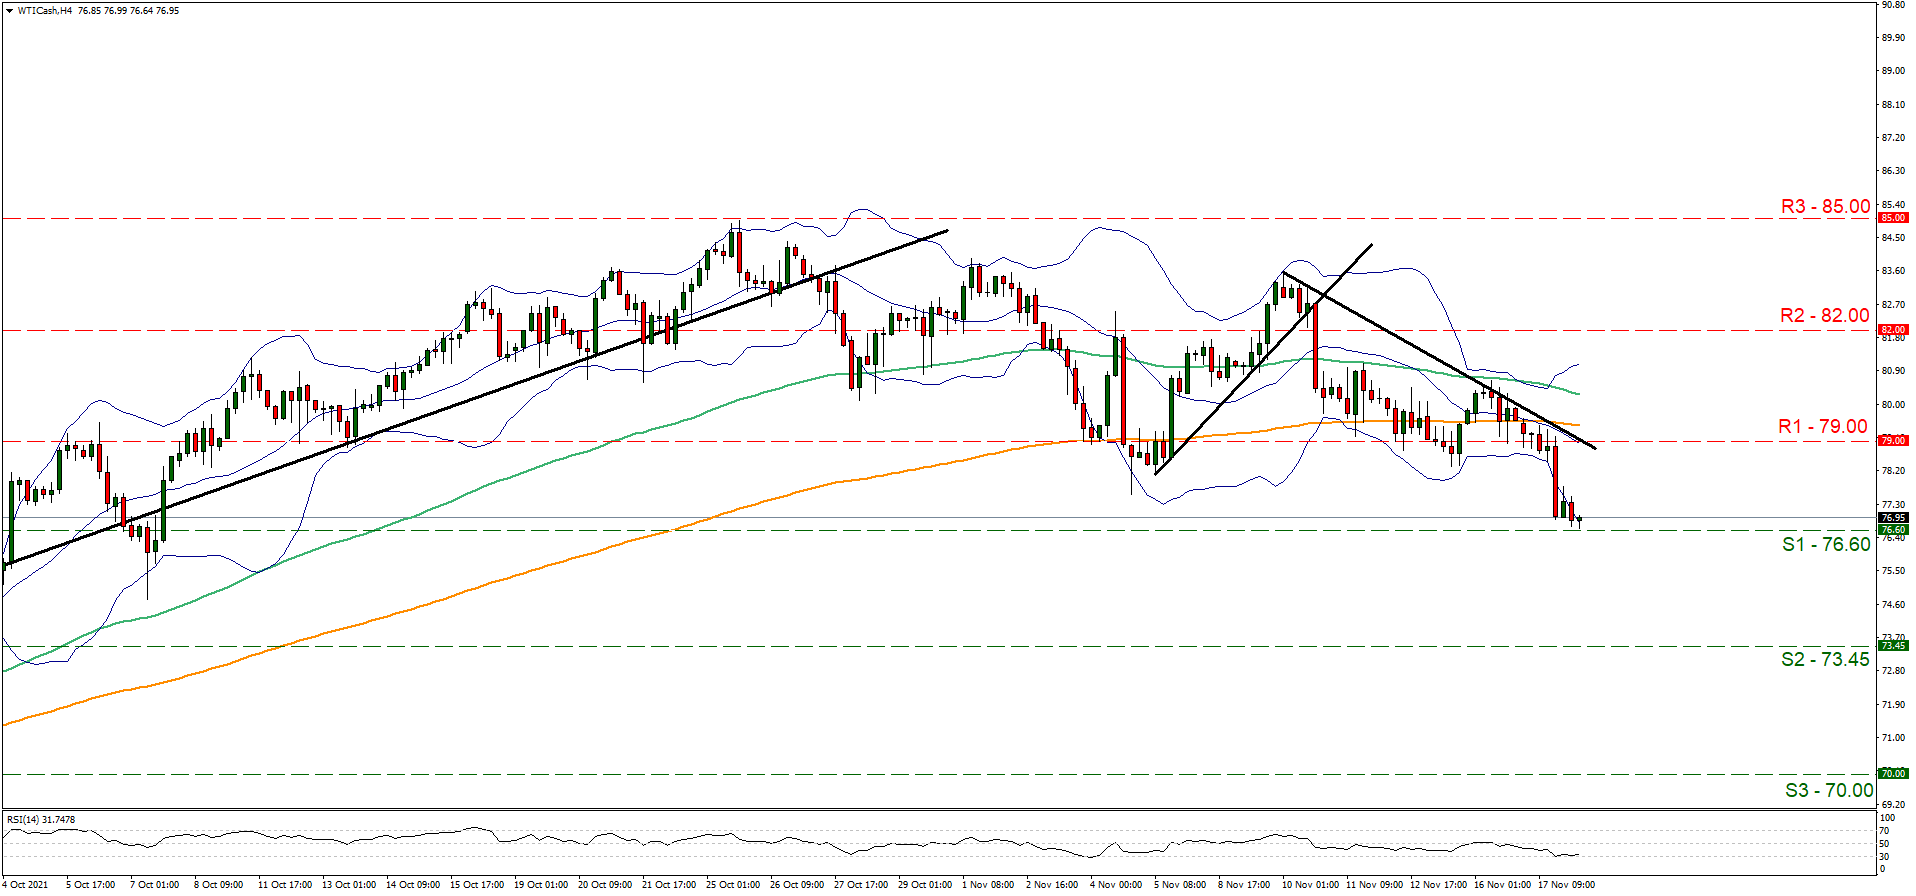
Support: 76.80 (S1), 73.45 (S2), 70.00 (S3)
Resistance: 79.00 (R1), 82.00 (R2), 85.00 (R3)